

Reconciling the Larger Count
Over the past week (and particularly this weekend), I’ve spent several long hours going through big picture counts on the major exchanges and sub-indices. I’m going to share my thoughts in a video (below), which looks at the final 5th wave of the NYSE, SP500, and NDX to see how they correlate and what the probable path forward is to a final top.
There aren’t any surprises, based upon the counts I’ve been presenting, but correlating two different exchanges that have differing structures (which have to top at the same time,), can bring with it some challenges — just staying on top of the changing counts.
Exchange counts can’t get out of alignment with their sub-indices on a grand scale, but the structures are often so different at market tops (where you can see non-confirmations, where volume is thin, and where there are forces are work trying to keep sectors up and prevent the inevitable crash), that it can be a real challenge keeping a valid count so that you can predict the probable outcome in a specific sub-index. All the attempts to avert the eventual market demise will fail, but the cool thing is, it doesn’t affect the Elliott Wave structure to a point where rules are broken.
Remember Elliott Wave analysis is all about probabilities, and you don’t have set-ups all the time, but it can be a valuable tool in identifying important inflection points and high probability outcomes.
It’s often extremely difficult to follow and atone for some of unexpected ups and down. However, in my years of technical analysis, I’ve learned that there’s a technical reason for everything that happens in the market. It’s a question of putting in the many hours it takes to do the work, uncovering the clues across several indices.
The big lesson here is (as I’ve been saying) is that you cannot be successful in market analysis if you’re not looking across the entire market in order to determine the highest probability direction of a single index.
The Big Picture Count
BigTopCountApr2019  |
 |
Make sure you zoom the video to full size with frame expander (arrows) in the bottom right hand corner and also set the quality to as high as your web connection allows. This is a high definition (HD) quality video so the best viewing is at that level. |
_______________________________
Elliott Wave Basics
Here is a page dedicated to a relatively basic description of the Elliott Wave Principle. You’ll also find a link to the book by Bob Prechter and A. J. Frost.
____________________________
Registration for Commenting
Want to comment? You need to be logged in to comment. You can register here.
If you register, it protects your information. It also allows you to comment without filling in your information each time. Once you’re registered, simply go to the home page and click on the login link top right in order to log yourself in. Usually, you’ll be logged in for several days before needing to be logged in again.
______________________________
Problem receiving blog comment emails? Try whitelisting the address. More info.
______________________________
Tops in your field DZ 2
Tops in your field …You are tops in your field. Tried to follow Elliot Wave international for years. They were always behind the market. After discovering you, I perceive that you are an expert in reading the waves, which puts you way ahead of the rest of your peers. And you can read the Waves like you are reading tomorrow’s financial section. I pray you stay healthy. —DZ |
Couldn’t be happier … KK 2
Couldn’t be happier …The analysis and insight you provide is simply amazing! I’ve been trading the futures and equity markets for well over thirty years and usually average around 5% monthly. Since joining your Traders Gold Service two months ago, that number has better than doubled. I couldn’t be happier.—KK |
The best of them JL 2
The best of them …Last couple of years, I subscribed to several ‘market traders’. You are by far the best of them and the personal contact is awesome. Daily and daily updates are very well written! Besides your expertise in EW, I also like your cycles analysis. Best investment I ever made! —JL |
Get an upper hand … JC 2
Get an upper hand in trading …Seeing all the different currency pairs and the wave structures and hearing you explain why this has to do that on a nightly bases gives one a upper hand when trading. Elliott Wave applies to all stock and indices and can be applied to any candlestick chart. If someone ask what you want for Christmas – Tell them a membership to Peter’s “Traders Gold!”—JC |
A true expert in Elliott Wave FL 2
A true expert in Elliott Wave …You are a true expert in EW analysis. What you provide is not available anywhere and is priceless. Subscription on your services is the best thing I have ever done. Many thanks for your effort to make me a better investor. I now have more trust in my investment decisions. I hope you will continue the excellent work! —FL |
the real deal SM 2
The real deal …‘Educational, insightful and thorough market analysis for all levels of traders. It’s Elliott Wave at its best….Peter Temple is the real deal’ —SM |
Rise above the rest … SM 2
Rise above the rest …I have only ever met a few people who, in their chosen fields (astrology, medicine, music, martial arts, technical analysis), rise above all the rest and you are one of them…you have ‘the gift’…and that’s why I’m a Trader’s Gold member. —SM |
Have not had a losing week RW 2
Have not had a losing week …I have been with Peter almost a year. The only thing that matters is have I made money with his service. I think I have finally turned the corner using Peter’s EW. I have not had a losing week in the last 5 months. Thanks Peter, for your amazing amount of hard work. —RW |
US Market Snapshot (based on end-of-week wave structure)
This chart is posted to provide a prediction of future market direction. DO NOT trade based upon the information presented here (certainly NOT from a daily chart).
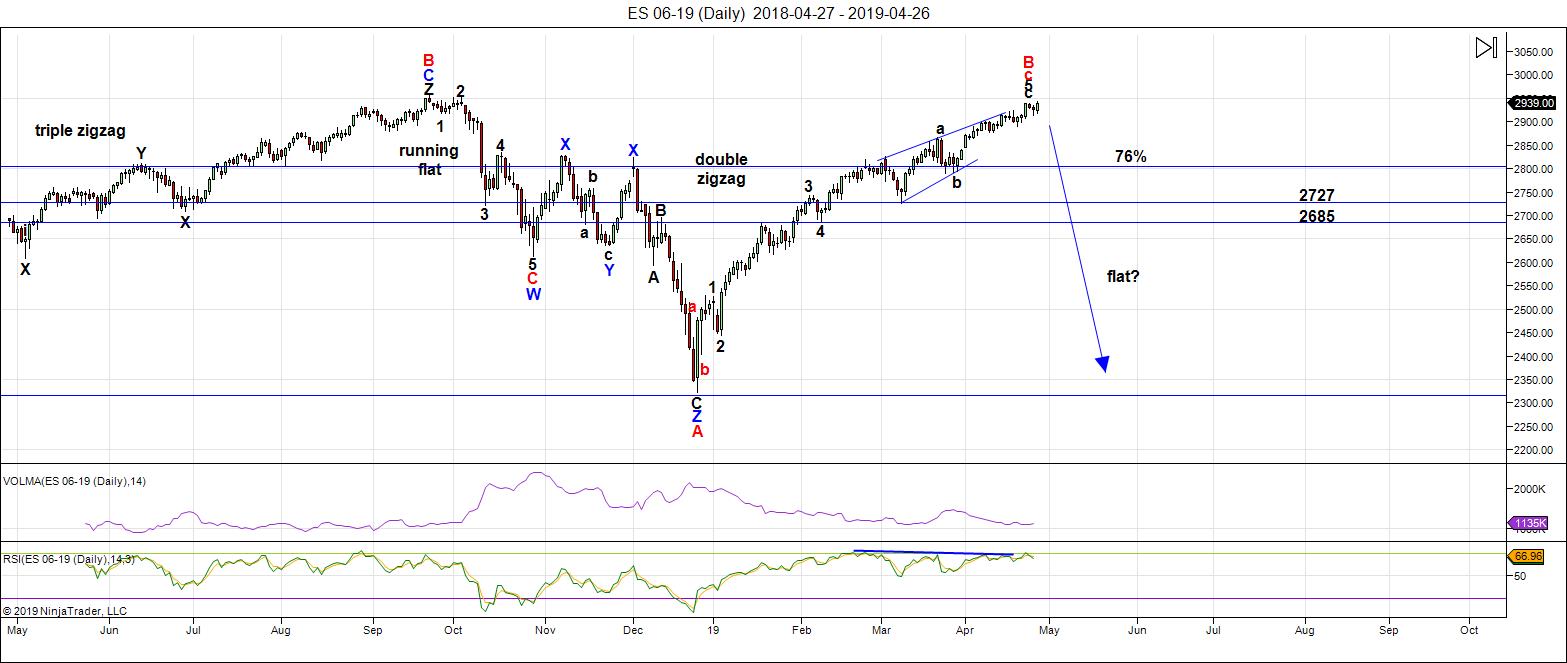
Above is the daily chart of ES (click to enlarge, as with any of my charts).
We've been sitting at the top now for about three weeks. As my Trader's Gold folks know, we've been in an expanding triangle for two weeks (this is an ending pattern).
ES has risen to well above the 76% level of the height of the previous set of waves down from the all-time high at October 3, 2018. Almost all the other assets I cover on a daily basis are hovering near inflection points.
As I've been saying over and over like a broken record, all major asset classes are moving as one. That requires them all to reach new B wave highs before they can turn down together. It's been like herding cats and has taken much longer than expected.
IWM (Russell 2000) still needs new interim highs before everything heads down in a dramatic capitulation — we're now about a dollar away from that top.
All these indices are showing signs of exhaustion, with gaps that are being left unfilled.
The next major move is to the downside.
The wave up from Dec. 26 is clearly corrective and, as a result, must fully retrace to the downside. This is supported by the US Dollar Index, the major USD currency pairs, WTI Oil, along with DAX, TSX, and other international exchanges.
Summary: My preference is for a dramatic drop in a C wave to a new low that should when all these asset classes I've identified have reached their targets. The culmination of this drop should mark the bottom of this large fourth wave in progress since January 29, 2018 - over a full year of Hell. It may be a dramatic drop that lasts multiple months, and will target the previous fourth wave area somewhere under 2100.
Once we've completed the fourth wave down, we'll have a long climb to a final new high in a fifth wave.
___________________________
Trader's Gold Subscribers get a comprehensive view of the market, including hourly (and even smaller timeframes, when appropriate) on a daily basis. They also receive updates through the comments area. I provide only the daily timeframe for the free blog, as a "snapshot" of where the market currently trades and the next move on a weekly basis.
______________________________________
Sign up for: The Chart Show
Next Date: Wednesday, May 8 at 5:00 pm EST (US market time)

The Chart Show is a one hour webinar in which Peter Temple provides the Elliott Wave analysis in real time for the US market, gold, silver, oil, major USD currency pairs, and more. You won't find a more accurate or comprehensive market prediction anywhere for this price.
Get caught up on the market from an Elliott Wave perspective. There’ll be a Q&A session during and at the end of the webinar and the possibility (depending on time) of taking requests.
For more information and to sign up, click here.
| "I think you are the only Elliot Wave technician on the planet who knows what he's doing.” |
| m.d. (professional trader) |
All registrants will receive the video playback of the webinar, so even if you miss it, you’ll be sent the full video replay within about an hour of its conclusion.


With the S&P hitting an ATH, doesn’t look like a “B” wave anymore. Doesn’t make any sense! Peter’s count must be off. All the other EW analysts have this as a 5th wave, which makes more sense Trade what you “see” not what you “think”. I don’t see a “b” wave any more so I’m trading for Charles Lloyd’s targets which have been amazingly accurate:
Went back through his previous posts before Peter banned him:
He called: 2850,2898, 2900 He hit all three of those!
Then said it would hit: 2930,2940,2950. He’s right on two of three there (so far)
Top end, he called: 2965, 3000,3040 These should get hit (in my opinion)
God, it’s amazing how people simply don’t listen to me or pay attention to Elliott Wave rules or patterns. Another black mark for the comments area. I’ll give it a week longer … unless I’m pushed. I honestly don’t have to time for this crap. Lawrence … go spend 14 hours on a weekend doing analysis every week and giving it away for free ….
Your mother would be very proud ….
I’ve got another a-hole telling I told people to go short. I can’t legally do that and I never have told anyone to go long or short at any time. Some of you folks need a brain!
Ignore, those ego testing comments and keep this beautifull blog in the air…
🙂
Ignore them, Peter. I am grateful for your analysis, I have always enjoyed our conversation regarding technical analysis in particular EW. Attacking someone’s work on their own website is very bad manners. Lawerence if you have an issue with Peter then don’t bother coming. Did he charge you money for his analysis? No. Grow up!
Great work Peter!
Thanks for the big picture perspective.
Apart from the internal techn icals, plain for all to see who care to look, the ubiquitous bullish salivating at the end of a corrective wave is testimony to how truly clever the banksters are. I have never seen anything quite like it!
Great info!
Curious about why the fifth of C subdivides as an abc…don’t recall ever seeing this for a “C” wave.
What am I over-looking?
I’m done with the comments area of the free blog. Too many ungrateful people who aren’t willing to understand this science.
It is way too much work to read the ignorant comments of the trolls and low-IQ idiots and then put them on moderation. I’ve tried to be helpful but I’m way past the end of my rope.
I hear you Peter. I was absolutely stunned to see that first post after the new blog went up.
On reflection, NOBODY is that clueless! I think it was a brazen attempt to get a rise out of you.
Just my two pence.
Well, Verne,
That’s what I thought but I’ve changed my tune.
I have blogged twice about corrective waves being difficult to gauge the top of. I’ve also stated on several occasions that I do not like to trade 4th waves because they can be so unpredictable. I am not in the business of advocating trading one way or the other. I have never suggested a trade in this free blog.
I’ve never said this wave up in ES is going down, but I’ve warned about possible tops and that it’s a corrective wave and will eventually fully retrace. Any Elliott-waver knows that you wait for a first/second wave combination to determine a trend change (which I’ve stated numerous times), but to these folks, rules don’t seem to matter. We haven’t seen that combination yet. All I’m doing is using Mr. Elliott’s work to explain what’s happening and warn that this is a corrective wave and will completely retrace.
I continually get accused of all kinds of wild stuff that simply isn’t true. This is supposed to be an educational site about EW, but is completely lost on the low IQers. I have no interest in people posting wins and saying how wonderful they are. What’s with that? It has nothing to do with the original intent of this site.
I have had people telling me to change the count to something they’d like better. Well, we haven’t yet changed the rules of gravity yet, even though things dropping to the ground can be a pain. Cops don’t like it when people blow through stop signs because they don’t like those rules (ie – you’re supposed to stick to the rules). But changing the EW “laws of nature” in terms of the market seems to be OK for these folks.
Mr. Elliott came up with a set of rules. If you don’t like them, don’t blame me. Go invent your own system.
And then I get Loser Lawrence suggesting that an expanding triangle (on page 50 of the EW Principle book) doesn’t make any sense and that I don’t know what I’m talking about. What a load of crap!
I also have no interest in reading comments here or policing the children when they want to piss on each other. It’s better to be done with the whole thing. It’s a waste of my time.
This is no way demeans the wonderful additions of those commenters who add value to this blog. However, for me, the negatives now outweigh the positives.
When I want to know what the hell is REALLY going on, I come here.
What is going in currently is really not at all surprising. You tend to see this kind if irrational bullish foaming at the mouth right before Mr. Market is about to hand the sorry asses of clueless bullish traders to them.
Meanwhile, folk who are paying attention to the plethora of red flags, both in terms of the wave structure and the abundant larger macro-econmic signs are quietly going about the business of preparing for what is dead ahead. I
Previously mentioned Mencken’s observation about underestimating the public’s intelligence and that observation still obtains. We do after all, need suckers to take the other side of that trade, now don’t we? 😜
haha. We absolutely do!
Peter we appreciate your blog, Chart Show, Trader’s Gold and all things you do. A lemming without a plan needs a “Charles” for his emotional support because all he has is hindsight bias. As they said in Bonnie and Clyde when the car didn’t work… “Dirt in the fuel line, just blowed it away.” Handle it the way you want your service to be! It’s your business! All the best to you with your services and dealing with the dinky things.
“Every trend must go to it’s grotesque extreme and evoke its own reversal”
P.Q. Wall
Martin Armstrong who tech does not do Elliot Wave believes that the test of lower support is still possible.. we have not crossed the level in the Dow yet to invoke a full bull ..but yes it has been bullish..
Peter, please ignore the trolls! You will eventually be proven right then you should publicly shame those who doubted your expertise. I don’t see them spending hours each day and starting a blog. Gee wiz! Ungrateful much?
Peter, I think people are being impatient.
Sometime in September or October, I think you will eventually be proven right. That’s when most crashes happen, correct? Hang in there a few more months Peter. This will eventually keel over. Maybe the crash of 2019 will be in October like 87?
I personally had to throw in the bearish towel when the S&P crossed back above 2800. I’ve been seeing a number of publications showing that when the market recovers like this, it’s a very bullish signal.
I know there’s a first time for everything, but for those who like to review history:
“One year after the S&P 500 recovered its losses and set a new all-time high, it traded higher every time (average gain since 1980: 12.66%, average gain since 1928: 11.20%).”
http://www.marketwatch.com/amp/story/guid/6829D8AC-6822-11E9-ACA1-3F2BE0CA201C
Odds not looking good for a crash in 2019 IMO.
-Prof Hawk
Hello Peter and friends
enjoyed that video Peter
nice work and confirms what the energy charts are showing
for the coming month.
Energy chart for this week attached below, enjoy!
https://ibb.co/cXLkp9K
Thanks Tom!
Folk may want to also take a gander at the chart of 3M.
That, folk, is generally the destiny of rising wedges!
Oh, I keep forgetting…”This time is different…!” 😁
Thanks Tom!
Marie
You mentioned PQ wall . That guy was funny and pretty good .
Peter T
I hate 3 wave moves as well as 4 th waves . I understand your frustrations
With the message board . I find that most other Elliott wave sites pretty much
Copy each other . On that note you are all alone which I find a good thing .
It’s impossible to call a 3 wave move impulsive yet people do it all the time.
Those that don’t really understand Elliott wave principal will always gravitate
From one ” guru” to another , following last month’s call and never really take
The time or put in the energy to do their own hard work .
Prechter once stated a B wave can go where ever it wants to . Other state a B wave
Can only go so far . And other claim a B wave generally goes x % .
My point is , regardless of where a B wave goes . ITS A “B” WAVE !
If it’s not a 5 wave move it cannot be an impulse ( period ! )
The move off the Dec lows began looking impulsive but that changed .
There is no possible way to call this an impulse .
I’ll stand with you on that .
No opinion about the future direction about the market at this time.
Tom C
I was finally able to read that fed reserve article you gave us a link to .
I kind of skimmed through it so I need to go through it in detail .
One thing did catch my eyes though that kind of validated the research .
I always count 39 hours from the start of a solar Storm . The article noted
A 40 hour lag . My own research pretty much matched . Thank you
For passing the info along . I’ll take it further .
I have some other stuff I’m planning on going into as well which was touched
On in the Fed article but not in detail .
Enjoy the week 🙂
You’re right. B waves can go “almost” wherever they want. You just have to wait until the end and watch for the confirmation of a turn. Trading them is playing with fire. Too risky for me.
And this B wave is a correction of a correction …
Hi Joe – I always look forward to your comments and analysis. What is the best way to keep up with your insights once Peter shuts down the free comments area of the blog? I would hate to miss out on your insight. I have been learning so much studying items you mention.
Thank you Mr. Temple for the new post. There’s always trolls no matter how good one is. You can simply ignore non-scientific comments. A lot of good people respect you and appreciate your work, which is why we see many contributing, quality commenters exchanging/sharing ideas here.
🙂
Thank for all your hard work….Peter ..it is appreciated..
🙂
Peter thanks for your post. I know B waves can extend much further than normal so not surprised. The trolls come out in force when the market is about to make a major turn so whilst i can imagine the immense frustration it probably is just validating your call for a top. People have short memories. All of the sharp drops in the last year and a half have happened after a prolonged bull run where people gave up with the bear only for it to turn. I doubt this is any different.
🙂
Hi Peter,
Very good work, congrats.
Have some questions to really understand what is happening (complex situation, as you said):
– is it unusual that NDX is not in sync with other indices (wave counts)?
– INDU vs TRAN > TRAN seems to be weaker, is it a sign that the markets could drop?
– can you predict a time-frame for a move down (approx)?
Thanks
Best regards
Serge
INDU vs TRAN
http://schrts.co/bIxQuXHP
NDX is a different exchange, and it is somewhat in sync usually, but I’ve never seen it in lock-step, as it is now.
Trans have what appear to be 5 waves down. That could be a signal that we’re close to a top.
Can’t give you a timeframe.
Peter T,
Thank you for bringing your read on EW and markets to all of us with different levels of knowledge and skill. I am NOT even close to understanding EW and how to apply it, but I learn a lot from you and apply it to my systems and strategies. Timing is tough to impossible to predict, as you remind us. Another service I use says we are in Quad 3 (growth slowing, inflation rising… in 2nd degree rate-of change terms) for the next 2-3 quarters, AND… MARKETS ALWAYS PEAK IN QUAD 3! So your work is very important! Don’t get discouraged by folks expecting you (and everyone) to tell them the exact day of the turn…. it’s the herd’s response
🙂
iwm..hit top.. exhaustion gap up fingers crossed..
Casey points out some macro-economic headwinds currently a’ blowing.
https://www.zerohedge.com/news/2019-04-28/brace-yourself-next-epic-collapse-could-be-weeks-away.
Serge..I use stock charts..how did you get your graph to link here?..
Hi Marie,
At the bottom of the graph layout, you have a series of buttons.
In the middle, one is described as PERMALINK.
You just click on it and you get the link.
Cheers
Serge
thank you..sometimes computer challenged
Shooting star at apex of ES rising wedge on 5 min.
Will we see yet one more negation?
Banksters are busy little beavers! 😎
Meant to say 15 min.
Confirmation with break of lower wedge boundary prior to session end.
NDX 100 will probably lead the way the way down with break of 7742.77
Energy chart update
https://imgshare.io/image/april-29th-evening-energy-chart-update.N2GiF
I had a premonition of a sudden 500 pt. drop coming soon in the markets.
This week? Then guess it might be on 5/2 according to your chart. Thank you.
my bet is on Monday May 6th
Got it. Thank you Tom!
Aaron
This is the only site I post my thoughts on . I’m glad you enjoy my thoughts .
As for the markets my intent is to take on a few bearish positions next week
And I’m pretty much going to enter regardless of price action .
Not saying anyone else should adopt this style of trading because the risks
Can be huge . I’ll exit the last week of may at the latest .
I’m not able to run a full fibonacii count but we should be aware this market
Is now in its 19 th week including the lows of December .
Dec 24 2018 plus 144 calender days is may 17 th .
Oct 3 2018 plus 233 calendar days is may 24 th
Check my dates since I’m going by memory .
Ideas like the Oct high to Dec low and Fibonacci ratio time retrace
Jan 2018 high to Dec low and Fibonacci ratio time retrace
Trading days from Dec 24 and Dec 26 .
The idea is to find the cluster from all Fibonacci methods .
Just noting the possibility of Fibonacci showing up .
My reasoning for taking some bearish positions is for other reasons .
Next week will be week 20 .
March 6 2009 to date is 3706 calender days
61.8*61.8 = 3819.24
Add that to March 6 2009 ( you could use March 9 as well )
Date: August 20 2019 is going to matter big time .
That is just an example .
I’ll be we see many Fibonacci time relationships begin to show
Themselves .
Untill next week 🙂
https://m.accuweather.com/en/weather-news/photos-unusual-spring-storm-blankets-chicago-in-snow-more-than-700-flights-canceled/70008125?fbclid=IwAR3SlbHY6BeDz8OlTXuL5o9QXRmwxDoHmUzuEvCB30Yn7-fHfT1nf9ayvTA
We are now headed into the month of the well-known adage:
“Sell in May, and go away!”
It so happens we are doing so in a context of some of the most extreme over bought with negative divergences, and relentless volatility compression we have seen in awhile. Nonetheless, the herd is giddy. Tom’s reference to an index possible gap down is interesting. Francesco Filia is saying the same thing and that is exactly what I expect from a leveraged unwind. It may be that stocks like 3M, INTC, and FEDX are giving us a glimpse into the future. I know a lot of traders are bragging about how their tight stops will lock in their huge upside gains. Many of them are about to learn the painful lesson of failing to scalp counter-trend rallies, even when they persist.
I would however, not load the wagons just yet.
Knowing the banksters, they are going to try and violently dispel any notion of any selling of any kind in the month ahead. There is also seasonal first of the month bullishness so I am looking for some kind of pop, even if very brief
If we see a gap down at the very start of the month that would in my view be uber bearish.
It would suggest to me the banksters are getting the hell out of Dodge under cover of monthly pension inflows.
Look for 7742.77 NDX 100 break.
Other indices should confirm.
If not. Head fake! 😊
I see same.. dow ..so right now 4 down..possible triangle or drop between 26400, 26200 area then back up for one more pop…but would be nice if failed…
Yeh, this environment (earning decelerating, inflation accelerating) for possibly 3 quarters and more difficult comps has most variability in returns from sector bet prospective (about half longs and half shorts). With May upon us should be interesting if divergence increases. Markets always peak in this quad environment, but will it happen soon and how deep?
watching HUI on 2 hour chart..if macd crosses could be a good dust pop..for wave 5 down..
to correct..I think I have it as 5 down of (3)
been watching a crazy spec stock more for a possible pop..IGC dollar stock..
Could there be a stealth breakout with VIX? :/
on that one I am watching the weekly chart if..slows stock..crosses back up.. will buy in with a stop…
Hope so..I have had some money stuck at 26.50 in vxxb..so would be nice to get a pop from that today..
They may pay you now, or they may pay you later, but no worries; they WILL pay you! 😉
I’m going to back off from my angry tirade on the weekend (which I don’t apologize for) and leave the comments area open. There are a lot of very good people here who contribute great amounts of helpful information and I just don’t think it’s fair to “shut down the class” because of the occasional asinine troll who doesn’t know anything about markets or EW and more importantly, insults anyone here, whether it be me or other contributors.
Dissenting opinions are just fine, but there should be something to back up the position, some reasoning as to why that position has any merit (you know what I mean). This is an educational site and that is the primary reason for its existence. It’s not a place you let your ego run wild and tell everyone how wonderful you are by posting successes. I don’t have any interest in that kind of content.
So I’m going to outright ban anyone who breaks the rules. I simply don’t have time to monitor comments that go into moderation, so that option is coming off the table.
Doing this work demands a high degree of concentration and distractions have a very negative affect on my ability to do my work accurately. When this “free blog” gets in the way of that ability, that’s where I draw the line.
Thanks to so many of you who have sent me notes of support; they certainly made a difference. We’ll see how it goes from here.
Awesome!
Not too many places left for informed discourse….Muchas Gracias!!! ☺
I’m grateful for your generous understanding!
:))))
Despite the lower NDX 100 break, the banksters are evidently not quite ready to unwind.
They are clearly STILL defending the SPX 2900 and DJIA 26,500.00.
Here’s the thing. The NDX break is still significant. Just because they are defending those pivots does not mean Mr. Market has to comply. This should be interesting.
Double tops everwhere. Truly amazing.
Do the banksters have the firepower to engineer false upside breaks from these levels?
Nothing they do any longer surprises me.
Let’s see what they have left in the tank! 😛
The banksters are buying as evidenced by the long candle tails.
An SPX break of the lower channel around 2920 brings the 2900 level into play. An initial break followed by a back-test would be lovely! 😎
Battle to drive VIX back below 13 and safeguard the riris/parity trade underway.
Ideally we will eventually see a significant gap higher in VIX to signal abandonment of that trade.
The historic short vol trade mandates a WTF! moment for the short vol cohort! 😁
Hyuk! Hyuk!
It looks like some big traders are screwing with the banksters’ start of the month game plan and jumping the gun..hehe!
Not good for them. The really need that inflow to execute that distribution on exit and they simply cannot have renegade traders mucking up the works. I expect them to engage in some serious pump…prior to the dump…! 😁
Yeh, low volume push and pull has sectors fighting each other make charts & candles hard to move with conviction. I kinda like it 😉 I’d rather markets react AFTER Fed-talk than Fed react to WTF moment. This seems like slow-motion semi-glee we rode through last summer… before the Oct-Dec selloff. I think the May-June period discussed by y’all makes sense (markets don’t make sense 🙂 IF markets pre-empt earnings reports for 2nd and 3rd quarters (reported in 3rd and 4th qtrs). Or maybe banksters keep dumbing down expectation as Goldilocks.
The candle wick on VIX this morning is hilarious. Pre-Fed fodder.
Yeh! Lol!
The smart money continues to accumulate long vol.
They are going to have to re-double their efforts to drive it back below 13.00
Fascinating slugfest over open gaps. The banksters are going to have to leverage past if they hope to close them. If they do, we head back to to test 2950; if they don’t we break 2920. We should know by the close…
Yowza! Look at those 1 min candles! Banksters fighting tooth and claw!
O.K evrybody. Let’s celebrate the blog’s survival by packing out the Chart Show tomorrow.
Peter you’re buying the beer! 😁😁😁
just rambling. ( thanks Peter t for keeping everything as is )
I noted a few Fibonacci date considerations above
Then I read this which is not market related .
I laughed and thought is Pelosi going BIGLY ?
House Speaker Nancy Pelosi and Senate Minority Leader Chuck Schumer told reporters after meeting Trump at the White House that they had a “productive” and “constructive” meeting, and that all participants wanted to do something “big and bold.”
“We agreed on a number, which was very, very good — $2 trillion for infrastructure,” said Schumer, a New York Democrat. “Originally, we had started a little lower, and even the president was eager to push it up to $2 trillion. That is a very good thing.”
Schumer said Trump would present his ideas on funding when another meeting is held.
“We did come to one agreement, that the agreement would be big and bold,” said Pelosi.
( I have to wonder who is affraid of AOC , my thought )
https://www.marketwatch.com/story/pelosi-schumer-trump-agree-on-2-trillion-for-infrastructure-spending-while-leaving-funding-in-doubt-2019-04-30?siteid=yhoof2&yptr=yahoo
how to fund it? how did they fund QE? YES! out of thin air…….. LOL
https://www.cnbc.com/2019/04/29/fed-looking-at-a-program-that-could-be-version-of-quantitative-easing.html
TWS weekly pattern on DRIP on track…
Yeh, I know but my concern it’s doing it under the recent death cross. I know that is not a “trading” concern, but energy and oil are favorite sectors in this quad3 thing I am following, so guidance has been to buy energy at bottom of range. Bought some CNQ on recent PB, so watching both sides of this.
Leveraged move to 2950 got sold pretty hard…they are going to have to try harder… 😊
Energy chart update
https://imgur.com/a/w13igv8
Thanks Tom. BTW, curious how you react to an inversion day. Do you give the market some time in the morning before you decide if it is time shifted or inverted?
Hi P.
that is a very good question
and yes
allowing the market to play out a bit can help confirm direction
I also have other tools that help me with that issue.
Thank you Tom. Then please share when your tools detect an inversion, only if time permits 🙂
I set up comparison charts from multiple streams
if any of the streams need to be inverted in order
to make them all match then an inversion possibility is at play.
I also try not to trade on a Monday because the close of Monday trading tells me how much time shifting I need to do and in what direction. This week it was 2 hours forward. Energy is very fluid and tough to nail down but I try my best to keep on top of it.
Hi P:
Please don’t take offense at this and I know that Tom is quite generous. But it is considered very bad form to put a trader on the spot by publicly asking him to disclose trading methodology that he has not volunteered.
I am just hoping we can keep the forum, for as long as Peter permits, a class act. I hope you don’t mind me pointing this out. Better to send a private request which would give Tom more options.
Appreciate it!
This website is for educational purposes relating to Elliott Wave, natural cycles, and the Quantum Revolution (Great Awakening). I welcome questions or comments about any of these subjects. Due to a heavy schedule, I may not have the time to answer questions that relate to my area of expertise.
I reserve the right to remove any comment that is deemed negative, is unhelpful, or off-topic. Such comments may be removed.
Want to comment? You need to be logged in to comment. You can register here.