

Reconciling the Larger Count
Over the past week (and particularly this weekend), I’ve spent several long hours going through big picture counts on the major exchanges and sub-indices. I’m going to share my thoughts in a video (below), which looks at the final 5th wave of the NYSE, SP500, and NDX to see how they correlate and what the probable path forward is to a final top.
There aren’t any surprises, based upon the counts I’ve been presenting, but correlating two different exchanges that have differing structures (which have to top at the same time,), can bring with it some challenges — just staying on top of the changing counts.
Exchange counts can’t get out of alignment with their sub-indices on a grand scale, but the structures are often so different at market tops (where you can see non-confirmations, where volume is thin, and where there are forces are work trying to keep sectors up and prevent the inevitable crash), that it can be a real challenge keeping a valid count so that you can predict the probable outcome in a specific sub-index. All the attempts to avert the eventual market demise will fail, but the cool thing is, it doesn’t affect the Elliott Wave structure to a point where rules are broken.
Remember Elliott Wave analysis is all about probabilities, and you don’t have set-ups all the time, but it can be a valuable tool in identifying important inflection points and high probability outcomes.
It’s often extremely difficult to follow and atone for some of unexpected ups and down. However, in my years of technical analysis, I’ve learned that there’s a technical reason for everything that happens in the market. It’s a question of putting in the many hours it takes to do the work, uncovering the clues across several indices.
The big lesson here is (as I’ve been saying) is that you cannot be successful in market analysis if you’re not looking across the entire market in order to determine the highest probability direction of a single index.
The Big Picture Count
BigTopCountApr2019  |
 |
Make sure you zoom the video to full size with frame expander (arrows) in the bottom right hand corner and also set the quality to as high as your web connection allows. This is a high definition (HD) quality video so the best viewing is at that level. |
_______________________________
Elliott Wave Basics
Here is a page dedicated to a relatively basic description of the Elliott Wave Principle. You’ll also find a link to the book by Bob Prechter and A. J. Frost.
____________________________
Registration for Commenting
Want to comment? You need to be logged in to comment. You can register here.
If you register, it protects your information. It also allows you to comment without filling in your information each time. Once you’re registered, simply go to the home page and click on the login link top right in order to log yourself in. Usually, you’ll be logged in for several days before needing to be logged in again.
______________________________
Problem receiving blog comment emails? Try whitelisting the address. More info.
______________________________
A true expert in Elliott Wave FL 2
A true expert in Elliott Wave …You are a true expert in EW analysis. What you provide is not available anywhere and is priceless. Subscription on your services is the best thing I have ever done. Many thanks for your effort to make me a better investor. I now have more trust in my investment decisions. I hope you will continue the excellent work! —FL |
Couldn’t be happier … KK 2
Couldn’t be happier …The analysis and insight you provide is simply amazing! I’ve been trading the futures and equity markets for well over thirty years and usually average around 5% monthly. Since joining your Traders Gold Service two months ago, that number has better than doubled. I couldn’t be happier.—KK |
the real deal SM 2
The real deal …‘Educational, insightful and thorough market analysis for all levels of traders. It’s Elliott Wave at its best….Peter Temple is the real deal’ —SM |
Get an upper hand … JC 2
Get an upper hand in trading …Seeing all the different currency pairs and the wave structures and hearing you explain why this has to do that on a nightly bases gives one a upper hand when trading. Elliott Wave applies to all stock and indices and can be applied to any candlestick chart. If someone ask what you want for Christmas – Tell them a membership to Peter’s “Traders Gold!”—JC |
Rise above the rest … SM 2
Rise above the rest …I have only ever met a few people who, in their chosen fields (astrology, medicine, music, martial arts, technical analysis), rise above all the rest and you are one of them…you have ‘the gift’…and that’s why I’m a Trader’s Gold member. —SM |
Have not had a losing week RW 2
Have not had a losing week …I have been with Peter almost a year. The only thing that matters is have I made money with his service. I think I have finally turned the corner using Peter’s EW. I have not had a losing week in the last 5 months. Thanks Peter, for your amazing amount of hard work. —RW |
Tops in your field DZ 2
Tops in your field …You are tops in your field. Tried to follow Elliot Wave international for years. They were always behind the market. After discovering you, I perceive that you are an expert in reading the waves, which puts you way ahead of the rest of your peers. And you can read the Waves like you are reading tomorrow’s financial section. I pray you stay healthy. —DZ |
The best of them JL 2
The best of them …Last couple of years, I subscribed to several ‘market traders’. You are by far the best of them and the personal contact is awesome. Daily and daily updates are very well written! Besides your expertise in EW, I also like your cycles analysis. Best investment I ever made! —JL |
US Market Snapshot (based on end-of-week wave structure)
This chart is posted to provide a prediction of future market direction. DO NOT trade based upon the information presented here (certainly NOT from a daily chart).
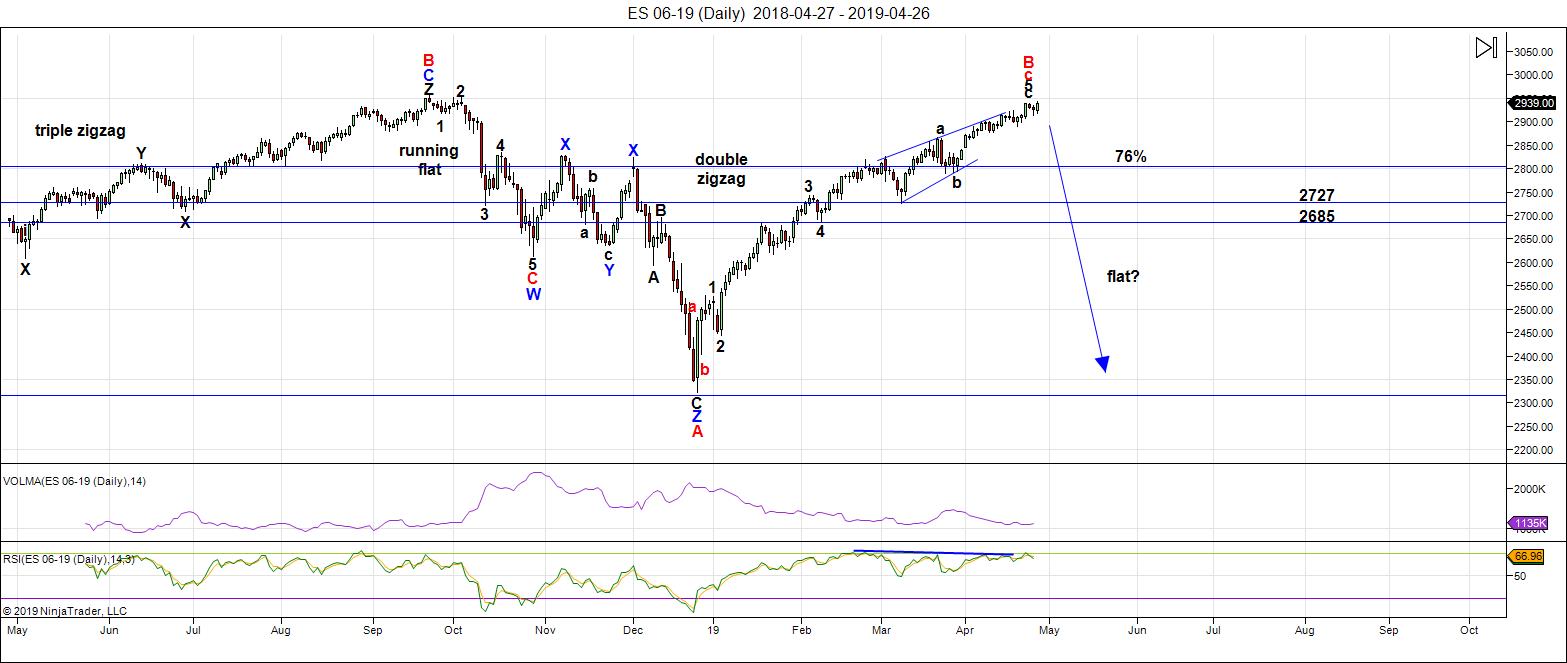
Above is the daily chart of ES (click to enlarge, as with any of my charts).
We've been sitting at the top now for about three weeks. As my Trader's Gold folks know, we've been in an expanding triangle for two weeks (this is an ending pattern).
ES has risen to well above the 76% level of the height of the previous set of waves down from the all-time high at October 3, 2018. Almost all the other assets I cover on a daily basis are hovering near inflection points.
As I've been saying over and over like a broken record, all major asset classes are moving as one. That requires them all to reach new B wave highs before they can turn down together. It's been like herding cats and has taken much longer than expected.
IWM (Russell 2000) still needs new interim highs before everything heads down in a dramatic capitulation — we're now about a dollar away from that top.
All these indices are showing signs of exhaustion, with gaps that are being left unfilled.
The next major move is to the downside.
The wave up from Dec. 26 is clearly corrective and, as a result, must fully retrace to the downside. This is supported by the US Dollar Index, the major USD currency pairs, WTI Oil, along with DAX, TSX, and other international exchanges.
Summary: My preference is for a dramatic drop in a C wave to a new low that should when all these asset classes I've identified have reached their targets. The culmination of this drop should mark the bottom of this large fourth wave in progress since January 29, 2018 - over a full year of Hell. It may be a dramatic drop that lasts multiple months, and will target the previous fourth wave area somewhere under 2100.
Once we've completed the fourth wave down, we'll have a long climb to a final new high in a fifth wave.
___________________________
Trader's Gold Subscribers get a comprehensive view of the market, including hourly (and even smaller timeframes, when appropriate) on a daily basis. They also receive updates through the comments area. I provide only the daily timeframe for the free blog, as a "snapshot" of where the market currently trades and the next move on a weekly basis.
______________________________________
Sign up for: The Chart Show
Next Date: Wednesday, May 8 at 5:00 pm EST (US market time)

The Chart Show is a one hour webinar in which Peter Temple provides the Elliott Wave analysis in real time for the US market, gold, silver, oil, major USD currency pairs, and more. You won't find a more accurate or comprehensive market prediction anywhere for this price.
Get caught up on the market from an Elliott Wave perspective. There’ll be a Q&A session during and at the end of the webinar and the possibility (depending on time) of taking requests.
For more information and to sign up, click here.
| "I think you are the only Elliot Wave technician on the planet who knows what he's doing.” |
| m.d. (professional trader) |
All registrants will receive the video playback of the webinar, so even if you miss it, you’ll be sent the full video replay within about an hour of its conclusion.


I have noticed over the years that others have noticed
The square root of .618 show up in timing . Most of these
Insights were noted after the fact .
Here is something I’m just going to post .
Not going in detail .
38.2 * 38.2 = 1459.24. …divide by 365 and you get 3.9979
Could the 4 year cycle be the square root of a fib 38.2 ?
88.6*88.6= 7849.96. Divide by 365 and you get 21.5067 years
78.6*78.6 ends up as 16.9259 years running it the same as above .
16.9259*2 =33.85 years
I’m finding this becoming interesting enough to dig into further this year
with actual market data .
Martin Armstrong used pi 3141 days And the square root being 56
8.6 years was 3141 divided by 365 .
Note the square root of 3141 is damn near a Fibonacci 55.
Why all of the sudden am I posting Fibonacci thoughts ?
A bit of very short background .
I began Fibonacci trading back in the early 1990’s and I have
Gravitated to other methods . There are moments in history where
Everything comes together and when it does Fibonacci turn dates
Tend to nail the dates .
Adobting an Armstrong idea and blending it with other Fibonacci methods
May just show me something new .
23.6*23.6=556.96 / 365 = 1.5259 . Not a 1.6 but the difference between
1.618 and 1.5259 is only .0921 times 365 = 33.6165 days ( damn near a fib 34
And damn near a 33.618 difference )
🙂
I know of no one who has thought of this
Joe,
So is it fair to say that your above post describes your search for more precise turning points? Thanks for your input.
Joe,
Should have added that your comment that “there are moments in history where everything comes together.” Perhaps your idea seeks to confirm Peter T’s belief that everything is approaching a significant turn!
Good luck! I hope you decide to share your thoughts right here!
Hi Verne,
No offense but I think you misunderstood. I requested Tom to “please share when your tools detect an inversion, only if time permits.” That means I hope he can post an inversion alert only when he has time to do so. No idea what made you think i asked to disclose his trading methodology 🙂
Got it! I stand corrected! 🙂
Exhaustion gap?
We know how they like to negate these signals but VIX is complicating that game plan. Let’s see how she rolls….
All the signs are pointing to a reversal – but we have seen quite a few of these negated over the last 2 months. Very similar to the last 2 tops. Lets see if we can break any trendlines. From a trading perspective, I have been selling at top of channels and covering half at bottom. Will increase the short on break of support trendlines.
We have the FED coming up – they are capable of causing one final push above the trendline. If that happens, I would expect it to be brief.
Yep. The jaw-boning has been remarkably effective.
China! China! China! Lol!
The blather about the possible trade deal does seem to be loosing its efficacy. FED standing pat on rates is 100% priced in.
It is not beyond the realm of possibility in that they would respond to the obvious market weakness with announcement of a rate CUT!
These guys know that this is a death match and they cannot afford to loose control of this market. We have all suspected that they are going to reserve “announcement” of a resumption of Q.E. for a potential fourth wave bottom but my own view is that they have already started down that road so not sure how lasting an effect any jaw-boning on the subject will now achieve. We are going to see some action the next 48 hours one way or the other. Looking forward to Peter’s take at the Chart Show today.
I have a massive long vol position but I structured the trade to be virtually immune to any time decay issues as I had no idea how long they would keep things propped up I do know that a big volatility pop is coming, bankster attempts to prevent it notwithstanding.
Price action today very weak. They are going to have to find some kind of catalyst to spike price higher beyond resistance. What, pray tell will it be? 🙂
Appreciate your comments Verne. VOL trading instruments stronger than VIX through comments and particularly now. It will be interesting to see this play out. I’m leaning a bit hard on VOL also… NDX VOL is turning positive again …
😀
A trend change ( lower low) will be confirmed with a take-out of 2926…
RUT back to under-perform again, SRTY resuming
Any move and CLOSE of VIX above 14.00 will put the question firmly to the massive short vol cohort…
Put your sunglasses on, we will see what Peter T has to say. Cheers!
Outside reversal day on deck? 🙂
Suppose there is still time for the PPT 😉
Lol!
They HAVE been busy as little beavers!
Looks like a lot of us are looking at 2926 and 2890-2910 area. I will add to shorts below 2926 and then buy puts below 2890. I am busy during Peter’s Chart Show hours. Will have to stay awake an extra hour tonight to watch it later
😎
Wedges blowing up…!
They generally all do! 🙂
Would have enjoyed a more impulsive drop (size-wise) in the majors, but looks to continue after hours. I think this gets real over the next couple quarters, but decisions to trim and add positions will mean a lot to equity curve. Blow! Wedge Blow!! 🙂
Some weekly engulfing across the indices would be nice. But expect chop through Friday until a confirmed candle.
They unwound the leverage of the last ramp. They have yet to exit the levered spike past 2900.
Let’s see if that comes by way of ES.
Any pause there not a good sign for the immediate bearish outlook.
We know how the banksters roll! 😉
YAY!!!!
https://twitter.com/Hedgeye/status/1123597858039574535
about volatility…
Great, short video on change of volatility and Hedgeye process
Ed
The short answer is yes
The long answer is a bit to long winded .
As Martin Armstrong says ” everything is connected ”
As Peter T has mentioned ( he mentions Robert prechter )
It’s all the same market . Everything is moving in tandem .
Verne
I have no real statement to make with RIOT
But I’d like to just state an observation on it .
Whether this shows up in other stocks or index’s
I don’t know .
RIOT moved from 1.29 to 4.24 which was 2.28 times move
1.29*2.28 being 2.94 and change point move which peaked
At 4.24 in about 9 weeks .
Then a drop for 2 weeks to the 2.85 low .
Taking that 2.28 ( 228% ) move and calling it an A wave
Or an initial move ( no opinion from me on wave count )
2.28 times 50% = 1.14
The 2.85 price low times 1.14 ( a 50% price percent move of A
In this example ) equals 3.249
2.85 + 3.249 = 6.0990 ( call it 6.09-6.10 )
The print high was about an 8 week move .
The print high being 6.14
Essentially wave C was 50% of wave A in terms of %
And in terms of time Wave C was almost equal to A
The entire move lasting 18 weeks .
A low to high of 9 weeks in A plus 9 weeks
Is known as a low to high to high count .
No opinions here just found it interesting .
Joe
ENERGY CHART UPDATE
https://imgshare.io/image/may-1st-evening-energy-chart-update.N3WYY
Thank you Tom. I wanted to go short right after the Fed announcement but couldn’t pull the trigger. This vicious bull market has conditioned me as such 🙁
No pressure on you, but I am excited to see what happens on 5/6. Some natural born traders have some mysterious ability to sense upcoming sharp moves. Back pain for Soros, dream in your case, etc.
Thanks Tom, So you are expecting good decline tomorrow. How about next week
Peter G,
Do you have any thoughts that you can share with us?
Subtle change in VIX decline. We now have flagging price action. I think the massive short vol cohort is about to get torched….again!!
What IS the matter with these people??!!! 😁😁😁
Thanks for the show! and Tom I am feeling your prediction I am attaching an IWM chart that I think is pretty interesting to see the crazy wedge we are in
http://schrts.co/JUpIIPCC
Very few folk are expecting a decline of any significance.
They are ALREADY crowing about getting ready to BTFD…!!!! He!he! 😬
http://schrts.co/spxAGKFk also silver chart from 1983 which i think is interesting as well..
have a great day!
I am! 🙂 🙂 🙂
Last words promise 🙂 so nice to see the drop in oil today…go oil…!
last last words..uso at lower trend line..lets see if breaks it
Looks to me like that’s a fiver folk!
VIX hanging tough.
YABA-DABA-DOO! 🙂
A VIX close above 15 means a whole world of hurt for the short vol cohort.
Will it be a Samuel Clemens type blow-up, slowly at first, and then all at once?! 🙂
Verne,
Don’t you mean Ernest Hemingway???
Hemingway did indeed use the phrase, Jack.
There is some debate over whether Twain of F. Scott Fitzgetald first coined it! The former was well-known for his lavish spending so I suspect he was the author! 😊
The bulls are trying to defend 2900. I was keeping some powder dry for selling on New moon….but will be forced into selling the last piece earlier in case we break below 2890. Crude has cleanly broken the wedge. This is the level bulls have to defend to make it look like a 3 wave decline over there.
I STILL wanna see a 2900 decisive break. These banksters are tricksy.
In my humble opinon, this dive not withstanding, above 2900 those slicksters remain leveraged. We are not entirely safe until the are FORCED to unwind…
I have a feeling the banksters are going to remain leveraged until we tag the next roun number at 3000.00
2900 holding, the banksters are still lurking..he!he! 🙂
Taking some juicy profits off the table. The banksters are not quite ready to exit.
Backing up the 18 wheeler for the next bounce.
They are VERY tricksy! 🙂
Trading plan is to deploy a massive SPY bull put one point spread at 289/290 with a hard stop on any close BELOW SPX 2900. Here is hoping we don’t get a monster gap down past it. These banksters are VERY tricksy! haha! 🙂
Took some VOL off after hours near high last night, another chunk around noon. Wishing right now I’d taken off more with their push below VIX 15, but I like a double scoop of VOL into May/June and maybe July when Q2 earning come out… watching for rate of change surprises. Will be trading around the position and adding sector exposure long/short on divergence.
Appointments messing up trading, but @2:30 put on more VOL TVIX @20.96. Feels good now, but need a deep, dark candle on close to see unwinding. 2-edged sword to see VOL get volatile again HaHa!
This clip from CNBC Fast Money show today, you have to listen closely after the 3:00 min mark, but he is also is calling the 2100 level before going to new highs, echoing Peter T’s excellent analysis. Perhaps he got those target levels here ? https://www.cnbc.com/video/2019/05/02/technician-says-these-stocks-are-your-best-bets-out-of-earnings.html
bpower944,
lol … THAT I doubt, but thanks, anyway.
ENERGY CHART UPDATE
https://imgshare.io/image/may-2nd-evening-energy-chart-update.NEMNy
Hi P.
I know you’re excited about Monday
here is my call for Monday May the 6th;
assuming the crooks don’t invert it, this is hopefully how it should play out
all the best!
https://imgshare.io/image/may-6th-monday-2019-supplemental.NEXon
Awesome! 🙂
Thank you!
I think this is looking pretty good, Tom.
Hi Peter
If you think Monday looks good! feast your eyes on the 13th of May
I can’t imagine the FED or Trump (thru his advisers) not countering
with some kind of Trillion dollar Mega infrastructure project
announcement. We’ve seen the set-up to this story this week with Pelosi and Schumer. The China story is losing traction so a new story is being cooked up in order to prop up markets when the time is right. (Just ignore the man behind the curtains).
https://ibb.co/NV5LsbB
Thank you Tom…!!
Hehe!
Thank you, BTF Dippers! 😀😀😀
It is truly incredible what you can do with timely executed credit spreads!
It is the only trading approach I know that gives you a distinct advantage over the market makers, and which actually PAYS you to execute your trade. Never quite understood why so few traders do not have it in their arsenal…😉
BTW Peter, as soon as they get “The Bitter End” repaired from the hurricane carnage the next excursion is on me! 😊
A green VIX print prior to the close grants permission to take a few banksters out back and administer a severe spanking…”Naughty!!” 😁😁😁
My, the Qs are frisky!
Exactly WHERE, do they think they are going?! Hyuk! 😁
Triple Q 192 puts expiring next Friday are a steal at 1.99!
Made cheaper by more VIX suppression today…
The short vol cohort is really dumb! 😁
The sharp move up in Triple Q clearly designed to stop out traders entering short on the sell signal from the busted wedge.
I was kinda expecting the rascals to do just that…😜
On moves such as we are expecting, you can start with a little and end up with a lot if you are a skilled options trader. The secret is rolling gains into new contracts with the highest delta on the way down. If you do it successfully three or four times….well, you can do the math. Doing it with spread proceeds means you do it with zero risk!
Now, those are my kinda trades! 😎
Have a wonderful (and profitable!) week-end everyone!
I’m becoming to think we have a lot of nervous bulls in this market .
Call them cautiously optimistic yet also scared and obviously nervous .
Not trying to sell my own bias here just noting a few things .
BA has had only 3 down weekly bars in 10 weeks . The stock looks dead .
if it turns down we could get a mini panic .
INTC took a steep dive ( not talking about today )
The past 2 days hit took place with CTSH .
I’m sure there are others .
We can assume stops being triggered at very unfavorable prices .
A stop at say 61.30 on a stock that opens at 61 or 59 can just
Kill a stock in no time flat .
I do not believe in using stops for that reason .
As my dad used to tell me
Be careful what you wish for, it may just come true .
Sticking to my plan for the month of may .
This past week an ok week for the most part .
Today a pretty good day overall .
The internals though as I peak under the hood not
Looking so great .
Itchy trigger fingers may bring better buying opurtunities
Near the end of may
25412 still seems a reasonable downside objective with lower targets
If that level gets taken out .
Enjoy the weekend !
I’ll plan on using the cash Dow at or near 26448.89
As key resistance .Friday’s close at 26504 is above that level .
Next higher level is 27216 but I’m doubting it .
So 26585.62 needs to hold then a drop back below 26448.89
And that 26448.89 should be taken out with an acceleration move
Down or I’d say something is wrong .
Clear A B C down in place ( A ) with now being ( B ) the high .
might end up being a Sunday futures trade in the overnight market
If this market is going to gap down Monday .
For me this is a hedging stradegy only at this point .
All I have to say .
Enjoy the weekend
A new weekend blog post is live at: https://worldcyclesinstitute.com/the-last-waltz/
This website is for educational purposes relating to Elliott Wave, natural cycles, and the Quantum Revolution (Great Awakening). I welcome questions or comments about any of these subjects. Due to a heavy schedule, I may not have the time to answer questions that relate to my area of expertise.
I reserve the right to remove any comment that is deemed negative, is unhelpful, or off-topic. Such comments may be removed.
Want to comment? You need to be logged in to comment. You can register here.