

Good — Until It’s Not
Hope on steroids, otherwise known as “Hopium” is the “placebo” of the 21st century. You’re going to see it play out as never before with the final wave up in the US indices.
Hopium creates “false” euphoria, a sense of hope that’s got little in fact to support it. The herd is on this drug “big time” right now. They’ve been influenced by the government telling them everything’s ok. Pop culture and entertainment virtually rule the marketplace. There is very little “real” news anymore. The government of the day did the same thing just after the height of the Roman Empire—placated the populace with spectacular events in the amphitheatre. The same pattern happens over and over again throughout history.
Euphoria and a positive outlook is still being exhibited by the majority, but it’s rapidly declining. There’s a sense now of the 11th hour of a party, but the truth is, the let-down at the end is going to be a rough ride—a really rough ride!
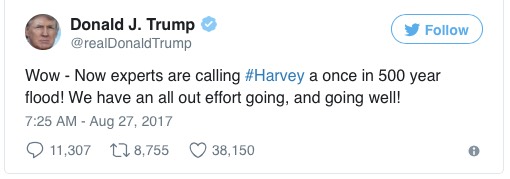
As I’ve written many times before, we’re at the top of a 500 year climate cycle, which is also the top of a financial cycle: The two cycles coincide. Even Donald Trump tweeted about it.
The United States is getting beaten up badly and soon, the social mood will turn distinctly negative, even though central banks (including the Federal Reserve) and the government have tried their very best to keep everyone on “Hopium”—a “virtual opioid” that has artificially elevated everyone’s hopes for a brighter future, in the belief that the economy is in far better shape than it actually is. In fact, the situation is very much worse than at any time during “the Great Recession” (2007-9).
When the climate turns colder (as it’s gradually doing), social mood will dip to the downside, deflation will become stronger (the US dollar will turn up, or increase in value), and the stock market will begin its descent. This “turn” should happen very soon, as the Elliott Wave Principle tells us we’re in the very last pattern before an historic crash that will leave our international financial system in shambles.
Historically, when the currency of a country has been devalued to the point of being worthless, when climate turning colder affects the food supply and health (pandemics thrive in cold climates), when population is declining (as it starting to do in many western countries), economies decline and deflation takes over. A major financial collapse has happened at the top of each and every 172 and 516 year cycle since recorded history.
Events and Climate Change
We’ve had many traits play out of a major cycle top. The climate is turning colder, but it’s always preceded by extreme weather. It tends to happen most often in the western hemisphere, below the 48t parallel, because that’s the segment of the Earth that’s closest to the Sun most of the time. The Sun (and the planets), contrary to popular belief are what causes the changes in our client. We humans are really far down on the list of influences.
Truth is starting to win out, as it always does at these cycle tops. You’re seeing the intrigue and corruption come out in alternative news reports. It’s been going on for decades, but it always surfaces as climate turns colder and our energy increases. You’re going to see a lot more nefarious characters behind bars before it’s all over.
Many of these events have been expected, even predicted. That’s because the era we’re living through is a repeat of the 16th century.
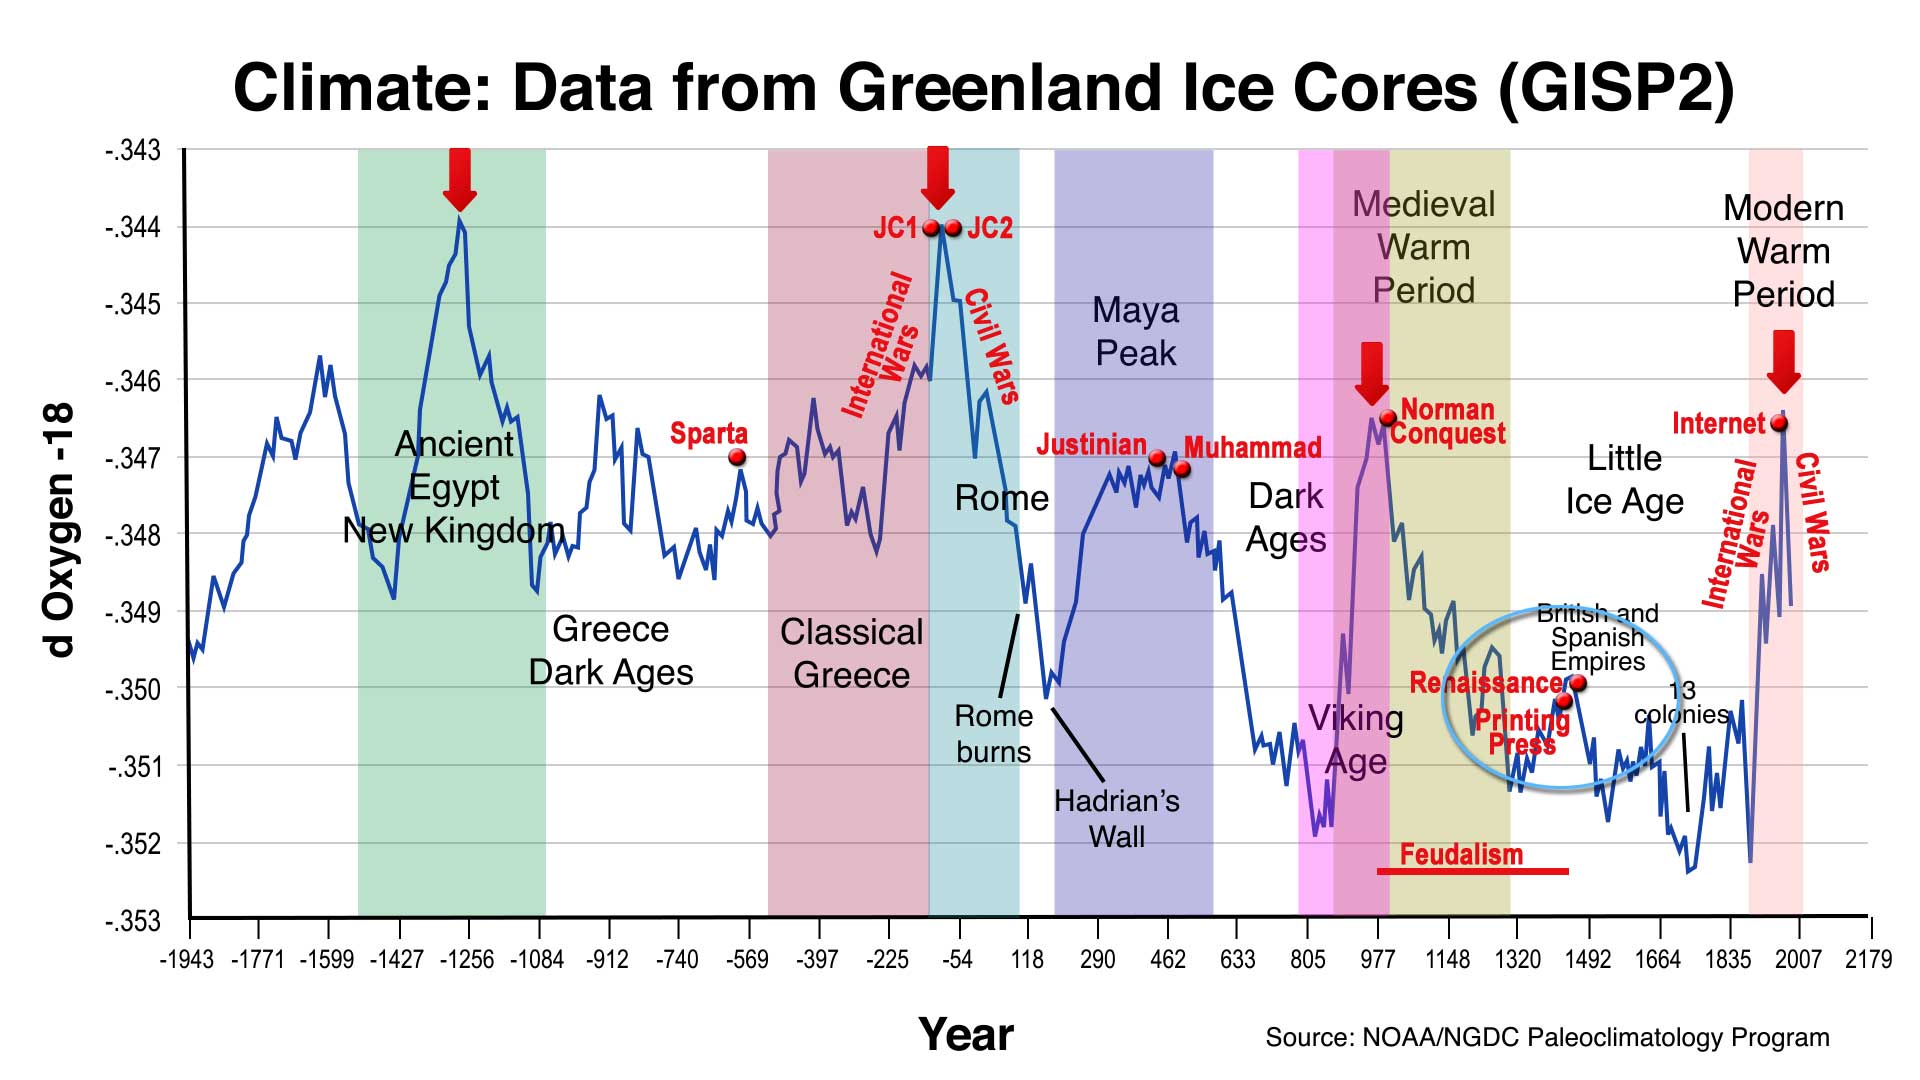
The data above comes from the National Oceanographic and Atmospheric Administration—from the Greenland Ice Core Research project ending in 1992. Ice cores are an extremely accurate method of determining temperature back through the centuries. This data is undisputed by the scientific community, but has been suppressed by the UN-associated, man-made warming advocates. It also reinforces the findings of Dr. Raymond Wheeler in his research over fifty years earlier of tree ring data, weather records, military records, locust plagues, historical chronicles, sunspot records, etc.
What the above chart shows is the temperature cycles over the past 4,000 years. Each time there’s a temperature peak, a major civilization also peaks and then goes into contraction. This has happened over and over again throughout recorded history. The red arrows pointing down mark the 500 year cycle tops.
Certain world events take place at predictable points along this 1030 year cycle peak spectrum. “JC1” refers to Julius Caesar, “JC2” to Jesus Christ and the start of Christianity. Note that the Islamic religion also began at a climate peak, around A.D. 600 (Muhammad).
_______________________
Harmonics: Discrepancies in 500 Year Cycle Tops
 Dr. Raymond H. Wheeler, who spent much of his life researching cycles and events from 600 BC through to 1950, identified the top of a major 516 year cycle at sometime shortly after the year 2000. Stephen Puetz, a mathematician, statistician, and financial expert, living in Hawaii did extensive statistical analysis on cycles data that he acquired over a number of years, dating back to pre-historic times. He pegs the previous 500 cycle at 1663, while Wheeler may have selected 1492 as the date (one 172 harmonic cycle earlier).
It doesn’t matter in respect to the story I’ll relate here, as each 172 year cycle marks a financial collapse.
In 1491, the Italian city of Florence was at the height of its power. It was ruled by the Medici family, and the government headed up by their young leader, Lorenzo il Magnifico. Money flowed into its coffers at such a rate that three days before the Feast of St. John, the commune announced that citizens would be allowed to pay their public obligations at only a fraction of the usual rate.
On the fifth of April, in the year 1492, the sky suddenly turn black above the city. A brilliant bolt of lightning streaked down from the heavens and struck Brunelleschi’s soaring duomo with a mighty crash. A sinister friar named Girolamo Savanarola emerged from his cell at the convent of San Marco with this warning: “Tell Lorenzo to do penance for his sins for God will punish him.” The friar prophesied the death of il Magnifico, along with great suffering for the city of Florence.
Within months, both prophecies came true. After Lorenzo’s death, the peace and prosperity of Florence collapsed. By 1530, the proud Republic of Florence had become a dark and wretched den of despotism, which called itself the Grand Duchy of Tuscany.
Such is the power of 172 and 516 year cycle tops.
_________________________
Elliott Wave Basics
There are two types of Elliott wave patterns:
- Motive (or impulsive waves) which are “trend” waves.
- Corrective waves, which are “counter trend” waves.
Motive waves contain five distinct waves that move the market forward in a trend. Counter trend waves are in 3 waves and simply correct the trend.
All these patterns move at what we call multiple degrees of trend (in other words, the market is fractal, meaning there are smaller series of waves that move in the same patterns within the larger patterns). The keys to analyzing Elliott waves is being able to recognize the patterns and the “degree” of trend (or countertrend) that you’re working within.
Impulsive (motive) waves move in very distinct and reliable patterns of five waves. Subwaves of motive waves measure out to specific lengths (fibonacci ratios) very accurately. Motive waves are the easiest waves to trade. You find them in a trending market.
Waves 1, 3, and 5 of a motive wave pattern each contain 5 impulsive subwaves. Waves 2 and 4 are countertrend waves and move in 3 waves.
Countertrend waves move in 3 waves and always retrace to their start eventually. Counrtertrend (corrective waves) are typically in patterns — for example, a triangle, flat, or zigzag. Waves within those patterns can be difficult to predict, but the patterns themselves are very predictable.
Fibonacci ratios run all through the market. They determine the lengths of waves and provide entry and exit points. These measurements are really accurate in trending markets, but more difficult to identify in corrective markets (we’ve been in a corrective market in all the asset classes I cover since 2009).
To use Elliott wave analysis accurately, you must be able to recognize the difference between a trend wave (motive) and a countertrend wave (corrective). There’s very much more to proper Elliott wave analysis, but this gives you the basics.
____________________________
Registration for Commenting
Want to comment? You need to be logged in to comment. You can register here.
If you register, it protects your information. It also allows you to comment without filling in your information each time. Once you’re registered, simply go to the home page and click on the login link top right in order to log yourself in. Usually, you’ll be logged in for several days before needing to be logged in again.
______________________________
Problem receiving blog comment emails? Try whitelisting the address. More info.
______________________________
Rise above the rest … SM 2
Rise above the rest …I have only ever met a few people who, in their chosen fields (astrology, medicine, music, martial arts, technical analysis), rise above all the rest and you are one of them…you have ‘the gift’…and that’s why I’m a Trader’s Gold member. —SM |
the real deal SM 2
The real deal …‘Educational, insightful and thorough market analysis for all levels of traders. It’s Elliott Wave at its best….Peter Temple is the real deal’ —SM |
Get an upper hand … JC 2
Get an upper hand in trading …Seeing all the different currency pairs and the wave structures and hearing you explain why this has to do that on a nightly bases gives one a upper hand when trading. Elliott Wave applies to all stock and indices and can be applied to any candlestick chart. If someone ask what you want for Christmas – Tell them a membership to Peter’s “Traders Gold!”—JC |
The best of them JL 2
The best of them …Last couple of years, I subscribed to several ‘market traders’. You are by far the best of them and the personal contact is awesome. Daily and daily updates are very well written! Besides your expertise in EW, I also like your cycles analysis. Best investment I ever made! —JL |
Have not had a losing week RW 2
Have not had a losing week …I have been with Peter almost a year. The only thing that matters is have I made money with his service. I think I have finally turned the corner using Peter’s EW. I have not had a losing week in the last 5 months. Thanks Peter, for your amazing amount of hard work. —RW |
A true expert in Elliott Wave FL 2
A true expert in Elliott Wave …You are a true expert in EW analysis. What you provide is not available anywhere and is priceless. Subscription on your services is the best thing I have ever done. Many thanks for your effort to make me a better investor. I now have more trust in my investment decisions. I hope you will continue the excellent work! —FL |
Couldn’t be happier … KK 2
Couldn’t be happier …The analysis and insight you provide is simply amazing! I’ve been trading the futures and equity markets for well over thirty years and usually average around 5% monthly. Since joining your Traders Gold Service two months ago, that number has better than doubled. I couldn’t be happier.—KK |
Tops in your field DZ 2
Tops in your field …You are tops in your field. Tried to follow Elliot Wave international for years. They were always behind the market. After discovering you, I perceive that you are an expert in reading the waves, which puts you way ahead of the rest of your peers. And you can read the Waves like you are reading tomorrow’s financial section. I pray you stay healthy. —DZ |
The Market This Week
Here's the latest daily chart of ES (emini futures)
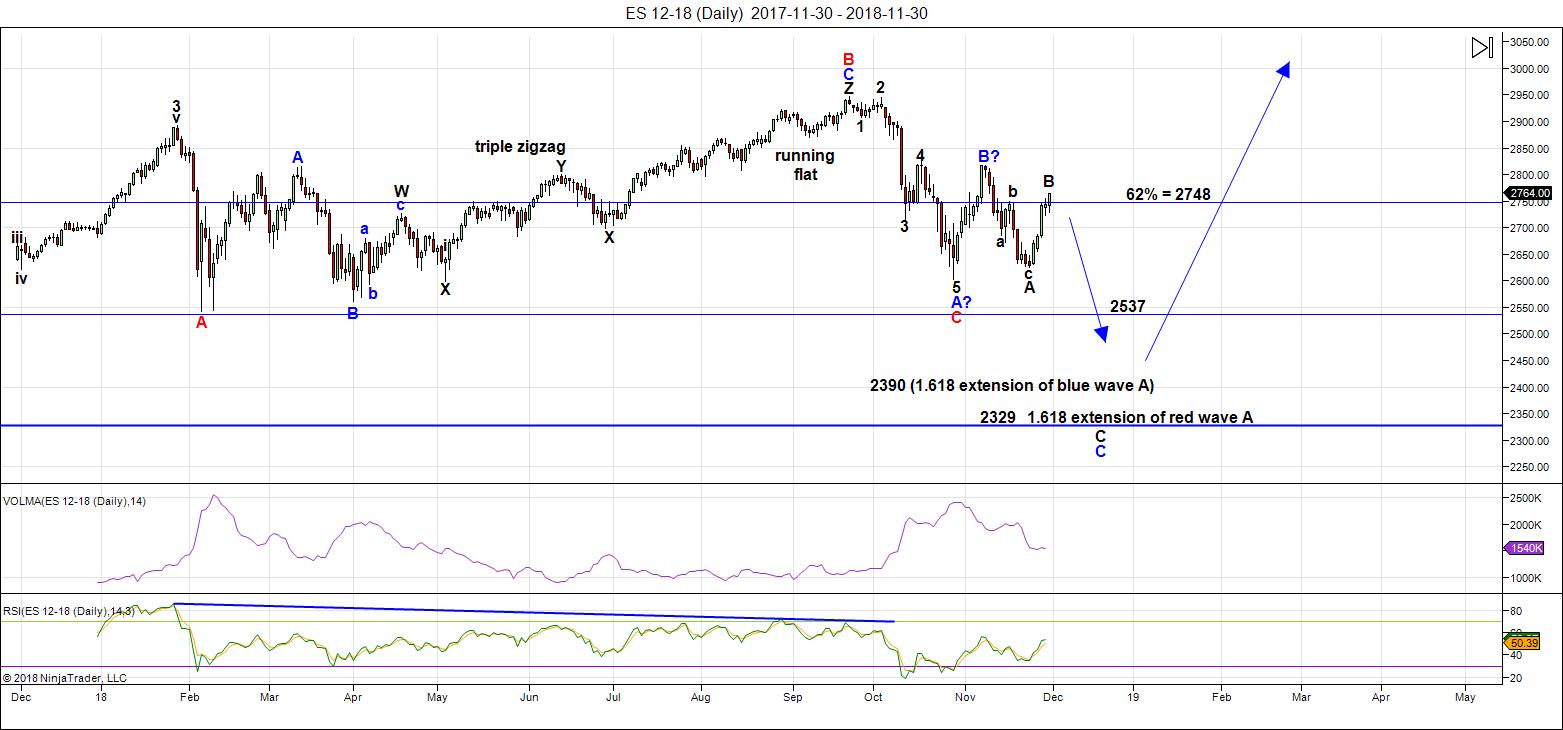
Above is the daily chart of ES (click to enlarge, as with any of my charts).
Last weekend, I called for a rally, asking if we're done with "dead cat bounces," like the ones we had during and leading up to the US Thanksgiving weekend. We ended up by the end of the week with a cat on a hot tin roof!
First is was an event — a dovish speech by Chairman of the Fed Powell. Next, it was another event (of sorts) — the promise of something to come from the G20 meeting that would change the world. Somebody's opened that bottle of Hopium again, but the short-term effect is about to wear off.
Events don't have a lasting effect on the market. But, they're sure fun to fade.
We ended up with a strong rally just about the 62% retrace level. In ES, the wave is corrective, but it could be considered only a A wave. What I mean by that is that it's not "obviously" three waves and and that's what I'd prefer to see. So, we may end up with a drop in a B wave and then another C wave rally up to our "developing" high.
My use of the word "developing" means that we could have a few more points to go to put in our high, but I would expect the upside now to be very limited. However, getting the turn in place may take as much as a couple of days more. I'd like to see a more traditional and obvious ABC structure up.
When you have a corrective rally to this height, in my experience you can expect a snap back of larger proportions. So, my longer-term projections are intact.
We're going to a new low below the February low (wave A of the fourth wave) at about 2535.
Combination waves can have up to three patterns within them. This pattern we're in is the second one (after the running flat). One zigzag if often followed by another. But, we could also see either a triangle or ending diagonal form (although, I see these are much lower probability).
In fact, with the current wave structure, we could even see an expanded flat play out in the SP500/ES. That's because the waves to the downside ending last weekend, traced out an additional wave, which arguably make the last wave pattern down corrective. That would result in a large five wave pattern down to a new low. In other words, there are lots of options.
Summary: We're looking for a turn to the downside, but we may first get a B wave down and a C wave back up to finish off the structure. The waves up are corrective, but visually, my view is that they don't look corrective enough. Once a top is in place, expect a new low below the February low.
Once this c wave (down) has bottomed, expect a final fifth wave to a new high. That fifth wave up to a new high will be the end of the 500 year bull market.
___________________________
Trader's Gold Subscribers get a comprehensive view of the market, including hourly (and even smaller timeframes, when appropriate) on a daily basis. They also receive updates through the comments area. I provide only the daily timeframe for the free blog, as a "snapshot" of where the market currently trades and the next move on a weekly basis.
______________________________________
Sign up for: The Chart Show
Next Date: Wednesday, December 12 at 5:00 pm EST (US market time)

The Chart Show is a one hour webinar in which Peter Temple provides the Elliott Wave analysis in real time for the US market, gold, silver, oil, major USD currency pairs, and more. You won't find a more accurate or comprehensive market prediction anywhere for this price.
Get caught up on the market from an Elliott Wave perspective. You’ll also get Andy Pancholi cycle turn dates for the SP500 for the balance of the current month. There’ll be a Q&A session during and at the end of the webinar and the possibility (depending on time) of taking requests.
| "I think you are the only Elliot Wave technician on the planet who knows what he's doing.” |
| m.d. (professional trader) |
All registrants will receive the video playback of the webinar, so even if you miss it, you’ll be sent the full video replay within about an hour of its conclusion.


Hi Peter,
“deflation will become stronger (the US dollar will turn up, or increase in value)”
The “or” makes that statement technically correct.
But the dollar turning up does NOT necessarily mean a dollar increases in value (outside of the foreign exchange market).
The dollar is a pairwise exchange rate so it can appreciate (against other currencies) while still losing purchasing power (when used to buy real goods and services).
So if the dollar turns up, its absolute value (purchasing power) could still be going down if its being loaned into existence less rapidly than its peers. Its appreciation relative to other fiat, simply means its purchasing power is declining less swiftly than the others. (Its one race for all fiat to zero.)
So instead, perhaps something like …
“deflation will become stronger (the US dollar will turn up, and may even increase in actual purchasing power)
You get the idea … just a fine point, but one that if not finessed carefully may throw some off course.
Another way to see this, is to recognize that any central bank can “inflate” its currency and via the free movement of capital, can cause global prices to rise. So dollar deflation (credit contraction) can still be offset by inflation out of PBOC, BOJ or ECB etc. Which is what we’ve had since Fed QE ended. US consumer prices are still rising even though the dollar has rallied against these other currencies. The US not a monetary island.
Thx
Pieter
First of all, you’re confusing the US dollar with the dollar index. I’m not referring to the index. I’m referring to the dollar. They’re entirely different. In deflation, credit dries up because there are fewer dollars in circulation. As a result, assets decrease in price.
I wouldn’t change anything I wrote. Sure, call it purchasing power, if you want, but it’s the same thing. Greater value in a currency creates greater purchasing power. My book goes into it in deeper detail.
Most folk do not understand the profound significance of the fact the the lion’s share of global debt is dollar-denominated, and how debt default, which will be the largest in history, will be the equivalent of dollar destruction. When you have a scarcity of something, it value generally increases.
“First of all, you’re confusing the US dollar with the dollar index.”
Actually, I thought I was clearly distinguishing the two as that was the gist of my remarks.
“In deflation, credit dries up because there are fewer dollars in circulation. ”
And as a global monetarist, I believe you won’t see DEFLATION (capital D) until GLOBAL money supply (or global credit) contract. (Not merely fewer dollars.) Meaning, fewer dollars (eg, as a result of QT) won’t necessarily beget Deflation. That’s because dollars, yuan, yen and euros all spend the same and we have largely the free international flow of capital. So the Fed can contract M2 or M3 but if other central banks are still ‘inflating’, then declines in the dollar money supply may be offset by monetary inflation elsewhere, and can still lead to lower purchasing power for holders of EVERY currency. In effect, we are in a world where the fiat money supply is a public good, and its like the tragedy of the commons, where there’s a rush to be the first to print to take command of real resources. Bottom line, contracting supply of one currency — even the dollar — isn’t sufficient to ensure outright Deflation. Granted, QT by the Fed is the most likely path to global deflation. But Chinese credit growth (and by BOJ and ECB) has swamped Fed tightening to date. The rally in the dollar index reflects the policy divergences here. And Fed tightening doesn’t preclude further declines even in dollar purchasing power as foreign capital drives up local prices. (fyi … PhD in open economy macro here)
Peter t
You post today caused me a thought .
I might be off since I counted the bars on your chart
Using my smart phone .
The 5 waves down from the Oct high to job low being 26
bars . You label the bottom with the blue A ? Then I counted
Forward again thinking maybe these would be 2 equal moves .
That’s is the leg down being 26 bars and the leg up or sideways
From that wave 5 low being 26 bars .
If so then last Friday was bar 24 and Tuesday would be bar 26 .
It’s to soon to call then entire move from the late Oct lows a clean
A B C move from the Oct lows yet a poke above the Nov 7-8 high
Would make a solid case that’s what were seeing .
I’d consider a fake out break out with a poke above your wave 4
As well as a poke above the early Nov high to be followed by heavy selling.
If so wave A being 26 bars and wave B being 26 bars .
I won’t call the C wave 26 bars yet if so we would end up with a very
uniform sell off. Price time etc….
Not saying it’s going to happen just saying …..
Thank you
Your work with dr wheeler and tying all the pieces together
Is excellent
Thanks again
Joe
Peter t
Have you gotten your book printed yet ?
I know you have been working on it for a long time
When do you think it will be available and when it is
Will you post a link for ordering ?
Thanks again
Joe
This market in the past year has been so difficult that I’ve had to put it temporarily on hold. My analysis has eaten up a lot of my time. I have three books I’m working on. One is on deflation and how to profit from it, I’m likely going to do a book on Elliott Wave, and then there’s the bigger one on cycles, tying together all the work of Wheeler, luminaries from the same period and earlier, and the basic principles of EW and fibonacci, which support the notion of cycles. I’m hoping to get the first one finished up over Xmas. EW is next and then the one on cycles. That last one is going to take me quite a while to finish up — at least a couple years, I think.
https://www.eurekalert.org/pub_releases/2018-11/thni-itf112218.php
Thank you Peter T for your insight. I have started my first options trading account and your wisdom will help it be successful! Thanks again for the work you do and your free blog.
Jeff T
The clowns over at EWI are once again caliing a major top. Lol!
If I had any doubt that the market was going higher, it just got confirmed.
How do these amateurs stay in business?!
I am starting to think EWI has to be a deep state dis-information outfit.
Even a momkey throwing a dart could do better. There were SO MANY reasons to conclude that we
DID NOT have a top on Friday so why would they publish such misinformation and totally mislead their paying subscribers??
It is truly a great mystery what these guys are up to. NOBODY can possibly be this stupid and incompetent. Statistically impossible!
😀
Glad imma long. Es up almost 2%! I dont see a new low in 2018.
This is a higher degree correction than most counts were calling for. I think any point above 2820 we could see reversal. If that proves wrong, the counts seeing a completed P4 would imho be correct.
Imma thinking the 5th wave is here. S&P already tested the lows and now looks like a W bottom recovery. Imma adding to my longs this am with expected rise to 2900 and 3k. Its the Santa rally period too so mostly up until 2019, will revisit the bear thesis in Jan.
I continue to scalp the move up as I am not at all convinced that the move is not corrective.
EWO already showing red today so while we may get a bit of a jaunt higher, I do think this is a terminal wave and no way I am remaining long with this kind of price action. You rarely see this type of manic move higher in a true bull market impulsive wave. It still looks to me like a counter-trend rally. I see distribution taking place on this move up. Just my two pennies!
Two pennies worth paying attention to!
Looks to me like a big ABC unfolding.
Price should move above 2817.75 to get A and C in better proportion before this move up is done.
2 equal moves = 2840-2842 ish spx
Above there it’s the 1.27 then 1.618 x A
A being the Oct low to the Nov high
Dec 3-6 th turn is still valid .
This monster rally was expected !
EWI I have not followed since April 2009
But I can guess their diolog .
This is wave 2 and wave 3 of 3 is next which will be a wonder to behold
The end is nigh .
Something like that. : )
That said, I still would say Robert prechter is a pretty good market timer
Yet he usually ( typically calls the tops of wave 3’s )
Steve hochberg I followed when he began and has never really got it right .
Jim Martin’s was a very good Elliott wave guy there as was Jeffery kennedy
They were both focused on commodities . Jim Martin’s was moved to currencies
The last I heard which was a very long time ago.
There is many different people working there and it’s not just the stock market
They analize .
From what I understand prechter let’s them print their own wave counts .
That’s most likely why they stay in business .
I’m looking to take a lite bearish stance on Wednesday .
Yet it is next week’s market action for me that will matter .
This week is forecasted to be a high of importance and next week must be
Down!
If the market fails to drop next week then I’ll admit something else is going on
And exit my short.
As stated last week I saw a mixed message . Market was not anywhere near oversold
Yet the 5 day advance decline had turned up . The timing though said get long and
Look for a monster rally that should at the least test the early Nov highs and can poke above them.
So far everything has worked out very well from the Nov 7-8 high to the Nov 21-23 n 26 turn.
Next is Dec 3-6 which should be an important high .
If this hold true we are about to enter a strong bearish cycle which does not call for a low
Until Jan 4 ( just this one leg time wise )
Intend to buy a few Jan puts which will be slightly out of the money .
Will hold into year end .
Blame it on the moon if we see a mini crash !
No comments from me until mid Dec .
Good luck everyone .
Clarify a few things
C = A = 2 equal moves
C = sq rt of A = 1.27 Times A
C = 1.618 Times A
That’s the math I’m considering on the above post.
ROTROT
Good stuff in that link : )
Thanks
That post Joe, was by Red Dog.
I think you mistook him for the other guy.
A great link indeed!
Sq root of 1.618 = 1.27
Hi Peter,
I have used the period 21 September till now to make the choice from various (US) analysts. And looking at the opportunities I have not used.
As earlier noticed several analyst I have dropped. It cost me about half of my profit I made with my indicators and partly you’re predictions.
Looking at the opportunities I have not used from you’re predictions:
1) twice I thought that is a small drop, but that was just a big one
2) two times I thought of a big drop and it became a “small” one
3) twice missed out on a big rise
Enough tested and explored!!
I will now sign in to your predictions and use my indicators only to refine – if possible – some of your predictions.
Thanks for all the energy you put into it.
(I do weekly 16 hours to calculate and publish for http://www.prognoseus500.nl/ )
Don’t feel too bad Willem. This is really tough market to analyse and even very experienced analysts don’t always get it exactly right. I was expecting this post Xi-Trump meeting ramp but thought price would move lower first.
I am out of long trades at the open and waiting to see where we go next. I think the risk is now to the downside.
Hi Verne, Everything I did on purpase 🙂
So I have found it with the predictions of Peter.
I my search I made a profit and for the future I think I cover more then 95% of the direction of the movement. So I am Happy and keep you and everyone informed 🙂
My target on this bounce was 2840 as I mentioned here last week. The market has already achieved most of that move. I would prefer if it gets there over the next 2 trading days. This Friday is important as a potential catalyst. Towards the end of business cycles, you get wage inflation and we are likely to see that on Friday. This market can get easily spooked by that. How far we decline remains to be seen. If we turn lower from 2840 area, then it will have all the right looks as an A-B-C. I still have some longs, but will exit those by Dec 5th.
As long as that gap remains open we cannot be sure we are not headed higher.
Starting to look like consolidation ahead of another upside move.
Reading regularly and enjoying, but haven’t posted in a while. I noticed two technical occurrences today. A pretty good timing signal is often given by what is called the VIX Index/Bollinger Band indicator. When the VIX moves BELOW the lower BB then closes back inside the BBs, a short term sell signal is given (because VIX theoretically moves inverse to the market). If you use 2.0 as the typical Standard Deviation on the lower band with an MA of 20 (those are the typical default parameters for Bollinger Bands…20 MA, upper and lower bands at 2.0 standard deviations. But I’m going to ask you to be more flexible. If you use 2.0 for the lower band, there were only 2 occasions this year where the VIX closed below the lower BB, and thus only 2 sell signals all year and neither of them great. Now go to your BB parameters and change the lower BB to 1.4 standard deviations and see the results. I won’t give them all but the last 2 were given on 11-9 and 9-20 ( all-time high close on SPX)… not a bad one on 3-12 this year also. Today the VIX closed below the lower BB 1.4 SD. A close back inside would give at least a short term sell signal for market. One more technical snippet. I do not claim to be a candlestick expert or commentator but there are 2 patterns I look for with candlesticks, engulfing patterns and dojis. A doji occurs when the open and close for an item are the same or very close. Today was a doji on SPX and almost on the DJIA. The DJIA all-time high on 10-3 was a doji day. The prior 5 dojis on SPX were 10-2, 10-17, 11-8, 11-23, 11-29, and today!!! Do with it as you will.
To clarify, the VIX must CLOSE outside the BBs then CLOSE inside to generate the signal. Intra-day prices do not count!
Thanks Perer! I have been looking for a VIX gap higher to signal a possible reversal. Every gap up the last few weeks has been relentlessly sold lower. I have a suspicion that this is going to change if I look for that gap up using your modified BB reversal signal. Great post!
Even though the US market is closed tomorrow (Wednesday), I’m still keeping my schedule and the Chart Show will run at its usual time tomorrow.
Oh, Goody! 🙂
If we get a little 5-waver to the downside on a 1 min chart in ES, that will suggest a bottom is shaping up.
Interim? Seems quick for the wave down.
Also looking like a death cross in the making….
Fourth wave underway.
One more wave down and then I think we bounce….
Wow!
That is one magnificent five wave impulse down!
Glad I was at the Chart Show!
We now know what to expect…
That was on a 5 hour chart. Not as definitive on the daily.
Merry Christmas to me!!!!!
Rung the register at the open.
Hope I did not cash in too early! 😁
Covered 3/4 and will let the rest run .
Awesome move
Mercury turns direct today and New moon coming
Which leaves me questioning the puetz cycle .
Mars Uranus points further down into January so holding
The rest .
No further comments till mid Dec
Under ordinary circumstances, I would consider the long tail today as being reasonably bullish short term. These, however, are not exactly “ordinary” circumstances. We do, after all, have a death cross to contend with, and those take months to develop. I am hard pressed to imagine that such a signal development will be reversed “on a dime” so to speak. I will be watching developments over the next several hours VERY closely. As the pirates used to say:
“Take all you can. Give nothing back!” 🙂
https://worldcyclesinstitute.com/elliott-wave-fake-out-fourths/comment-page-1/#comment-34115
I was looking into this fractal and it was great so far with 2/11/16 = 11/23/18. While I was expecting a pullback, I was eyeing 11/8/18 swing high candle similar to 12/3/18 swing high combined with the bottoming action on 11/23/18 not convincing/firm on the daily charts. So Monday and Tuesday open was indeed a good day to sell longs considering Wednesday markets will be closed.
The death cross Verne mentioned gives me some pause. Tomorrow and Monday’s action is important. A bearish fractal would equate today to be similar to 8/3/2011’s dead cat bounce. As always, draw the 50 sma and 200 sma to see what I’m seeing.
It’s difficult to be too bearish considering it’s December and VXX hit right at/near October highs. However, another potential bearish fractal:
The 10/29, 11/20-23, 12/6 lows on the daily chart is similar to 7/7/15, 7/27/15 and 8/12/15 lows.
Thanks Liz.
I am thinking 2700 is the line in the sand and if the bulls can push past it we should see at the very least a 38%.
We entered the gap area with a pretty strong green candle so 2720 at the very least should be in play. If the bulls fail to close price above the pivot I think the Feb lows would quickly become a destination magnet.
Yes, nicer green candle than Oct. 23 and Nov. 15. Need strong buyers to keep it from suffering the same fate days later.
are you waiting for 2800 to reshort or will short earlier than that.
A big “Thank You!” to sir Peter T who graciously sent me an e-mail after the Chart Show and kept me on the right side of the price action today!
Next BVI voyage on me Peter!
Don’t forget if you attended the Chart Show Peter will answer one market question for you afterwards!
Use that bonus people! 🙂
“C” waves in a down-trend are notorious for their frenzy. We have already seen a number of them the past few weeks
Yesterday’s long tail could be hinting at one just ahead. I think it has the potential to be the morher of all bull traps. They are playing it sneaky with the b wave move down in futures to trap a few gullible bears…Hehe!
I always watch the 10ema and the 600ema on the Weekly SPX..we are getting very close to crossing there too..and Stoch RSI almost in .0..been bouncing in and out…
Awesome weak of trading!
Hope everyone was able to ring the register early and often.
I am out of 95% of my short trades and think we could get a robust bounce next week. Some are calling the move down some kind of “B” wave and are now looking for a ferocious C wave to the upside. McHugh thinks we have started a major third down so we will see. VIX looking a bit ambiguous so we could still see a final puke before a meaningful reversal. Lots of folk still bullish!
Have a great week-end everyone.
Looking forward to Peter T’s update.
Great call Peter G!!
Just think of Peters wave count
Then consider this :
No cooments from me till mid Dec so just posting
And link attached .
Put it all together for a moment and look at the big picture
https://mmacycles.com/index.php?route=blog/article&category_id=1&article_id=228
—–SHORT-TERM GEOCOSMICS AND LONGER-TERM THOUGHTS
The cosmic emphasis upon Jupiter and Neptune last week was a preview of what to expect for most of 2019, when Jupiter will make its waning square to Neptune three times, starting in mid-January.
This is one of the classical bankruptcy signatures in Financial Astrology, a time when people, as well as counties and companies, are prone to become too careless with monies, spending far more than they can afford. It is a time of over-optimistic hopes and dreams, most of which are not realistic. It is a combination of comedy and tragedy, because on the one hand, Saturn and Pluto in Capricorn, with the eclipse coming up in Capricorn in early January, portends the resolution to be disciplined and careful in finances. But then, on the other hand, Jupiter square Neptune looks at that shiny new car, that sparkling new piece of jewelry, and suddenly out goes that promised practicality and commitment to build one’s bank account. Out the window it goes for the fulfillment of an urge for immediate gratification. And then the bill comes due and you ask: “What was I thinking?” That’s the problem. You weren’t thinking. You were wishing upon a star, convincing yourself that you deserved this. Instead, you deserved a credit downgrade. I speak as if it is personal, but this is not just an individual problem. It is a problem with many governments that we are likely to see explode next year with Jupiter square Neptune. And that’s just the setup for the Capricorn Stellium that follows in 2020. If Jupiter in Sagittarius was overconfident and positive in 2018-2019, then Jupiter, Saturn, and Pluto converging in Capricorn right afterwards can be downright worried and pessimistic, unless it has planned well for this period. After all, in recessions and downturns, great bargains are possible for those who have cash.
The major challenge for Financial Astrologers is to determine whether the 2019 Jupiter/Neptune waning square will be the start of a real financial panic, or if this downturn will suddenly reverse and witness a huge rally and a “bubble” in stock prices. With Jupiter and Neptune, it can either be “irrational exuberance,” to borrow a phrase from former Fed Chair Alan Greenspan, or hysteria and panic where people lose all sense of control and faith in their leaders. Right now, it looks more like the latter is happening. But I would not give up on Jupiter in Sagittarius just yet. After all, historically, it is one of the strongest planet-sign combinations correlating to strong rallies in global equities before it is over. Of course, you can have a steep selloff first, after which rallies can look very impressive. But generally speaking, the stock market makes longer-term cycle highs with Jupiter in Sagittarius (November 8, 2018-December 2, 2019), and then the air escapes out of the bubble as Jupiter advances into Capricorn-Aquarius (2020-2021). What went up must come down.
Peter Temple interview – December 6, 2018
https://www.forexanalytix.com/webinars?v=n9hCG5TBtGA&feature=youtu.be
Thanks Rotot.
Peter T
You still are expecting 2840 before we head back down to 2400 , do you see all that happen before christmas
I am absolutely stunned by all the bullish blather I am hearing. Effusive gushing about triple bottoms, rare Zweig Breadth Indicator, whatever the hell that is, and seasonal bullishness. Did anyone notice the scary SKEW
during the downside action last week?! NO BUYERS!!! Low volume has been sending this warning for quite some time. The central banks stepped in BIG TIME and bought EVERTHING. Despite their efforts, the long candlestick tail was almost completely retraced. And this is BULLISH? ?!!
Never mind the MA death cross confirmed.
We have a LONG way to fall to get their attention….
A new weekend post is live at: https://worldcyclesinstitute.com/ew-its-the-little-things-that-count/
This website is for educational purposes relating to Elliott Wave, natural cycles, and the Quantum Revolution (Great Awakening). I welcome questions or comments about any of these subjects. Due to a heavy schedule, I may not have the time to answer questions that relate to my area of expertise.
I reserve the right to remove any comment that is deemed negative, is unhelpful, or off-topic. Such comments may be removed.
Want to comment? You need to be logged in to comment. You can register here.