
A Study In Market Timing (Updated on Aug 19, 2020)
It still seems I’m a bit early with my dates, and I’ll wave to update these once I have a confirmed top in place, which I expect to happen soon.
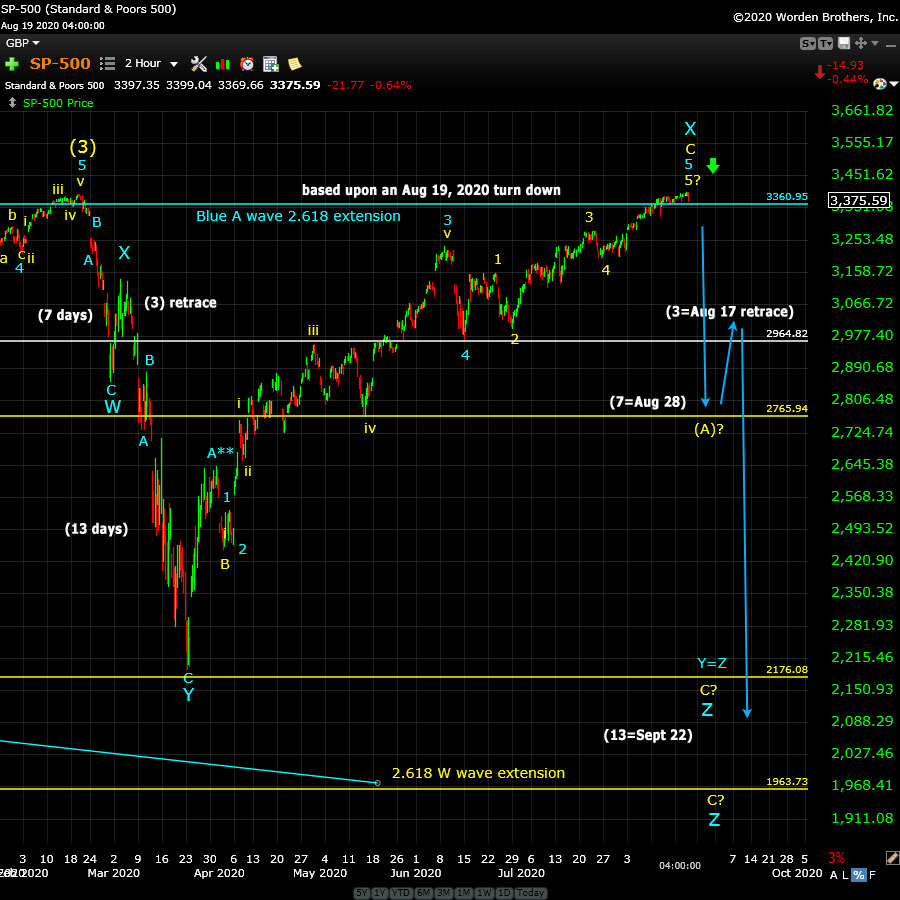
Above is the hourly chart of the SP500 for time projections forward, based on the past (click on the chart to expand). I’ve updated this chart to Wednesday, August 19 as the top now appears to be “in.”
There are multiple fibonacci options for a final target bottom for this fourth wave. I should know more about the ultimate downside target once I’ve seen the A wave down. I’m still expecting a zigzag pattern from here to a new low (until proven otherwise).
Wavelength projections
First, let’s look at recent history from the top at ~3400 and attempt to project the most probable market low to come:
Normally, I would measure a corrective target for a trade based upon a measurement of the first (or A) wave) using my fibonacci tool. There are two common relationships in projecting total length to the A wave (in this case, the A wave down is the labeled blue W wave, at 2855).
The first relationship is the A (W) wave extension. Measure the length of the A (W) wave with your fibonacci tool and the 1.618 and 2.618 extensions are the probable end points for the full wave. Since we’ve already surpassed the 1.618 extension, that leaves only the 2.618 extension. That level is 1967.
The second relationship involves the ratio of the C wave to the A wave. In this case, measure the A (W) wave and then place the fibonacci tool at the top of the B (X) wave at 3136. This projects a C wave low of approximately 1832.
There is another measurement that’s important (but keeps changing as the corrective pattern we’re in reaches new highs). If we contemplate two waves down of equal length, you’d measure the Y down from 3400 and place your tool now at about 3030 (the projected top of this current C wave leg. A wave of equal length down targets 2080. This doesn’t appear to be low enough to hit the lower trendline of the broadening top formation.
My preference, therefore, is the 1950 area. This makes it a more probable target bottom. However, we don’t have a top in yet, so it’s difficult to say what exact level the final measurement will target.
There’s another measurement I can’t make yet, although a preliminary “what-if” measurement targets 1950. I’m expecting an ABC wave down; a measurement of the C wave of that pattern isn’t possible until both the A and B wave are complete. Having that measurement may support one of the currently identified targets, making is more probable. We’ll have to wait for that one.
Timing
Since there’s a good chance we’re going to see a large zigzag down from the 3000+ area that will be the same length as the waves down from 3400 that are currently in place, let’s assume that the timing will be the same. The timing so far has been:
- W wave = 7 days
- X wave = 3 days
- Y wave = 13 days
Projecting this on the blue arrow lines that project a final zigzag down, the corresponding dates would be (with the turn down at as Wednesday, August 19):
- A wave bottom of approx. 2764 = Aug 28
- B wave top (a 38% – 62% retrace?) = Sep 2
- C wave bottom (approx. 1950?) = Sept 22
Note that in my experience, the final set of waves down move more quickly than the first set of waves down to the bottom of blue Y, but near the bottom, we may get a bounce that slows lengthens the time factor.
I’m not saying this final pattern is going to play out this way, but since Elliott Wave is about probabilities, I’d say that there’s a decent chance it will (or at least get close in both time and length). At least, it gives us something to “shoot at” from an Elliott Wave perspective.
_________________________________


