
Update: Monday, August 8, 3PM EST
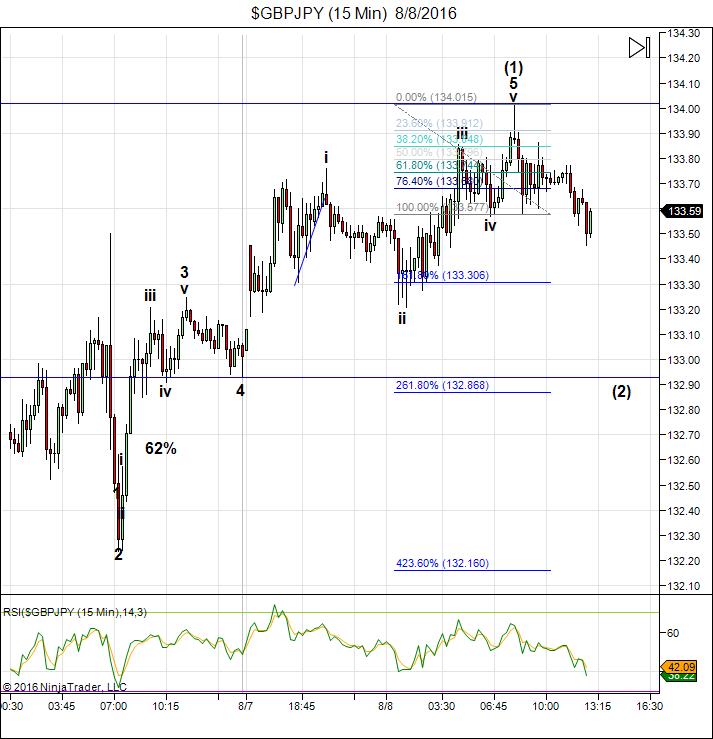
Above is the 15 minute chart of GBPJPY. For anyone interested in the long swing I mentioned below, here’s how we’re doing. I see 5 waves up and and 2nd wave down in progress. The entry point has changed slightly, at about 132.90. You’d go long and be in for a long time. Target is 170.46.
___________________________
Original Post: Sunday, August 7: On Friday, August 5, EWI came out with their latest monthly financial report in which they stated,
“Large speculators have held big positions at various times curing the DOW’s advance since 2009, but their current holdings are by far the largest since the e-mini contract was first launched in in the late 1990s.“
This information supports a major top not far off. It also supports the ending diagonal pattern that I’ve been predicting as the only option at this point. I’ve been predicting this ending diagonal for the past month ever since we rose to a new high in the first week of July. In the Elliott Wave Principle, Frost and Prechter described ending diagonals, “indicate exhaustion of the larger movement.”
As such, we’re now finishing the first wave up and expecting a very large wave 2 down, with the target still to be determined. For the DOW, this could be in the neighborhood of 17,000.
When the bulls sport optimistic levels like these, it means that just about everybody’s “in.” They’ve all had great success thus far and are wildly optimistic that the good times are going to continue to roll … but they never do. When the bulls are more optimistic than they’ve ever been, that attitude suggest a top is imminent.
However, this isn’t the final top, as the pattern is not complete yet. We have more to come and I expect a blow-off wave (the final fifth wave) at the top. However, once we have a second wave in place, it will become a bit easier to predict how the waves following it will unfold.
It’s time for contrarians to lift the lid off their cash jars and get ready to go short.
______________________________
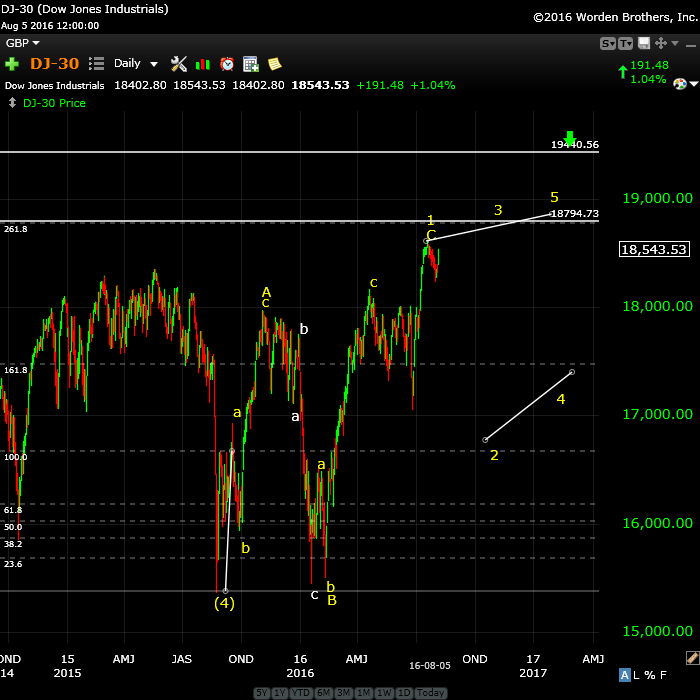
Above is the daily chart of the DOW showing a revised numbering scheme for the ending diagonal that I’ve been predicting. Let’s look at the ending diagonal rules to see why I’ve decided upon this labelling.
- The waves all have to be in “3’s.”
- The waves get progressively shorter. So because the yellow C wave is longer than the yellow A wave, the C wave alone can’t be the third wave. In other words, the entire large ABC wave up to 18,616 must be wave 1 of the ending diagonal, meaning that wave 2 is still to come.
- Waves 3 and 5 have to each reach new highs above the previous odd-numbered wave.
- Wave 3 cannot be the shortest wave.
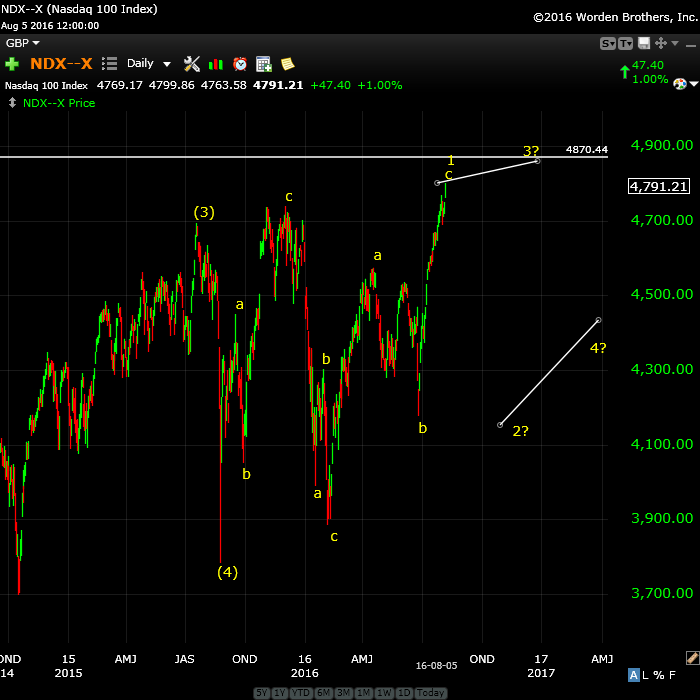
Above is a daily chart of the NDX (Nasdaq). As well as the DOW this pattern also looks like a very large ending diagonal. If that’s the case, we may get one very large 2nd wave down and then a final 3rd, 4th, and 5th wave up to a top. Ending diagonal waves are all in 3’s.
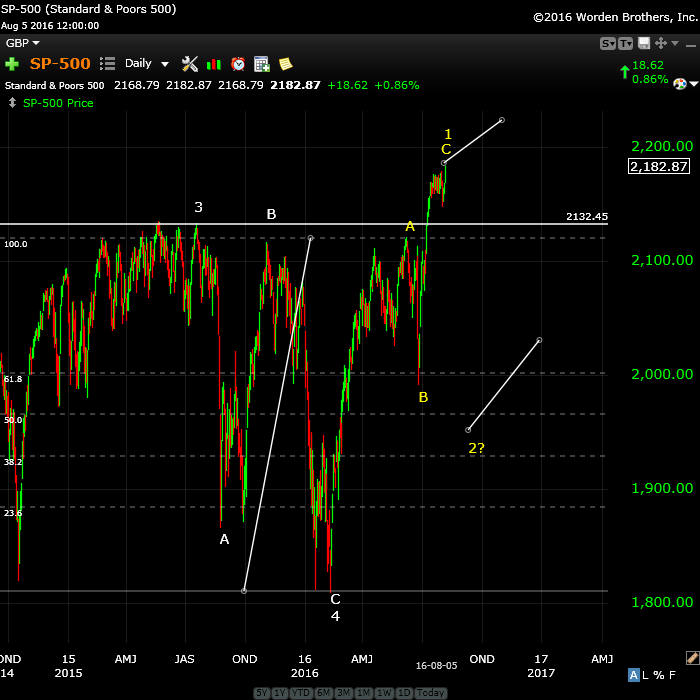
Above is the daily chart of the SP500 showing a similar (although very, very early) look at the potential configuration of the ending diagonal I’ve been predicting.In this case, as well, we have an almost complete first wave up and expecting a second wave down to at least even with the yellow B wave.
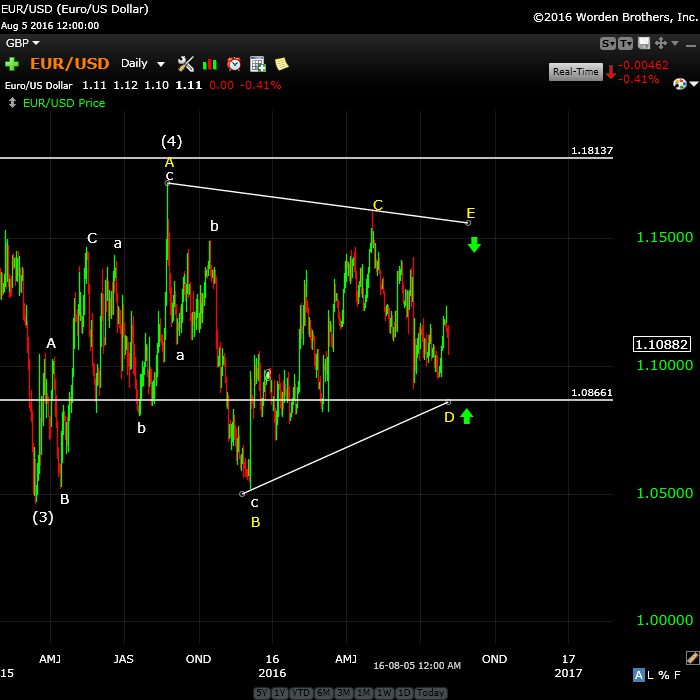
Here’s the daily chart of EURUSD showing the ongoing triangle—the major (combination—a flat and a triangle) corrective pattern we’ve been in since March, 2014. We’re in the final stages of a bearish triangle formation, with one more leg up to go to finish the E wave. I’ve widened the triangle here to leave a distance between yellow D and E of .618 X the distance between waves A and B (not shown here), which is the typical wave E length.
Although this currency pair has been “all over the place,” I still believe it should continue to drop to the 1.0870 level and then I suspect when we finish wave E of the expanding triangle in the US indices, we’ll turn up in the final E wave of the triangle. The chart below takes a closer look.
EURUSD should turn down after finishing the E wave in tandem with the US equities.
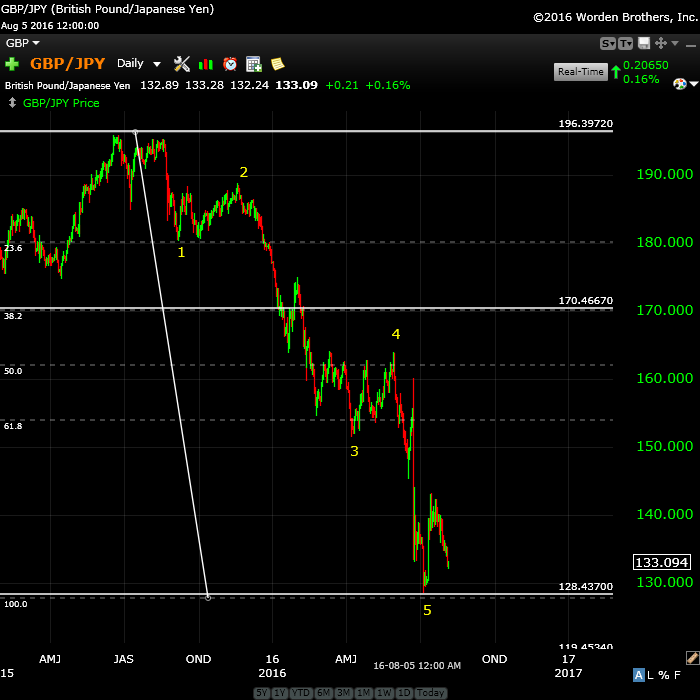
Above if the daily chart of GBPJPY showing a possible bottom of a motive first wave down. GBPUSD is also at a potential bottom, both looking for turn up for a good swing trade to the 62% retrace level. In this case the target would be the horizontal line at 170.46.
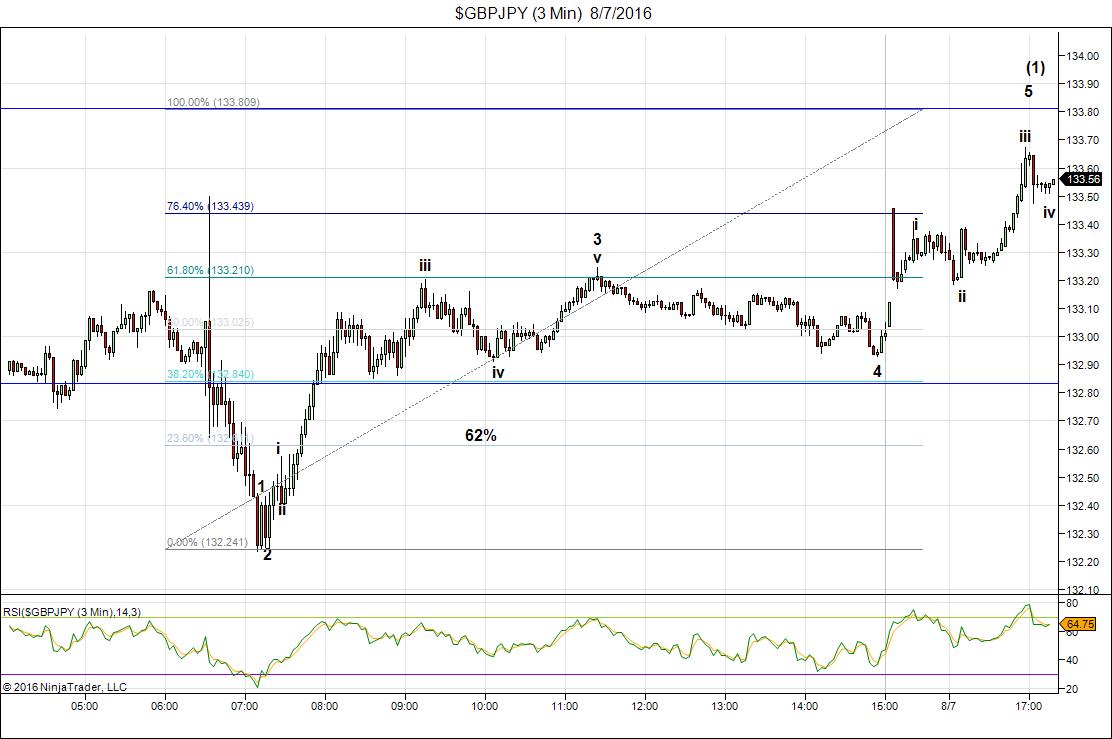
Above is a three minute chart of GBPJPY. I’ve been stalking this pair for a reversal and long-term corrective wave up to ~170.45. It looks like we’re completing five waves up at small degree to the previous 4th wave (at 133.80). The setup requires a drop to the 62% level (132.82 or so) in three waves, a turn there up into a third wave up. 132.82 is your entry point. Your stop is at the low (~132.24).
______________________________


Thanks, Peter Temple and Worldcyclesinstitute.com for the Elliot Wave analysis. PALS is firmly negative for equities all this week =).
That’s what I would expect 🙂
Short working so far. Tuesday to Thursday should be very lucrative on the short side. Won’t stay short if 1 to 3% is obtained.
Will stay on short side until next Monday. May require some time for short to set up, but am pretty sure we will touch 2050 within the next 7 days.
Moved puts to 8/19 expiration. Let the selling begin!
If I m right the selling will start tomorrow up next week till August 18 after that the real selling should begin.
John, I expect a more quick and shallow sell off that retraces into late August. Nadir should be next Monday =)
Valley-
2050 still your target area? If yes, how did you come to that target?
Just a guess re price. Direction in the PALS system is down until Monday so don’t think we go higher until after Monday. Could be lower than 2050 or could be higher, just figuring based on PALS that price will go lower.
PALS includes lunar phase, distance, and declination along with seasonals.
Peter-
With the change to count of the ending diagonal, do think the top could still occur In late September or October? Though a top of this magnitude should certainly come with a lot of volatility, 2-3 months seems short for waves 2-5 compares to the ~ 5 months for wave 1. Certainly understand the waves should be getting shorter in distance and probably time. Maybe very dramatic drops in the wave 2 and 4 down that are 5-7 trading days? I specifically look at SPX, but i think this applies to all of the indices from the blog post.
And as always, your work is appreciated.
I have that same concern but don’t have an answer. Wave 2 down should give us a bit clearer picture, I hope.
Peter,
Could it be possible from the Feb. low 1810 up to 2111 pivot on 4/20 that is ~EW1
From 2111 down to Brexit low ~E2
From Brexit low to current ~E3 (which is shorter than 1 and follows the guideline)
Now – as Valley thinks we hit 2050 (which I agree) that might be ~E4 (instead of EW2)?
If it does pivot @ 2050 it will sit on the trend-line from 1810 connected to 1991 low. It gives the appearance of a diagonal when we connect the 2111 top to current top and reference the above bottom pivots, and fits your Sept. time frame as we would just have to finish a EW5.
Thanks..
Hi Jody,
No, ‘fraid not, and here are some reasons why (I’ve been all through this):
I looked at the 2120 pivot as the (B) in EW2 – A expanded flat I believes allow for an over shoot.
So EW2 I would assume should drop lower than 2050 and possibly target the 50% area around 2000 like you had mentioned…
Thanks Peter..
That would be OK if flats weren’t corrective waves and, as such, move in the opposite direction from the trend, which is clearly up.
I’m not sure how low it will go, but I would not be surprised to see 1975.
I realize the concept of vibrations is too advanced for most of you. So one last word before I stop.
Einstein never said matter affects energy; he said matter is energy. In the same sense vibrations don’t affect anything; everything is a vibration.
Gann once said the world wasn’t ready for what he’d found. I think the world will never be ready.
Cheers,
André
Isaac Newton was similarly not understood by his contemporaries.
Please don’t stop, André.
How do you expect gold will react to stock market drop? Thanks again Peter, your the best.
Thats interesting as usually a large market drop sending gold up but we are expecting a drop below 1200 from peter’s analysis so it doesnt quite make sense but then again this market doesnt make sense!
Thanks for the new post Peter.
I used Fourier analysis back in March to extract cycle info (freq, amp, and phase) for the 100 frequencies within the S&P. I then constructed a composite line with cycle info for the top 10 cycles. Got sidetracked with other research and had forgotten about this composite line until this past weekend. I updated the chart with Index prices and to my surprise the composite line that I constructed 6 months ago was a pretty close match to actual S&P closing prices. In fact, it nailed the Brexit drop.
Going forward, the composite is shows a perfect 5 waves down with a major low on either 9/10 or 9/11, then rising after that to major high at the end of Oct.
Regards,
Ronbo,
Interesting! Well, that would fit with my “feeling,” about timing for the top, but I don’t have a lot to go on other than that from an EW perspective. Thanks!
Ronbo,
Have we seen the top in your cycle prediction for the low in September an do you have dates in between?
Thanks.
John,
Sorry, but I only used a years worth of data when I took the Fourier Transform. With that said, the composite model is basically detrended and doesn’t show long term. An image of the graphic is here…http://www85.zippyshare.com/v/L3f6tenw/file.html. Frequency, Amplitude, and Phase vary, so I was pleasantly surprised the model somewhat held up over the past 5 months:)
Regards,
Thanks for sharing.
New chart posted up top for GBPJPY.
Peter,
the waves i and iv are overlapping at this chart GBPJPY. 1and 4 too.
Do you consider the whole wave up motive any way ?
Just has to be in 5. This entire wave up is a corrective wave. Overlap doesn’t matter.
Well, we’ll at least get a double bottom. No cigar, but we’re close.
You were actually probably right on that. I had two counts and wasn’t sure which one was right. But either way, it likely should have no overlaps. I think everything is going to turn at once, and I’m looking to USDJPY for a clue.
Peter-
Using the SPX and or ES, does it look like we have five waves down from the high this morning? My thought is yes, but was looking for the expert confirmation. I would assume wave 5 still has a little more to go.
Looking like it from here.
I would be cautious about that wave down …
I think tomorrow the last pop up…
Cheers,
W
Thanks Valley,
I think the period August 25 till September 2 is a nice time to be short.
Good luck.
Agreed, John. Sell off as Peter has suggested and then rally back to ATH late August.
Sell off a little delayed Valley? Maybe it begins Friday all the way into next week.
Could be wrong, position size is small. Still think we will be lower on Monday. =)
YES_ENERGY is MATTER and it has an effect on EARTH which means it has an effect on HUMAN BEINGS and our activities- I HAVE FOUND scientific resources that identify IN ADVANCE how the STOCK MARKET will behave UP TO AS MUCH AS ONE MONTH AHEAD.
Jaywiz
After 8/11, 8/14 is a very strong vibration. But once that one has passed we will see some serious decline. So nothing has changed; next week will be down. The experts will say it was opex. I say it is all about vibrations.
I know nobody reads this but I want to be able to say : I told you so 😉
Cheers,
André
I think you’re dead wrong about nobody reading this … lol. Thanks, André 🙂
Thanks, Andre’. Good info!
Thanks André,
I think the period August 16/18 or else after August 25 we will see a decline.
I am reading your stuff André, loving it! 😀
I don’t think the markets are going down ever again lol. I say it half joking, but it’s amazing that the turn dates are all up nowadays. No significant downturns. In fact, we haven’t seen more than a 15 point decline (daily net decline) in the S&P since Brexit. Pure madness. 2200 here we come!
Many months ago I said I saw the last support run into august. This is a Jupiter cycle. It ends 8/17 and then the move down into march 2017 can start. It will happen next week. I have other tools that all show extremes. So 8/17 will be tested from below but this will be the final capitulation.
So; there is a reason markets want up. But it will end soon. This weekend I’ll give some more arguments.
Jupiter planet of expansion, the date you mention is close with the important Bradley turn August 18.
Nice!
https://worldcyclesinstitute.com/impending-tops/#comment-10342
“Expected Dates for S&P 500” – Olga Morales, July 25, 2016
18th Aug
6th Sept
21st Sept
6th Oct
22nd Oct
10th Nov
21st Nov
5th Dec
24th Dec
Love to read when some one says the market is NOT EVER going down again.
BUT
A 300 pt Dow sell off should occur 2mrw and continue lower on Monday
See the SCIENTIFIC Resource called Jaywiz “MOTO” as published on Monday August8th. Jaywiz
Jaywiz,
I fully agree, although I think the decline starts Monday. Could you tell some more about the nature of this science? Would be very interesting. Then I will tell some more about my analysis. Also science, I think 😉
Andre
I call it Universal ENERGY- IT can be seen via the SCIENTIFIC RESOURCES that ive been studying for about 5 years now. YOU CAN See samples at the blog along with an explanation of how we use them. ITS FAIRLY EASY TO SEE an 80% correlation of energy to stock market DIRECTION – not so good on magnitude, but we can live with that as long as we can benefit from directional changes.
YES , Andre, AT 2pm , its NOT LOOKING like a big sell off is coming today, FRI, AUG12th. However, WE do expect next week to recover from whatever pivot LOW does occur on Monday and or Tues AM. A TIME STUDY shows that JUNE12th was 3 X 610 tr day from 3/9/09.
Aug24th is GANN 49 days from JUNE10th HIGh at 2120. THAT is POSSIBLY the END of the BULL MARKET, which does appear to be running in overtime.
more later
Jay
Jay,
Thanks for the reply. Will post some more tomorrow on my outlook. But I appreciate your input.
Cheers,
André
Andre how can i stay in contact with you…..Nick..
André,
I am with Nick… We could make an e-mail group???
Cheers,
W
You can start up a small group in the forum and even personally email each other directly there.
I prefer an open communication through this site, so everybody can join. Peter’s analysis is far more advanced than mine. All I try is to add a little timing.
So if there are questions; just ask them and I’l try to answer.
Part of the reason I come here is selfish; I want to learn. So I really hope for feedback. A closed e-mail group would not serve this purpose.
Have a nice weekend.
Cheers,
André
That is cool André! 🙂 And it is never selfish to learn new stuff, never! 😉 Learning = GOOD, more people should try this… ^^
Cheers,
W
there are numerous ways to gauge the state of the market…in my view, the following constitute the ‘market tell’: SVXY & BPCOMPQ
utilizing SVXY 60 minute, 120 minute, and daily trend charts with two customized 60 minute BPCOMPQ charts…the market indices will not turn down in a meaningful way until SVXY & BPCOMPQ so ‘permit’…
Andre’,
Agree with you. This is my favorite site because of sane discourse (non trolling) on two topics that interest me, with a hat tip to Peter for making it work and others like yourself who freely contribute. Along those lines, I too have found vibrational frequency useful for price (I have not attempted used for time), especially on a more macro level as a further confirm and they tend to act as attraction levels around which battle lines develop. I use I use frequencies based on both 440 and 432. I have also explored Ennegram and may I recommend “Gurdjieff: Cosmic Secrets by Russell Smith”. You will understand its relevance immediately, but it is not easy and I struggle with this esoteric but do believe it is important. Finally, I would like to suggest an examination (using the same methods you have described for sound vibration) of color vibration. I’m pressed for time now, but will describe more later.
Steve
I look forward to you sharing more, Steve. 🙂
Steve,
I have the book you mention, but not finished yet. Really appreciate your support and Iook forward to exploring these techniques with all of the readers as I think there is more to it than one might initially think. I know I am stunned by what I see. But still lots to learn.
Andre’,
A few comments on Light. In my opinion, we are swimming in a sea of light. Quantum, where electrical, gravitational forces have an impact on packets of really spooky stuff, as Feynman and Einstein’s, et al work has shown. I believe that light, at the micro level, begins to stamp it’s never ending probabilities on personality development. At the macro level, the shifting tides in an ocean of light impact emotions. If so, just as Joytish meant to the ancients 10,000’s of years ago “The Study of Light”, lets look at one aspect, the vibrational frequency of light. White light can be split into the color spectrum, from low frequency Red (frequency ~ 370) to high frequency Violet (~698) and even Ultra Violet (~784). And in ranges way beyond. Then using the same technique you described elsewhere, construct whole multiples of those frequencies and Fibonacci sub-division between on the color spectrum (I am sure there are better methodologies). This creates a matrix. I only use this for price, have not applied to time. Based on this approach, the price frequency for S&P would have a very difficult time breaking 2200-2210. The first level of minor support that there will be a battle at is 2172-2170, next 2158-2155, then 2143-41. First major support at 2095-2093. Again these are where major macro battles are attracted to, fine toning is best done by with Peter’s Fibonacci Tool. Sorry for being long winded.
Steve
http://7442analytics.com/wp/
rotrot,
All I need now is to find out how much more I don’t know … 🙂
It never ends.
I miss watching Sean. Hope he’s doing well.
Fascinating stuff, Steve. I’ll check out those fib levels on the weekend as to how they check out with where we’re at. Agree on the top one, but we shouldn’t make it even that far.
I agree, and it is spooky that these are levels that have existed since “Let there be Light” with no regard to index, cash or futures, or structure,… I believe that your EW and Fib tools are better as the pattern unfolds based on preceding structure at the micro level. But it is kind of nice to potentially know way in advance the area code where price battles would be fought. Now if the same could be done for time….
PALS and next week:
Phase: bullish after Monday at noon e.s.t.
Distance: bullish all week
Declination: bullish after Monday
Seasonals: neutral
Summary: after Monday at noon e.s.t., I will sell my puts and move to cash. Didn’t lose much being short so far and will wait for next set up.
PALS is lunar/seasonal and works o.k.. Found an interesting non lunar factoid consistent with current planetary alignments. During last decade when Jupiter and Venus line up so that Venus is directly between Sun and Jupiter market has had consistent rise in price into that alignment. Right now Venus is between Sun and Jupiter, so this “could” explain what price has been reluctant to sell off last two months and “possibly” market could begin to have sell offs from here forward.
Valley,
The interplanetary magnetic field is caused/affected by a tidal pull on the sun’s surface. Jupiter and Venus create the largest pull, especially when conjunct. And that should bring a high. So your observation is 100% correct. Just wanted to let you know.
André
Thanks, Andre’ for the clarification!
Hi Valley,
I m with you, I also think up Monday/Tuesday morning.
After that a close look what the bradley turn will bring on Thursday (18th) when it is still positive I expect the markets to rise till August 25.
Nice weekend to all.
Hi John,
I am looking for a selling day and if Monday doesn’t deliver will continue short until Tuesday at open. Won’t be short past Tuesday.
Steve,
We’re on the same page. My philosophy is simply that everything is a vibration. The first moments after the big bang there was only energy. The Higgs-boson was needed to add mass. No mass no matter. But even now, 80% of the universe is ‘dark matter’; just energy, no mass.
So, deep within everything is energy. And there are different ways to find the vibration. I mentioned music, but that is just one way. My system is mainly time. The challenge I see is how to integrate everything.
Maybe I may suggest a book : A Beginner’s Guide to Constructing the Universe by Michael Schneider.
I could talk for hours about this, but I won’t.
Last week I said : 8/11 will be the high but we will drift into the weekend. And that is basically what happened. Tomorrow i’ll explain why 8/14 is so special.
I love where this is going 😉
Have a nice weekend,
André
To illustrate my point I use something completely different. From vedic astro we know the upagrahas system. The dhuma is one of them. Dhuma gives 8/13. And that is also mastertiming on the may ’15 high. And that is also Saturn stationary direct.
3 techniques as different as they come. But they all give 8/13. This way I see a cluster of dates 8/12-13-14-15.
But the key is : this alignment was unavoidable; this is the vibration that shows up in everything. That’s why S&P made a low Friday. Not because there was good news, not because there is no alternative; this is simply the vibration that runs into the weekend. And the market has to comply, because the market IS the vibration. As is music, as is light. Free will is a myth. And next week will be down. Why? Ask the universe,
Cheers,
André
Andre’,
I have recently begun to explore vedic to try to define time, when I have the time. Researching how best to use the New Moon as the natal. A new natal every month, plus a new moon eclipse for ~6 months. How to employ nakshatra, tithi, yogi,… Ugh!, so much stuff. What the ancients knew is amazing. Looks like you are further along than I. Steve
Now a little exercise for everybody.
1) calculate the venus/saturn angle
2) calculate the sine on this.
Did 8/14 give -1? Well done!
I have had some discussion with rotrot on the end of august/early september timing. At first I thought that maybe the average around 9/2 would solve this. Now I realize the could be seperate. My system says both 8/30 and 9/6 are strong. Remember Robert Gordon’s birthday was june 9th (6/9). So 6/9 and 9/6 were special for Gann. And when we turn 6/9 90 degrees we get the sign of cancer.
This weekend will bring a high and next weekend a low. Then 8/25 is next. So now I’m thinking 8/25 high , 8/30 low, 9,6 high.
Rotrot/ anybody, thoughts?
we are all investigators trying to piece together available evidence to determine what is happening in the markets…jokingly mentioned “there may be something to the astrological influence on markets”…recently reviewed the proprietary analysis prepared by a financial astrologer relative to the second half of August and beyond…the astrologer’s conclusions are consistent with Olga Morales’ public pronouncements: “surprise events”, “violence”, all in all, bad things…FWIW, the financial astrologer nailed the post Brexit low…my personal bias is to be skeptical until things are proved to be true…having said all that, my inclination is to be very cautious going forward with an eye towards the late August dates for some sort of top (may not take out the top attained this week)…too many people are aware that the market ‘never’ makes a significant top during August and have cited various examples to include the top made on September 3, 1929…
http://www.pbs.org/wgbh/americanexperience/features/timeline/crash/
agree with 9/5 as possible start of a NEW TREND-DOWN
JUNE10th as prev noted was 610 fibo x 3
SPT1st is 55 from June10, another typical time peak/ turn
That means to me the DAY AFTER LABOR DAY, SPT6th can reveal a more serious downtrend
has begun– VERY Similar to 1987.
andre now a days downtrend down 10 spx unless there is bad news looks market wants to crown hilliary
Rose,
News follows the market, not the other way round, So I predict there will be bad news within the next few days. Just hope no lives are lost. Then you can say it was the bad news and I can say it was the vibration and we’ll both be right.
Cheers,
André
I concur. Well said, my man!
rose,
I’m actually betting against that happening. The market (and by extension, what controls it) is very devious. We’ll see. I think it’s going to be a tale that would write a best seller.
understand your inference…however, we are obviously in the minority…the final answer might be something none of us can imagine right now…interesting times…?
Peter andre. Reality looks like a dangerous wedge. With all the gaps. Either they sucking people and smart money selling. They wont let it fall and the estimates are 2400 etc etc. Never seen something like that. Tganks both of u
my sense is things are changing…good news has been GOOD…bad news has been GOOD…going forward, bad news may actually be BAD…
aahh … the faeries at work … yes, times are going to start getting REALLY interesting …
Hi Peter, Just learning about Elliot Wave and see it’s great benefeit. My question is, “How do you know that Thursday’s S&P 2188 is not the high and that it must reach 2190?” Also you mentioned a possible low of 1950 or 1960 for s&p. Is that a fibonacci retracement to a previous low earlier in the year? Thanks Mike
Mike,
Price is secondary to the pattern. Ending waves are in five waves. We have three motive waves up and are in the 5th. Until it completes, we will have no downturn. The price target is the immediate target, yes, but the pattern has to be complete, more importantly.
Those drop targets are nothing more than an guesstimate, based upon the 62% retracement from our current position to the Feb 11 low. Hope this helps.
I want to say a big THANKS to all of you posting in this blog. There have been some really fascinating entries in the past couple of weeks and I urge you to keep it up. My concern is that it all gets “lost” every time I create a new post, so I’m going to take some of the most interesting comments into the forum and attribute them to the originators, and perhaps we’ll get more discussion there … (sometime this weekend – have a lot on my plate).
Another thing few months ago bill meridian in his interview had said aug month will be bad for trump about something he will say which will hurt him. But month if sept month will be bad for hilliary- bad health or related problem to bill clinton. He also had the worse chart for cia director comey- who he thought would have to resign probably in sept. May be more hiliary email problems
https://worldcyclesinstitute.com/a-bullish-world/#comment-10124
For those who feel vibrations are a bit too outlandish I have a more traditional analysis.
July 27th we saw a max perigee distance. As perigee is the point where the moon is closest to earth, it matters a lot how close this is. The closer the moon the stronger the gravitational force. This is a 3-4 month cycle and perigee at its greatest distance is the best deal you’ll find.
August 10th we saw first quarter at apogee. This is an aligment of the 27,5 and 29,5 day cycles. And again; this is as good as it gets.
So we see 3 cycles turning. From now on perigee will come closer while we are headed for full moon at perigee. Full moon at perigee with perigee at minimum distance will bring the mother of all super moons.
Gravity is just one of the natural forces. But for the next 3-4 months gravity is not our friend.
Magnetism is another force. But as Valley has explained, the IMF cycle has peaked as Venus is moving away from Jupiter.
I challenge everybody to give me a bullish argument.
P.s. When Mercury is at perihelion it/he? has a decent pull. This will be 9/29. This will likely create a lower high around the end of september.
Hi Andre’, IMF? MF is magnetic field. I is for “inner”?
IMF=interplanetary magnetic field
Thanks!
Andre’,
Would like to add some thoughts to your comments/thoughts on timing between now and September 6. Malific Mars is generally good for market, but I am concerned if it teams up with another bad boy. It is closing in on the fat bad boy Saturn, now direct after retro, on August 24 through 29. Then on August 28 it is square spooky Nodes (which themselves will have abnormal motion). And in case this isn’t enough to be watching our backs on, it will be occurring on August 24 at the September 1 eclipse point of 15*15′.
Steve
My long term cycle system identifies this weekend as major as confirmed by two heavy vibrations 8/11 and 8/14.
My Jupiter cycle is up into 8/17
My dasha timing is up into 8/26.
So 8/26 will be a high (or 8/29 Monday after). Then 9/3 low and test on 9/10.
Think this is consistent with what you see. Mars and Saturn are slow movers so a 5 day orb is reasonable.
Don’t forget the new Mercury max cycle that starts 8/16. (mercury always +/- 3 cd).
And Venus parallel Jupiter this weekend. Mars OOB since beginning of this week (15 year cycle) and moonwobble period starting 8/26.
venus parallel uranus
Steve,
Do you see how your worries about the bad boys joining forces confirms the 8/26-29 timing I see?
Andre’,
Yes I did. Wasn’t sure what direction you were coming down on though. Thanks for reminding me about Moon Wobble! That is important. I do not know how to process the Mars out of bounds, although 15 years ago was pretty ugly. And 2 Mars OOB = 1 Saturn cycle. Humm…
Possible play book next two months:
Market falls into mid August, rises then into 9/28 (Mer/Venus helio opp which has pattern of 45 days of price rise prior). 9/28 is also Jup conjunction +/- nice change in trend time. However, next two months are weakest of rotating 2 month cycle and it is summer doldrums and September selling season so if planetary benefit is reduced by cycle/seasonal deficit, maybe we go sideways next two months.
New post live: https://worldcyclesinstitute.com/an-accident-waiting-to-happen/
This website is for educational purposes relating to Elliott Wave, natural cycles, and the Quantum Revolution (Great Awakening). I welcome questions or comments about any of these subjects. Due to a heavy schedule, I may not have the time to answer questions that relate to my area of expertise.
I reserve the right to remove any comment that is deemed negative, is unhelpful, or off-topic. Such comments may be removed.
Want to comment? You need to be logged in to comment. You can register here.