
 The American Eclipse, Hurricane Harvey, and Hurricane Irma are marking the top of a major climate cycle. Extreme climatic events always mark a climatic, societal, and economic shift and predict a major depression and market crash.
2017 has been a banner year for aurora borealis light shows towards the North Pole.
“As it is about to turn cold, that is, when long climatic cycles are shifting from the warm to cold phase, the sunspot cycle shortens, sometimes to only eight years in length, and averages shorter than normal throughout the cold period. At the same time, the maxima contain more and larger spots and the spots continue to be more numerous throughout the cold phase. Just before it turns cold, solar storms large enough to identify with the naked eye are likely. Such an occurrence is excellent evidence that the warm phase of a long climatic cycle is about to end.” —Climate, the Key to Understanding Business Cycles, Dr. Raymond Wheeler
Nobody is yet talking about the effect these hurricanes will have on food production, but it will be severe. Expect crop failures in both the states of Texas and Florida. On top of this, the turn to colder will end the wet phase and the climate will turn dry (a wet phase almost always precedes a dry phase). The dry phase will likely last for decades. We’re starting to see the dryness in all the forest fires in the both the US and Canada. We’re still in the extreme weather phase (think of the usual storms that accompany the onset of fall, but on a much larger scale).
Civil war always accompanies a colder/dryer climate.
The Cycle Top of the Roman Empire
Sunspots and Aurora were reported in A.D. 51. From A.D. 85 to 120, Aurora were fairly frequent. These factors along with other evidence, confirm that shortly after 85 A.D., it turned cold for several decades. Extreme weather always marks the tops of these major cycles.
Written sources from about 75 BC to c. 175 AD also emphasize moisture, mainly in the form of the Tiber floods in Rome. Large Tiber floods occurred in 5 (lasted seven days), 15, 36, 51, 69, 79 and 97 AD. Starting from the Roman annexation of Egypt in 30 BC and until 155 AD favorable floods occurred more frequently in the Nile.
The winter of 69/70 AD was the driest known to Tacitus when he wrote his Histories around 100 AD; exactly at the same time the dry season persisted in the Americas. Dry conditions returned during the reign of Hadrian. In Timgad – on Hadrian’s visit to that city in 133 rain fell for the first time in five years. Some parts of the empire, however, saw better precipitation.
The same pattern is playing out today; It’s a pattern that returns every 500 years as the temperature on Earth reaches a cycle high and then turns down again. There is always a market crash that accompanies this cycle top.
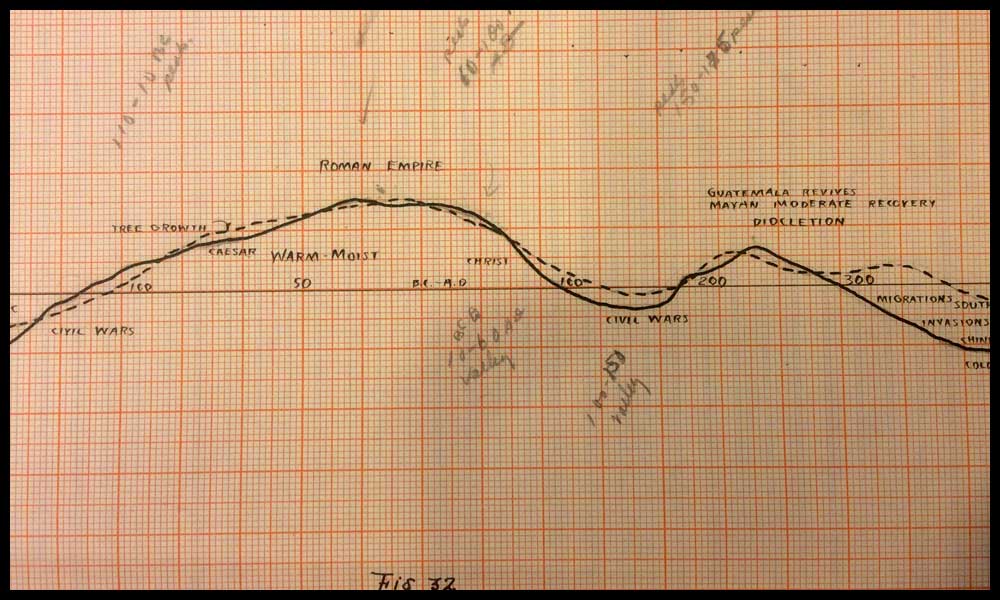
Above is a diagram from Dr. Raymond Wheeler’s decades-long study of climate cycles and events stretching back to 600 BC. You can see the temperature (black solid line) reaching a high about the year A.D. 70. Wheeler’s temperature cycles and work is fully supported by the GISP2 data acquired in the 1990s through ice core samples undertaken in Greenland.
Extreme weather that marks the change to a cold/dry climate always leads to palace intrigue, civil war, depression, weak and/or tyrannical leaders, and social upheaval. Following is a brief history of the period around the Roman “high.”
At the time of Christ, the Roman Empire had reached its peak and was beginning a decline. Empires decline when the temperature turns colder. It begins with a warm, moist period (often with floods) and then gradually turns colder and drier. Caesar ruled at the heigh of the Roman Empire, of course, and was assassinated at the end of his reign (thanks Brutus!). After the peak in temperature, the empire began to fall apart through civil wars, and unrest.
The emperor Augustus (ruled 27 BC – AD 14) was a dictator and presided over major wars on the Empire’s borders. Persecution of Christians went on for some time as the empire began to fall apart. Next up were Tiberius and then Caligula. Caligula was assassinated, as were so many other rulers of the following period of decline. (Note: there were two calendars in operation at this time, so some dates differ by a year or two).
Temperature had already turned colder. Caligula reigned from AD 12 – 41 and is remembered for his cruelty, sadism, extravagance, and sexual perversity, presenting him as an insane tyrant (a theme of colder climates). Claudius (41 – 54 AD) followed as the next emporer, but although a kinder autocrat, had great difficulties ruling and was eventually murdered by his wife.
Nero followed, generally viewed as compulsive and corrupt (AD 37 – 68). Temperature continued to drop. Rome virtually burned to the ground during his reign (AD 64). He also began the First Jewish-Roman War, often called “The Great Revolt.” It was a time of continual revolution and revolt in various regions of the empire. His death (suicide) led to a period of civil war.
In AD 69, four emperors ruled in succession. Major unrest and rebellions continued. Domitian followed and is described as and autocrat and despot. He was finally assassinated in AD 96. Nerva then came to power and was the first Roman Emperor to be elected by the Senate. so we start to see autocratic rule changing into a more democratic approach. This is an ongoing theme during these intense periods of revolution. Democracy tends to eventually get a new lease of life, but it’s not an easy journey, and in fact, this was a little ray of hope in a much longer road into authoritarianism.
A 172 Year “Double” Top
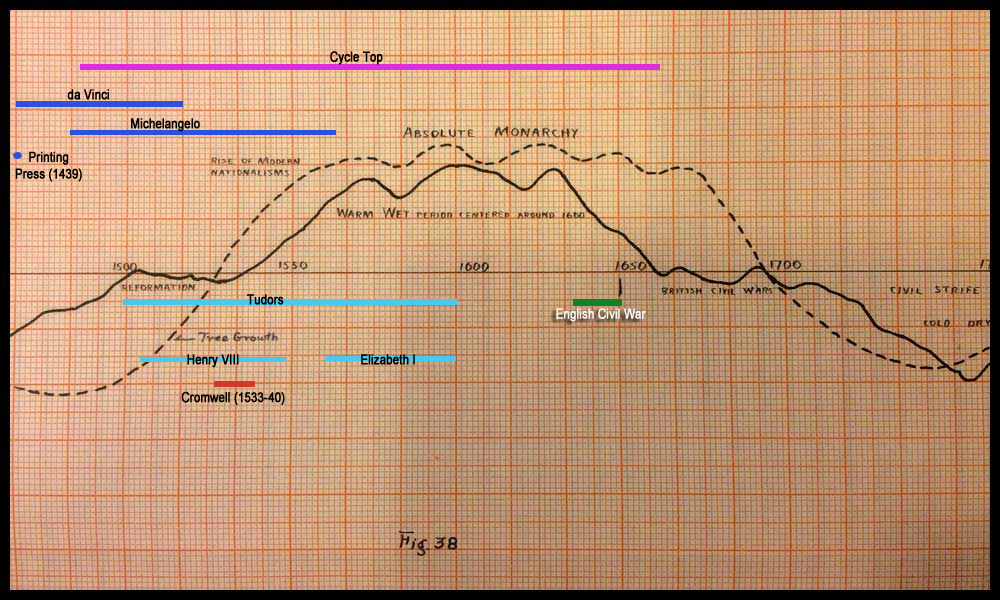
Above is a climate chart produced by Dr. Raymond Wheeler (in the 1940s) of the climate cycle turn at about 1600 AD. I’ve placed a purple line spanning the two cycle top dates of 1492 – 1664 (a total span of 172 years).
Notice that this top had an unusual warm-wet peak, but then turned dramatically colder at about 1630 AD. Warm-wet periods are “golden ages,” and you can see that the renaissance dominated the period leading up to the temperature high, with the work of both da Vinci and Michelangelo playing major roles. The Reformation, which was also in full swing, made the period volatile from a social and political perspective. The Reformation was ushered in at the time of Martin Luther (1517) and Henry the VIII’s reign was a turning point for Great Britain in this respect.
1491 and 1662 marked 172 year cycle tops (If you divide 515 by 3, results in the harmonic 172 year cycle, which is every bit as tumultuous economically as the higher degree 5151 year cycle top). 1662 was a “higher degree” 515 cycle top. It followed on the heels of a temperature high.
“Famine, pestilence, and economic depression were accompanied by war. The entire century from 1551 to 1650, peace prevailed throughout the continent only in a single year (1610)—a record unmatched since the 14th century. These conflicts were remarkable not only for their frequency but also their ferocity. By far the most disruptive was a cluster of religious and political conflicts that historians call the Thirty Years War (1618-48). This great conflict was a catastrophe for central Europe. Historian Gunther Franz estimates the population of Germany declined by 40% from 1618 to 1648—a larger proportion than were killed by the Black Death. Other scholars think that losses were not so high, but all agree that the human cost of the Thirty Years War was very great; appalling atrocities routinely occurred.
In 1591, the weather turned wet and cold. European peasants watched helplessly as their wheat and rye were beaten down in the fields, and their hay crops rotted in the meadows. The same thing happened the next year, and the year after that, and altogether seven years running. In France, the wine harvest was late and small from 1591 to 1597. Grain crops fared even worse. The decade of the 1590s was so cold the Alpine glaciers began to send rivers of ice through inhabited valleys.
Similar events had happened before, but in the 1990s, they came at a time when the economy was dangerously overstrained. Families had little in reserve. Food riots broke out in many parts of Europe. As the troubles continued, people began to starve. A season of scarcity grew into a massive famine that was called “The Great Dearth.” There were terrible scenes of suffering in many parts of Europe.” —The Great Wave, David Hackett Fischer
When climate turns colder, it leads to civil war and in this case, that’s exactly what happened, with the English Civil War and many years of social unrest following.
Britain until this time has been Roman Catholic, but it was under the rule of Henry VIII that the Protestant religion began to take hold and it was Thomas Cromwell who was at the center of this dramatic change. I’ve written about the roles of Cromwell and Henry the VIII and their similarities to Bannon and Trump here. Under Henry VIII, Feudalism ended—a major financial upheaval. I would expect something similar with the revolution we’re about to experience, some 500 years later.
Under feudalism, the King was answerable to the Pope. At the end of the Middle Ages King Henry VIII clashed with the Pope and England subsequently broke with the Catholic church of Rome and the power of the Pope. This led to the establishment of the Church of England and the Dissolution of the Monasteries. It was the final ‘nail in the coffin’ of the Medieval Feudal System, feudalism, in England.
Dr. Wheeler (who read over 200 history books in his quest to equate societal change with climate, also wrote about the period following the year 2000:
“Current events show that another world convulsion is occurring second only to
- the emergence of rational thought in the sixth century BC,
- the fall of Rome and other ancient civilizations in the 5th-century and the beginning of the medieval world based on feudalism, and
- the final collapse of the Middle Ages in the 15th-century.
The current convulsion will be comparable to the birth of Christianity in the first century and to the birth of the modern nation as a feudal principality in the ninth and tenth centuries.” —Dr.Raymond H. Wheeler
A Word of Caution
We’re close to a major market top. I don’t expect a “truncation” (’cause I don’t believe in them—I’ve never seen one … ever!) But the final wave could be shorter or longer than expected. Sometimes we see very short little fifth waves within that fifth wave, for example. And fourth waves, which is what the main USD currency pairs are currently tracing out exceed their targets most of the time (only in the case of a flat do they hit a target precisely.
The other issue is that near a market top, retraces in the opposite direction of the trend tend to go deeper than usual, and can be quite scary—until they dramatically turn in the other direction, with almost no warning.
One final thing to keep in mind is that there could be quite a bit of volatility at the top. Nobody’s seen a 500 year top, so we don’t have a lot to go on.
Volume is light, which means that almost everyone is “in” on the long side and smugly enjoying their profits, believing this market is going to continue on for a whole lot longer. Of course, a lot more are “out.” It’s amazing how many hedge funds have folded as they simply haven’t been able to make any money (and are unsure of where the market is going). In any event, that takes a lot of money out of the market.
But the biggest factor is the sentiment of “the herd.” As the climate turns and Mother Nature continues to take her toll (hurricanes, flooding, tornadoes, etc.), crops will be affected. Mood is gradually turning negative. We have an opioid “pandemic” across the US and Canada certainly, and that tells you lots about the psychological “pain” that’s out there.
Mother Nature is all powerful, and she always wins in the end.
It’s going to get a lot worse before it gets better. Start getting prepared for a decades-long “winter.”
_________________________________
the real deal SM 2
The real deal …‘Educational, insightful and thorough market analysis for all levels of traders. It’s Elliott Wave at its best….Peter Temple is the real deal’ —SM |
Get an upper hand … JC 2
Get an upper hand in trading …Seeing all the different currency pairs and the wave structures and hearing you explain why this has to do that on a nightly bases gives one a upper hand when trading. Elliott Wave applies to all stock and indices and can be applied to any candlestick chart. If someone ask what you want for Christmas – Tell them a membership to Peter’s “Traders Gold!”—JC |
Tops in your field DZ 2
Tops in your field …You are tops in your field. Tried to follow Elliot Wave international for years. They were always behind the market. After discovering you, I perceive that you are an expert in reading the waves, which puts you way ahead of the rest of your peers. And you can read the Waves like you are reading tomorrow’s financial section. I pray you stay healthy. —DZ |
A true expert in Elliott Wave FL 2
A true expert in Elliott Wave …You are a true expert in EW analysis. What you provide is not available anywhere and is priceless. Subscription on your services is the best thing I have ever done. Many thanks for your effort to make me a better investor. I now have more trust in my investment decisions. I hope you will continue the excellent work! —FL |
Couldn’t be happier … KK 2
Couldn’t be happier …The analysis and insight you provide is simply amazing! I’ve been trading the futures and equity markets for well over thirty years and usually average around 5% monthly. Since joining your Traders Gold Service two months ago, that number has better than doubled. I couldn’t be happier.—KK |
Have not had a losing week RW 2
Have not had a losing week …I have been with Peter almost a year. The only thing that matters is have I made money with his service. I think I have finally turned the corner using Peter’s EW. I have not had a losing week in the last 5 months. Thanks Peter, for your amazing amount of hard work. —RW |
The best of them JL 2
The best of them …Last couple of years, I subscribed to several ‘market traders’. You are by far the best of them and the personal contact is awesome. Daily and daily updates are very well written! Besides your expertise in EW, I also like your cycles analysis. Best investment I ever made! —JL |
Rise above the rest … SM 2
Rise above the rest …I have only ever met a few people who, in their chosen fields (astrology, medicine, music, martial arts, technical analysis), rise above all the rest and you are one of them…you have ‘the gift’…and that’s why I’m a Trader’s Gold member. —SM |
The Market This Week
Here's the latest daily chart of ES (emini futures)
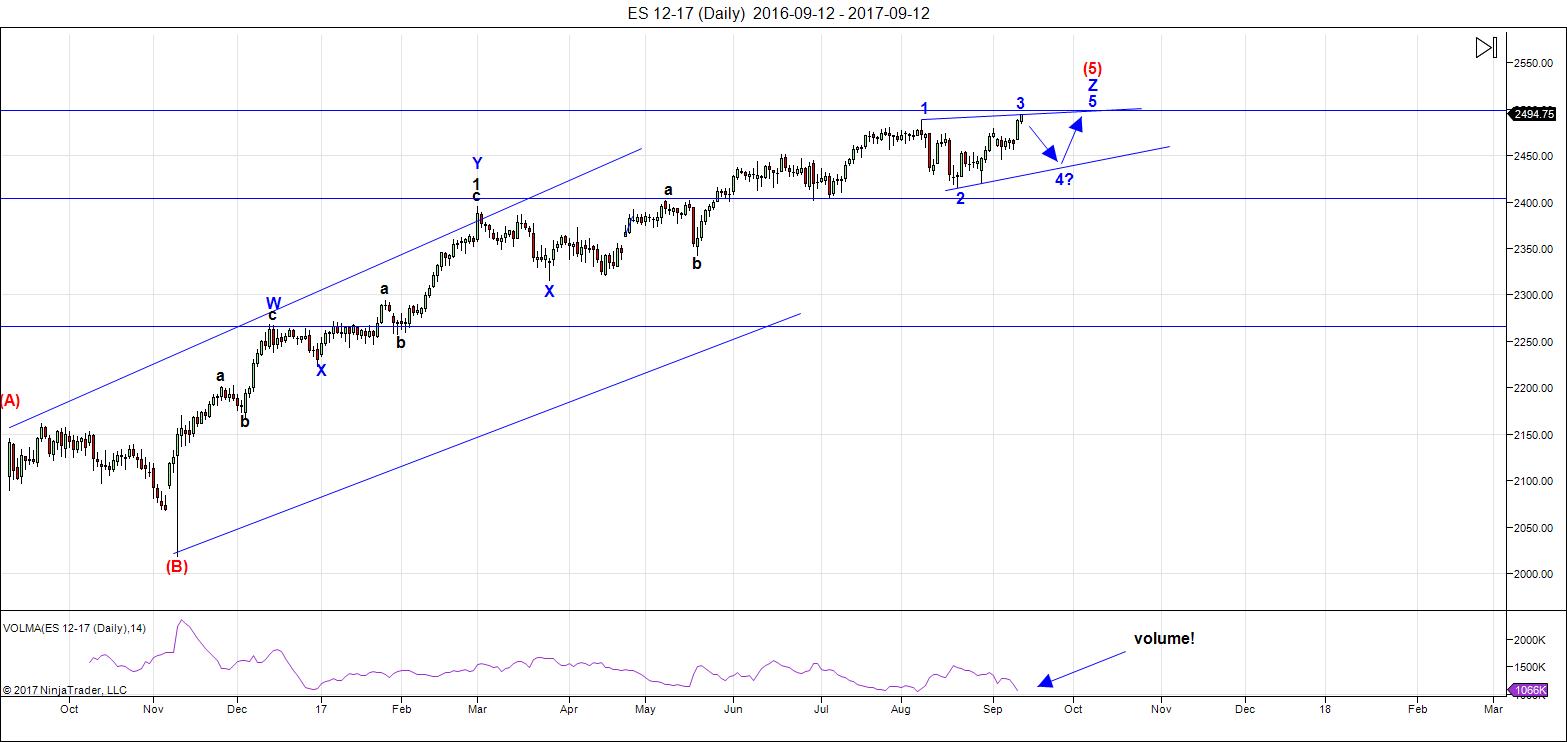
Above is the daily chart of ES (click to enlarge, as with any of my charts).
UPDATE: Sept. 12 — Today, we confirmed the ending diagonal in ES as the third wave exceeded the first wave high. This slightly changes the slope of the triangle. Otherwise, the pattern is similar to that of a contracting triangle.
With wave 3 in place, we can expect wave 4 down to a area around the lower trendline. Finally, we'll get a final fifth wave (in 3 waves) up to a final high. The fifth wave cannot be longer than the third wave. However, picking a final target for the fifth wave high will depend upon where the fourth wave down stops. I don't expect the final wave to be more than a few points about 2500 based upon the pattern so far.
Volume: Note that volume now expands with selling, but drops considerably when the market heads back up. This is yet another signal of an impending top. It will likely pick up a bit during the final wave to a new high but drop off suddenly towards the final top.
Summary: The final wave five in ES,NQ, and SPX is in progress. We have an ending diagonal confirmed with a fourth wave down still to complete (then look for a final fifth of fifth wave up to a new high to complete the 500 year bull market).
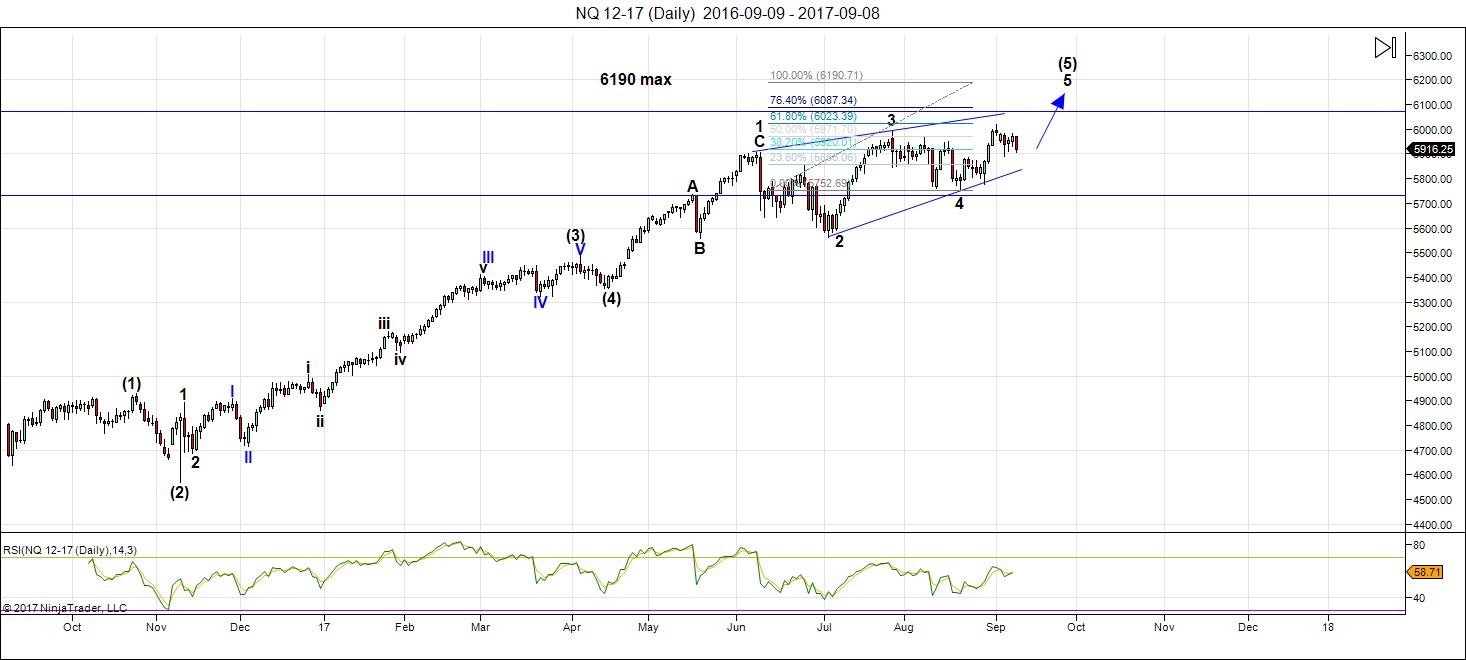
Above is the daily chart of NQ (Nasdaq futures) to give you the prognosis for the "tech" side of the equation. We have an ending diagonal in the final stages, requiring a final rally in the balance of a fifth wave.
Being an ending diagonal, the fifth wave cannot be longer than the third wave, which puts the maximum level for this final wave of the 500 year rally at 6190.
______________________________________
Sign up for: The Chart Show
Wednesday, September 20 at 1:00 pm EST (US market time)

The Chart Show is a one hour webinar in which Peter Temple provides the Elliott Wave analysis in real time for the US market, gold, silver, oil, major USD currency pairs, and more. You won't find a more accurate or comprehensive market prediction anywhere for this price.
Get caught up on the market from an Elliott Wave perspective. You’ll also get Andy Pancholi cycle turn dates for the SP500 for the balance of the current month. There’ll be a Q&A session during and at the end of the webinar and the possibility (depending on time) of taking requests.
All registrants will receive the video playback of the webinar, so even if you miss it, you’ll be sent the full video replay within about an hour of its conclusion. For more information and to sign up, click here.


Thanks Peter
You have given me a few things to consider going forward in regards to Sunspots .
Your quote near the top of your post of Dr wheeler made me think of something .
It’s to soon to comment yet you got my attention .
Thank you
Peter T,
I usually skip over articles predicting “global warming”. However, I do always try to read your commentary. Is it safe to say you don’t align yourself with the people who do?
My video on Global Cooling is here: https://worldcyclesinstitute.com/global-cooling/
Peter, very interesting but controversial. Regardless, I an neither an astrologist or geologist. But I am a medium term investor/ trader. I have been following for about six months and have yet to see any validation. Now that your “d” wave of your triangle has been surpassed to the upside, is your “e” wave complete or do you have a plan “B” ? Any revised explanation of your views would be nice instead of having to wait for next weeks write up.
I know … empirical science and history. Highly controversial in this day and age(!) Thankfully, I was educated a long time ago.
I post in the free area once a week, and sometimes I comment if there’s an extraordinary event. My Trader’s Gold subscribers get nightly videos, comments, charts, etc and they’re always up-to-date. There’s also the Chart Show on Wednesdays.
No need for a plan b until something breaks. If you know anything about contracting triangles, you know the D wave, which we’re still in, defines the trendline.
In any event, I provide full refunds in the free blog area, no questions asked.
Thank you for providing the link! I enjoyed that!
The rally today is most likely helped by the solar storm of a few days ago.
I have noticed this correlation many times which I why I noted last week it would hit Sunday
Joe, if I recall you said usually 39 hours after a solar storm usually ends up being POSITIVE for the markets?
If ES gets above 2489, it will have morphed back into my original call of an ending diagonal, which will change very little in terms of the overall path. However, it will mean two things: 1) we’re much closer to a final top and 2) we will have an upper limit to the fifth and final wave, which I much prefer.
This would align the wave structure with NDX. Volume again declined on this manic move higher today. There was an air of desperation about it that suggests to me that we are quite close. Price also hitting upper B band. I am glad I held onto my hedging bullish diamond put spreads that I was really tempted to close last Friday. I am now looking for a clean slice through the 50 day SMA on the next move down to give a powerful signal that that’s all she wrote!! That target is now at 2546.26 so the previous contested area of around 2470 should not even act as a speed bump. If price hangs up in that area I would be inclined to be more bullish short to intermediate term… 🙂
Verne,
I think you meant 2456 not 2546…
I did indeed! Thanks! 🙂
PALS this week:
Phase: post Full Moon, bullish
Distance: perigee week (closest distance), bullish
Declination: northern hemisphere all week, bullish
Seasonals: bullish until tomorrow, bearish Wed to Friday
Summary: Expect market to continue higher this week into Friday.
Valley,
Did you buy anything or waiting for sell off to get in.
One of Ganns rules, Never buy on the 3rd day of a trend in the markets.
Bill, seems about 50/50 bet, given the seasonals of September are almost always negative.
Peter, I do not know what is happening on my cell phone. Corrine name came up with her email on my cell phone for sending messages to your blog. I have NO IDEA whom she is.
Thanks for this. I’ve flagged it. There’s something going on there. I’ll keep my eye on it.
Testing
Peter
Your quote from Dr wheeler about the sun spot cycle
Becoming 8 years is what caught my attention .
Also the rising number of spots as it got cooler I questioned
Yet I won’t argue it .
We have had 8 years since the last sunspot cycle low
And while I’m not convinced the cycle has more to go that is what
Caught my attention the most . A few days ago I caught up my
Sunspot data and I asked myself did we just see a cycle low ?
How could that be ? The reason I asked was because the recent
Spike in sunspots broke above the moving average I use and
Yet a rise is expected into October before turning back down
If the correlation to the Dalton minimum still stands .
As I mentioned above its to soon to comment or assume that
But then I read your quote from Dr wheeler and think maybe ?
I would find it very odd at this juncture since we have yet to see
A series of zero sunspot days for any length of time .
Anyways I’ll keep Dr wheelers work in mind and since you also
Referenced his book I’ll see if I can find it .
Something I did come across the other day was an article
From 1967 I think where they showed a 43 years warming and cooling
Cycle . Back then the call was for 43 more years of cooling
Which was obviously wrong yet I felt the argument at the time
Made sense . Also the 43 year time frames are worth
Further research since 43 86 172 344 516 etc…
I’m starting to wonder if 516 years has a half cycle in it .
I can’t explain it but curious if there is one . Hence the 516
Year cycle would not be easily broken into even cycles
Of 43 years which would help explain the error in the article .
wheeler’s book is listed in my recommended books list on the site. It’s hard to find and you have to go with second hand copies from third parties. But it’s a book you’d enjoy.
Dwl
Yes , that is what I have noticed more time then not .
After a very large solar storm when I see the red bars
On the site I use ( don’t have the link in front of me yet
I posted it on prior thread ) . When I see those strong storms
I expect a larger than usual rally about 39 hours after the solar
Storm began . It does not always work and I have not done
Any real statistics on this but I’ll say its over 80% of the time
You get a rally and rarely get a decline .
That said it’s a very short term signal so I would not
Assume anything more to it at this point .
Consider that solar storm effect as in the past and what
Ever happens going forward is something else .
Yes, Joe, I think you’re talking about this site: http://www.n3kl.org/sun/noaa.html
It’d be interesting if you could track it haha. Obviously, you mentioned what happens if you get a storm on say a Friday. 39 hours would be over weekend so Monday’s trading may be unaffected?
Proton flux still elevated on Solarham.com.
Peter T,
The ES futures went above your 2489 level…So the Ending Diagonal is back on the table, right?
Technically not until this wave makes a new high, but that looks like where it’s going. NYSE went to a new high, so it would be odd that SPX doesn’t, too.
Great site and post!
One thing though that you have failed to mention in any posts is the lack of retail participation as although i too expect a huge decline just like 1987 or even a multi year one like 1929 how can these take place when retail is not in this market unlike all the other times the market cracked?
Or is it that this 500 year cycle is so different that retail “fuel” is not needed to propel us lower.
Thanks again
“Finally the Contrarian Warning from Small Investors” – September 10, 2017
https://wolfstreet.com/2017/09/10/small-investor-optimism-about-stocks-hits-record-of-jan-2000-just-before-dot-com-crash/
Peter T,
Thank you very much for your blog again. Tom’s energy chart has a high Sep. 11 then a choppy down to the 16th? I can’t recall if anyone flagged the 15th but I’m circling it now just in case it may turn out like July 27th, a swing high and low.
The current move up is probably part of a corrective expanded flat and is going to ttap a lot of traders who do not recognize this possibility. B waves of expanded flats can make a new high beyond the start of the A wave so in this instance we could
get a new ATH high in a corrective wave. EWI’s consistent and repeated failure to properly identify this pattern in my view has been the biggest single cause for their loosing an awful lot of money for their subscribers. We should head back down to around 2430.
On second thought, and second look, the indices are now ALL looking very ending diagonal-ish to me too! 🙂
Peter T,
Can we expect you to give “details” on the Ending Diagonal that you see in your weekly Chart Show?
As I always do, yes. And all the other assets on the list.
https://invst.ly/54ej4
be warned!
better snap!! …[cough]… BE WARNED!!! [ahem…] https://invst.ly/54el9
I will be on the other side of your trade, If we do reach 2503 es I will take off 5% off of my 40% long position. I am not expecting any more than a 12 % correction in the over all markets. If it goes deeper, great. I will just get a early Christmas sale. I do not expect any deep correction until later this month. My new model suggest a high in the markets on Sept 22nd.
All the best every one.
“young man – you get yourself back here right pronto!!”
why i outta take you over my knee right here – right now!!! there is a “word” for taking the other side of the “TRADE” – its called “blasphemy”…. its like talking in tongues…. or better yet – its like substituting prunes for the “raisins” in a RAISIN OATMEAL COOKIE – its the devil’s language!!!! now repent – dave – REPENT!!!!
LOL, I will repent after Sept 22nd
You are both going to loose money if you are not nimble. Directional trades in this market has become a fool’s game as the short term trend is whipsawing back and forth every few days, so frustrating both bulls and bears. The way to trade the current market is to scalp it, harvesting profits as soon as they materialize, which in many cases can be mere hours. I think this will continue until we get a decisive break from the larger rising wedge, either in a final wave to the upside, or a move down to conclude the correction. The upper and lower boundary lines of the wedge are clearly containing price action and it looks like a move down to to around 2450 is next on the agenda.
Verne, with all due respect you are incorrect with your assessment with my trading. I have two accounts, one large long term account. Which is at 40% long. It is at the lowest level in many years in terms of money being invested in the markets. I am usually at 85% invested. One frequent trading account for going short and long. I do not trade my long term account, except for rebalancing and taking 10% off my profits each year. I have always maintained a large long position in the markets since 2004 . This prevents me from getting whip sawed. My short term account is what I call my entertainment account, it is for fun. On my short term account, I am up approx. 14 % for the year in US dollars. Unfortunately in my home country currency ( Canada) I am only up approx. 4 – 5% which is not very good. For 2017 thus far, has been dismal in my long term and short term account. But yet far above bank rates.
Dwl
Yes that is the ink I look at .
I have watched it for over 10 years but never did any statistics
But I have considered doing so . I’d say it did effect Sundays overnight session
Which carried over into Monday . After Monday though ( yesterday ) there is nothing
More to it as I see it .( I only pay attention to the 39 hours after and a day or so )
Since it was Friday I consider it now in the past .
Valley
Arch Crawford write something about proton flux and the other ( can’t remember it off top of me head )
I don’t remember what he said yet it was in regards to either the spike before the crash in 1987
Or it had to do with the crash . I dug into it for a while yet never had any luck finding a contestant
To trade off of.
Having confirmed the ending diagonal today in ES, I’ve updated the chart in the blog post, and updated my notes below it.
Valley
You can read what I’m talking about here .
I originally read it or heard it somewhere else
But food for thought .
https://www.scribd.com/mobile/document/251220751/Crawford-A-Interview#
Makes sense that proton flux would have real effect on peoples attitudes.
Thanks for the update Peter .
I still have a few stocks to let go of
Joe
Also I’ll find Dr wheelers book , second hand reads just as well
As first hand
SPX is notorious for its perfectly normal looking triangles morphing suddenly into something else, usually double combinations or double zig zags. In this case it does indeed look like we are in an ending diagonal. It is actually going to be much easier to trade if that is what we have. I will be using the last few points up to get positioned via put credit spreads galore! 🙂
Gann’s Square of 9 can deliver some interesting turning points in the S&P500.
Recent top of 2491 drew attention courtesy of its alignment to 1929 (think year – big top). 90 degrees away is 1973 (big top) & another 90 degrees to 2017 (hopefully big top?). Also 49×49=2401+90=2491 and 2+4+9+1=16=7 and 7×7=49…. but now market higher, which doesn’t eliminate the 2017 big top scenario, but requires price rework.
Could 2520 be peak and the completion of Elliot Wave ‘big 5’?
2520 is 2 rotations from 2134 (May 2015 top) or 1 rotation around from 2322 (March 2017 low).
2520 sits 90 degrees from 216 (Oct 1987 crash low), 768 (Oct 2002 bottom) and 1576 (Oct 2007 top). That would be a squaring of 30y, 15y and 10y timings.
We are now 30 years or 360 months from 1987 Top…. 360 x 7 = 2520
2+5+2+0=9 and 9×9=81…. 81×81=6561 less 2520 = 4041 (40 + 41 = 81)
25+20=45…. 45×45=2025 (Hmmm or 2520)
2520 weeks ago = May 1969 = second lower top at 106 then market fell to 69 in 12mths (-35%).
2520 months ago (210ys) = Sept 1807 … not sure what happened then?
Just some Gann numbers, only food for thought should we see Peter’s proposed ending diagonal exhibit a throw-over towards 2520 : )
….and…. 11th Oct 2007 top plus 2520 trading days lands on 16th Oct 2017
Wayne,
Thank for your post! I have practically zero understanding of Gann and his work.
I am mentally processing the numbers you presented. In your 2nd paragraph you have “2+4+9+1=16=7″….I understand how you get to “16” but how do derive the “7”?
Is the number “7” important in Gann’s work?
Then where you arrive 360 months…You then multiply 360 x “7” to get 2520! There is that numeral “7” again!
It seems that I have seen the term “Gann Squared”…Is that possibly why you multiplied 7 x 7 then later multiplied 9 x 9…and then 81 x 81? Any explanation would be appreciated.
Wayne, there is a person who post on here occasionally named Peter G who seems to have a lot of historical data…Maybe he can tell us about what happened in September 1807!
Wayne,
Just dawned on me that your numeral “16”… I asked about could be further written as “1 + 6” or “7”…
That’s right Ed, basically numerology with 1+6 deriving one of Gann’s Master Numbers, 7. Other Master Numbers include 3, 5, 9 & 12. The squares of these numbers important (12×12=144), and even derivatives 3×12=36 which is 6 squared. 49 calendar or trade days is often mentioned as his death zone so watching those levels off swing lows or highs.
I’ve become a Gann tragic over the years but like to balance with other methods as easy to bamboozle oneself with the mass of numbers, or should I say maths. Admire the Fibonacci sequence as well, but again easy to tie yourself up in knots with overload.
Plenty of Gann books out there, or world of internet.
Lets hope we can combine Elliot Wave, Gann & Fibonacci with success….
Peter G,
Wayne posted his Gann analysis and had a date September 1807…Does that date have any significance? You seem to have a lot of historical data or at least I perceived that from some of your previous posts.
Ed, I just saw your post. I an out of country in Europe and only watching with one eye. I will attempt to respond to you when I return in a few days…I do have charts back to late 1700s, courtesy of the Foundation for the Study of Cycles data. How was the 1807 date mentioned?
Peter G,
It was mentioned by Wayne on this site on 8/13/17 at 3:13am. It was in discussion concerning Gann analysis. It had to do with 2520 months ago…which would have been September 1807! Wayne did not know what happened in that time frame but seemed to believe that something did.
I would encourage you to read Wayne’s post! Thank you for responding!
There is something going on with aol.com. For the past week, it has been impossible for me to communicate with any aol.com email address … and that’s from multiple sites, different urls, even with a gmail account.
So, Ed, if you’re reading this, I can’t return an email to you. I’m trying to but running out of ideas. I may have to get someone else to email you a message. It seems to be an aol.com email address and only within the past week or so.
Peter you have my e mail. If you wish, you can send it to me. I will than forward it to ED.
Thanks, Dave, I just sent you an email.
Just sent it Peter. Ed please confirm you received the e mail.
I have communicated with Peter T and very thing is fine! Thanks Dave!
Andy Pancholi just sent out another general market alert. He observes that the histogram he monitors to signal market trend changes has just printed the biggest spike he has ever seen in 30 years of market analysis. Investor optimism is also at seventeen year highs, market price to sales ratio is at historic extremes. I readily admit this market has continued to advance far longer and higher than I, and probably many others, had anticipated. I also strongly suspect to the same degree all the current bulls will be surprised by the duration and distance we experience to the downside. The confident pronouncements about future market upside, considering the context in which these assertions are occurring is something I will probably be wondering about for the remainder of my sunrises on this spinning globe. The hubris of the normalcy bias is indeed commensurate with a 500 year cycle top. I have now made plans to remove all my funds from my various brokerage accounts. I will continue to invest and trade only with funds that I can afford to loose. I know for many that will seem an extreme decision. I can already hear the plaintive wails of all the current giddy bulls, lamenting the enormity of how they missed what was so plainly evident to anyone who bothered to look….all the best everyone….
Verne, are where are you going to park your money ? If you live in the states, are the brokerage accounts not federally insured up to a maximum ? Here in Canada, are banks and credit unions are Federally insured up to $ 100,000 for each account. The brokerage accounts in a short term cash account are also federally insured up to a minimum $ 100,000. This I will have to investigate further on. Peter do you know what amounts are insured for?
Brokerage accounts ?
I know CFIC has 0.36% of what is required to fund 100K in Canadian accounts. In the US bank accounts are insured for $250K but there’s even less money in insurance. I’ve read the interactivebrokers data on this, but can’t remember. It’s a lot more, but then I have to wonder where the money is going to come from. Insurance isn’t going to mean much going forward.
Thanks Peter !
When I get a chance, I’ll go look up the IB contract.
Exactly!!
The safest banks are those owned by Muslim countries.
Certainly not in US banks. Believe it or not, you can still get stock certificates from some US companies. There are a few mining companies that I plan to hold long term, one of which actually pays its dividends in the the physical metal, as well as short term Treasuries. I continue to accumulate Silver as I have for many years now, and I will be holding in my possession (in a safe place not my house or a bank deposit box) a significant amount of cash. Certain assets held outside the US are not subject to the onerous FATCA reporting thuggery thankfully! 🙂
The what i call non puetz cycle and its inverted >
friday/monday a short term high due yet this cycles
ends sept 29-oct 8th.
what ever comes after is something else .
the before , posted prior to aug 21 solar eclipse .
https://imgur.com/tQTiTQq
and the same chart updated to today .
as always keep it as food for thought >
i cannot fill in the details because of work>
https://imgur.com/oBUKF1E
Joe,
When you have time…Could you add a little “color” to your last post? Is what you posted yesterday still moving toward the October peak that you have previously written about?
You and Peter T seem to be very closely aligned in your expectations!
Over the last 5 years the Dow has been down in the week after triple witching in the third quarter b/w 737 and 69 points In the last 25 years, only 5 years positive.
Peter
you might want to look at the monthly $BKX chart .
not sure i want to call it a developing triangle wave 4 yet i think that
may be the case .
ED
yes i’m thinking of an Oct high but keep in mind im watching
many cycles and oct is just one of several .
dec 1 st is another and as peter has noted several times
you want to see % waves down followed by 3 waves up .
i have another 3 weeks until ill be able to follow the markets
closer from home and im still putting a few pieces together
in regards to that dec 1 cycle high .
the oct high i would expect to dove tail with the full moon
in early oct yet i cannot state a convincing reason for that
other than its the full moon 6 weeks after the solar eclipse .
another thing i looked at tonight and is statistical gives 36 -40
trade days to go . that though i cannot swear by yet ill dig into that
further when i have time .
quick reference for you though into what im digging into .
pardon the cap lock ( key board stuck and i need @ hands )
APRIL 21 2009 TO APRIL 23 2010
JULY 2 2010 TO JULY 6 2011
OCT 4 2011 TO OCT 5 2012
DEC 31 2012 TO JAN 3 2014
YEARS 2014-2015 A FAILURE ( TIME WISE IT TOOK LONGER )
NOV 4 2016 BEST STARTING POINT
NOV 4 2016 PLUS 252-255 TRADE DAYS
LEAVES MAXIMUM 40 TRADE DAYS TO GO .
I DON’T HAVE THE DATE JUST THE CORRELATION
TO PREVIOUS RALLIES , HOW THAT WORKS OUT
IS TOUGH TO SAY SINCE THE CORRELATION BEGAN FAILING
THROUGH OUT 2014-2015 AND WAS A SIDEWAYS MARKET
FOR THE MOST PART .
sorry for cap locks yet needed to type and bed time .
6 hours to sleep then back up for 6 hours on shift
then 6 hours off shift ( more like 5 hours sleep lol )
sox index might be a B wave of a triangle
NVDA keeps punching 170 yet look at today’s move
170 then drop 171 then drop 172 then drop
and back below 170 by close .
NYA not sure on yet earlier in the year i noted a head and shoulders
bottom with upside towards 13000 . that needs to be refined
and pinned down .
im not that focused on timing at the moment and more
focused on exit strategies .
oh and keep an eye on Germany elections , only noting that
because of Armstrong,
usa dollar index is either at or very close to Peters target
Florida just got hit ,Texas got hit, Oregon is burning
OH lastly EQUIFAX . i had a friend look this up so something
to research . Apparently you can get your social security number changed.
you can change your credit card numbers . you can change your bank account
or brokerage account . KIND OF A PAIN YET IT CAN BE DONE .
HOPEFULLY we can change our drivers license numbers .
my intent is to blame identity theft as well as Equifax.
next years intent to change everything and have all new numbers
not sure ill update the credit agencies though .
i consider it a window of opportunity to really change everything up
and while i cant hide i sure can mess with the system .
night
SOX – at a double top. May very well be done (a few points left to go). NVDA in an ending diagonal -looks like done, although it could do another up/down – we want to see us below the lower trendline. BKX – either a final 4th wave triangle or we’re just heading for a double top at 100.
Tops and potential tops all over this place this weekend, but there’s still an up/down in the main market yet to go.
I mentioned a while back about a dream I had about crowds of people in the streets and a currency crisis. This may be tied to this coming event on Oct. 1st
https://www.reuters.com/article/us-spain-politics-catalonia/catalonia-parliament-votes-for-oct-1-referendum-on-split-from-spain-idUSKCN1BH0QS
Sold 1/2 of my position in NVDA at 179.70
Just 30 cents below my 180 target .
180-194 I still consider the resistance range for
A top . Keeping 1/2 for now yet not sure that was smart .
That leaves roughly 35% long stocks to 65% cash .
PALS next week:
Seasonals: very negative next week and following
Phase: positive early in week, negative from Wednesday on for 2 weeks
Distance: negative next two weeks
Declination: very positive until late in week, then weak following week.
Summary: looking for slight positive market move into Wednesday, followed by several weeks of selling and likely selling may continue into late October.
Valley and Tom
I tend to agree with both of you yet for my own different reasons .
My only concern at this point is the mars Uranus opposition on Dec 1
Should be a high . A lower swing high is preferred yet also in December
We get the Venus mercury Sun conjunction which triggers the technical
Venus bear cycle which will be in effect following the mars Uranus bear cycle .
Both those cycles combined call for lows of sorts from Oct 2018 to Feb 2019.
To put it a different way . A possible stall in the market or higher prices
For 2-3 months vs downside action for over a year. Clearly the risk reward
Over the next year has a downward bias . The shorter term of the next month or 3
Is open for discussion . The last piece of the Venus mercury puzzle has to do with Venus
Becoming an evening star . At the conjunction with the sun Venus will be to close to the sun for
Observation as it moves away from the sun and is observable the stock market should accelerate
Downwards . If this also happens with the mars Uranus sub cycles pointing down it gets ugly .
As I noted a few days ago. For me it’s exit strategies at this point and since we’re heading out
At 230 am I’ll probably have limited phone reception by Monday- Tuesday .
I can’t short term trade with out data lol. I’ll be glad to be home in early October though .
A high Friday- Monday was my thoughts based on the non puetz cycle ( puetz work completely
Just my understanding it from my own research ) the highs might be in as if today yet the cycle
Does not end until 6 days before to 3 days after the full moon which is 6 weeks after the solar eclipse .
Sept 29-Oct 8 th . I’d watch the full moon 🙂 . The momentum move though is the new moon . So I’d watch
Tuesday or Wednesday ( fits with valley )
Agree Venus positions especially conjunctions are major energetic effectors. Market usually sells of into these. Next one is in early 2017, when Venus will become the evening star.
Peter
Thank you for your insight 🙂
Peter g
Bitcoin ( I don’t follow it or trade it )
It might have fit into what you were considering in regards
To the puetz cycle . Will be interesting going forward what
The crypto currencies do .
No opinion by me on that .
Joe,,
Your insight is extraordinary! I have been hanging around this site for a couple of years…and I must say I did not greet your posts with enthusiasm but your knowledge has won me over!
I use to say… “Who does this guy think he is?” But the ultimate compliment is you have been more right than anyone I am fortunate to read! You are a wonderful compliment to Peter T. I am quite sure I express the unspoken feelings of many on this site!
I am also quite sure that your insights are accompanied by many “battle scars”!
My humble opinion is that you attain “good judgment” by having a lot of “bad judgment” over the years. Surely you must be 80-90 years in age. Ha
Looking forward to your next post!
Peter thank you for the update. Is it possible BABA and BIDU are also in an ending diagonal pattern?
Joe, congrats on NVDA!!
I’m very intrigued with the period you cited above.
Oct 1 – Catalonia election (news shared by Tom)
Sep. 27 – Kaspersky has a hearing before Congress to address concerns his software is spying for the Kremlin. http://www.abc.net.au/news/2017-09-14/kaspersky-internet-security-software-banned-by-us-government/8943782
Oct. 3 – Equifax CEO hearing
BIDU yes, not seeing it in BABA.
Peter, thank you very much!
Hi Peter, what if they keep inching up ES a couple points per day to like 2015 or so?
Will that put us back in 3rd wave or still in 4th wave?
Regards,
Charles
Charles,
15 points wouldn’t change anything. We’re in the final fifth wave. No, you can’t back up.
Thank You for all your work Peter.
It is amazing how ES last tick was 2500 on the nose
Almost eerie!
The more I hear folk talking about how the recent price action is a prelude to an extended bull run higher, the more I begin to wonder if we are not in fact looking at a final wave up. I was quite convinced that the market needed another zig zag down to complete a fourth wave but I am no longer convinced that we are in a corrective wave. On balance volume had a bullish break higher this Friday and some are saying it is due to triple witching but the fact is that the entire entire year has gone without the mildest of corrections and we are still waiting. My conclusion is that what comes next is not a correction, but the end of a long bull market and the advent of the biggest bear we have seen in quite some time. I expect DJI to hit the 1.618 fib level from the 2000 low and 2007 high at around 22496.00 before the turn. SPX has already slightly exceeded it…
You know Verne, I have been bearish this market since 2008. Just yesterday I was thinking It is not coming down. Especially after NK missile. Then I read Peter’s post that this is the 5th wave.
Believe it or not Verne, I was just about to place some Dec calls on NVDA. Then I thought “meh” I’ll wait till Monday to see if I get a candle over candle. Then I come here after close and Peter says NVDA is just about done.
Saved the day.
Cheers,
I hear ya Charles. No one trading this market is wise to make cock-sure assertions about what comes next. We have seen those negated far too often to not know better, so we certainly could see more upside. I happen to be holding some short term SPY 249.50 calls expiring next week just in case I am wrong about the immediate term. Having said that, unless the banksters have been able to successfully abrogate the principle of reversion to the mean, I think this market’s upside potential in limited. As I look at the market’s price action, to be honest, my fear of being wrong on my bearish outlook is far less than my fear of the hubris of men who think they have the power undo the business cycle and rescind the course of Nature. They way they have been relentlessly buying every attempt of the market to undergo a normal correction displays a kind of arrogant presumption that is nothing short of stunning. So far they still have the sentiment of the crowd to aid them in this endeavor and they continue to be successful. Crowd sentiment has become completely divorced from reality and this is one of the classic symptoms of a bubble top. I am personally convinced the market turn is going to be ushered in by some sort of black swan event. Clearly mere economic facts in the form of low market volume, tepid GDP growth, manufactured employment data, corporate and government debts that is clearly un-repayable, incredibly bloated P/E and price to sale ratios, the threat of nuclear war, etc etc., has done little to jolt market participants back to reality. This in itself makes a cogent argument that what finally triggers a reversal is going to have to be something more spectacular than all of the above. Tim Knight said something recently that I find truly scary – he said that even if a nuke went off the market would still go up. Now of course I knew he said that tongue-in -cheek, but I sometimes wonder if those are not going to prove to be prophetic words. I do seriously doubt the outcome of such an event would be as he surmises, intended irony notwithstanding. Trade safely.
Looking back at Past Sept. Highs. 2009=9/23 2011= 9/16 2013= 9/19 2014= 9/19 2015= 9/17 2016= 9/22 My cycle high is 21st – 22nd for Sept
A new blog post is live at: https://worldcyclesinstitute.com/time-for-a-small-dose-of-reality/
This website is for educational purposes relating to Elliott Wave, natural cycles, and the Quantum Revolution (Great Awakening). I welcome questions or comments about any of these subjects. Due to a heavy schedule, I may not have the time to answer questions that relate to my area of expertise.
I reserve the right to remove any comment that is deemed negative, is unhelpful, or off-topic. Such comments may be removed.
Want to comment? You need to be logged in to comment. You can register here.