
Like Herding Cats
 Major tops are difficult things to analyze. They’re open to volatility (they’re always low volume affairs) and there’s usually non-confirmation between indices. In other words, some indices can trace out different patterns than others. However, they all need to eventually top in their own ways.
It’s a bit like herding cats, as these different indices may not move together to their targets, but will end up reaching them to finish their respective patterns one way or another.
A case in point for non-confirmations is the situation I’m seeing with the NDX and the SP500: They have different wave structures.
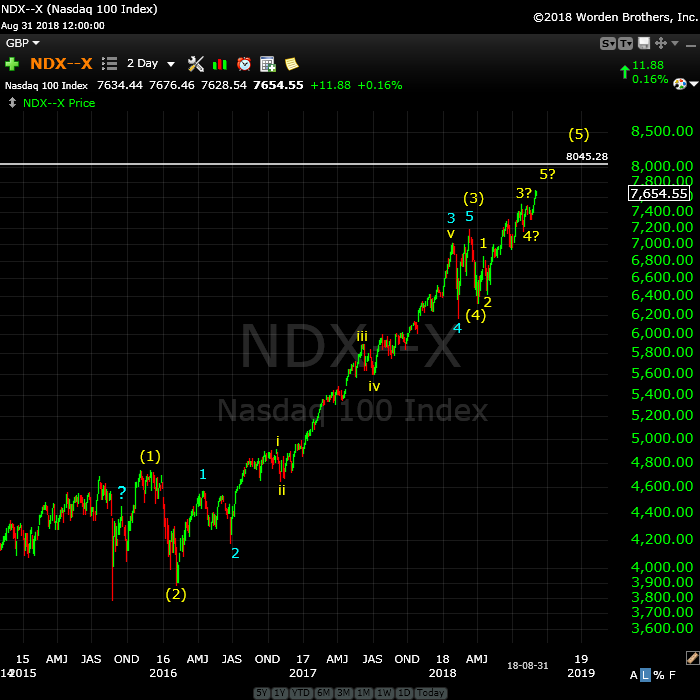
Above is the two day chart of the NDX (Nasdaq 100).
This final wave up (depicted in this chart) looks to be impulsive. This is an almost classic impulsive structure, with one exception: Wave yellow (1) has a three wave move up (identified by the blue question mark). This tells me the wave is in three waves, or we have a 1-2, 1-2 arrangement.
A three wave move would negate the impulsive wave. However, that seems to me to be somewhat unrealistic due to the otherwise textbook look to the wave. The fibonacci measurements also suggest an impulsive wave.
In Elliott Wave, you can’t ignore a wave (why many pretenders often have improper counts); every wave has to be counted. So we need to pay attention to the possibility we’ll see an additional 4th/5th wave combination at the top end of the entire move (as waves are typically symmetrical, in that they’ll have to same number of waves at the bottom as at the top).
What this means is that we may have an additional, small four-five combination still to go at the top end. That’s a bit of a wild card.
Otherwise, we’re nearing the top of the final fifth wave. My measurements suggest the area of 8045 for a potential top.
In the shorter term, we may be finishing the third wave of the fifth and require a larger fourth wave down and then a fifth wave up to a new high to finish the 500 year rally. There could be a little surprise, as well, based up on that additional small wave that makes up the current yellow (1) wave.
The fourth wave usually drops to the previous fourth wave (of one lesser degree of trend), so this suggests a wave down to the area of 6950 before a final fifth wave up to the ultimate new high.
The SP500 has a different wave pattern, however (the differences are subtle, if you’re not highly conversant in the Elliott Wave Principle.
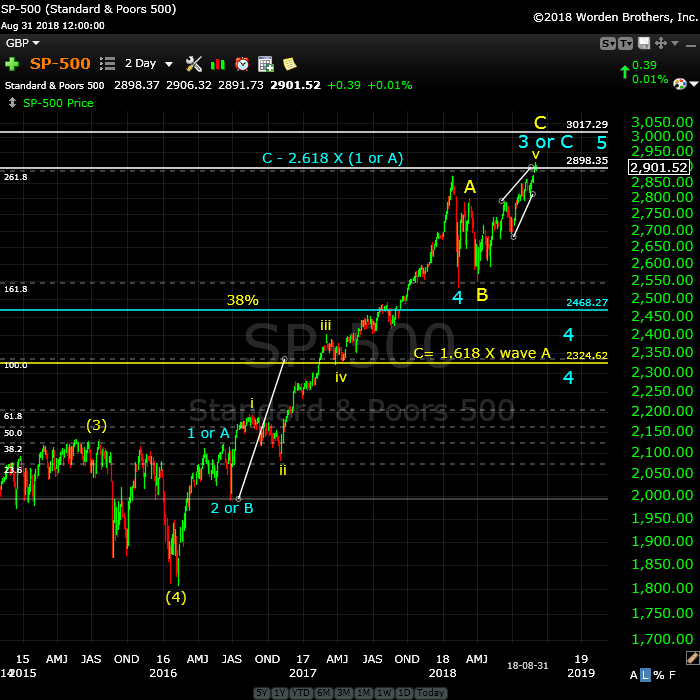
Above is the two day chart of the SP500 (similar to the chart of NDX).
This wave up appears to be a corrective five-waver. The fibonacci measurements also suggest we have a corrective wave here, and, of course, I’ve labelled the entire wave up from 2009 as corrective (in previous blog posts).
The features that identify this wave up as corrective are:
- the measurement of the subwaves. If you measure wave blue “1 or A,” you’ll find that the wave up from the bottom of blue “1 or B’ is exactly 2.618 X that A wave. That’s a typical corrective measurement (while the NDX has measured out differently—for an impulsive pattern that is almost complete).
- wave blue “1 or A” appears to be a zigzag, a wave in three waves
- wave yellow “i” does not appear to be an impulsive wave
So the SP500 and NDX have completely different patterns playing out at the top. They will likely continue to move somewhat in step with each other but the patterns are expected to be quite different.
Summary
Both indices look like they have one more major wave to the downside and a final wave up to end the trend. However, the wave down for the SP500 looks like it may be much deeper than for the NDX.
While I believe we have a flat setting up in the SP500 (and ES), the NDX looks like it may have a fourth wave of an impulsive pattern to the downside as the next major move. This may limit downside of the SP500 (I don’t know), but it could lend creedence to the running flat idea (which is very rare, but must be considered going forward.
In any event, while we’re at a potential top, we need to display lots of caution in how these final waves play out. I don’t think we’re very far from a final high in either price or time. The market will be the ultimate judge and executioner, of course.
______________________________
Elliott Wave Basics
There are two types of Elliott wave patterns:
- Motive (or impulsive waves) which are “trend” waves.
- Corrective waves, which are “counter trend” waves.
Motive waves contain five distinct waves that move the market forward in a trend. Counter trend waves are in 3 waves and simply correct the trend.
All these patterns move at what we call multiple degrees of trend (in other words, the market is fractal, meaning there are smaller series of waves that move in the same patterns within the larger patterns). The keys to analyzing Elliott waves is being able to recognize the patterns and the “degree” of trend (or countertrend) that you’re working within.
Impulsive (motive) waves move in very distinct and reliable patterns of five waves. Subwaves of motive waves measure out to specific lengths (fibonacci ratios) very accurately. Motive waves are the easiest waves to trade. You find them in a trending market.
Waves 1, 3, and 5 of a motive wave pattern each contain 5 impulsive subwaves. Waves 2 and 4 are countertrend waves and move in 3 waves.
Countertrend waves move in 3 waves and always retrace to their start eventually. Counrtertrend (corrective waves) are typically in patterns — for example, a triangle, flat, or zigzag. Waves within those patterns can be difficult to predict, but the patterns themselves are very predictable.
Fibonacci ratios run all through the market. They determine the lengths of waves and provide entry and exit points. These measurements are really accurate in trending markets, but more difficult to identify in corrective markets (we’ve been in a corrective market in all the asset classes I cover since 2009).
To use Elliott wave analysis accurately, you must be able to recognize the difference between a trend wave (motive) and a countertrend wave (corrective). There’s very much more to proper Elliott wave analysis, but this gives you the basics.
____________________________
Registration for Commenting
Want to comment? You need to be logged in to comment. You can register here.
If you register, it protects your information. It also allows you to comment without filling in your information each time. Once you’re registered, simply go to the home page and click on the login link top right in order to log yourself in. Usually, you’ll be logged in for several days before needing to be logged in again.
______________________________
Problem receiving blog comment emails? Try whitelisting the address. More info.
______________________________
Have not had a losing week RW 2
Have not had a losing week …I have been with Peter almost a year. The only thing that matters is have I made money with his service. I think I have finally turned the corner using Peter’s EW. I have not had a losing week in the last 5 months. Thanks Peter, for your amazing amount of hard work. —RW |
Couldn’t be happier … KK 2
Couldn’t be happier …The analysis and insight you provide is simply amazing! I’ve been trading the futures and equity markets for well over thirty years and usually average around 5% monthly. Since joining your Traders Gold Service two months ago, that number has better than doubled. I couldn’t be happier.—KK |
Rise above the rest … SM 2
Rise above the rest …I have only ever met a few people who, in their chosen fields (astrology, medicine, music, martial arts, technical analysis), rise above all the rest and you are one of them…you have ‘the gift’…and that’s why I’m a Trader’s Gold member. —SM |
A true expert in Elliott Wave FL 2
A true expert in Elliott Wave …You are a true expert in EW analysis. What you provide is not available anywhere and is priceless. Subscription on your services is the best thing I have ever done. Many thanks for your effort to make me a better investor. I now have more trust in my investment decisions. I hope you will continue the excellent work! —FL |
Get an upper hand … JC 2
Get an upper hand in trading …Seeing all the different currency pairs and the wave structures and hearing you explain why this has to do that on a nightly bases gives one a upper hand when trading. Elliott Wave applies to all stock and indices and can be applied to any candlestick chart. If someone ask what you want for Christmas – Tell them a membership to Peter’s “Traders Gold!”—JC |
The best of them JL 2
The best of them …Last couple of years, I subscribed to several ‘market traders’. You are by far the best of them and the personal contact is awesome. Daily and daily updates are very well written! Besides your expertise in EW, I also like your cycles analysis. Best investment I ever made! —JL |
the real deal SM 2
The real deal …‘Educational, insightful and thorough market analysis for all levels of traders. It’s Elliott Wave at its best….Peter Temple is the real deal’ —SM |
Tops in your field DZ 2
Tops in your field …You are tops in your field. Tried to follow Elliot Wave international for years. They were always behind the market. After discovering you, I perceive that you are an expert in reading the waves, which puts you way ahead of the rest of your peers. And you can read the Waves like you are reading tomorrow’s financial section. I pray you stay healthy. —DZ |
The Market This Week
Here's the latest daily chart of ES (emini futures)
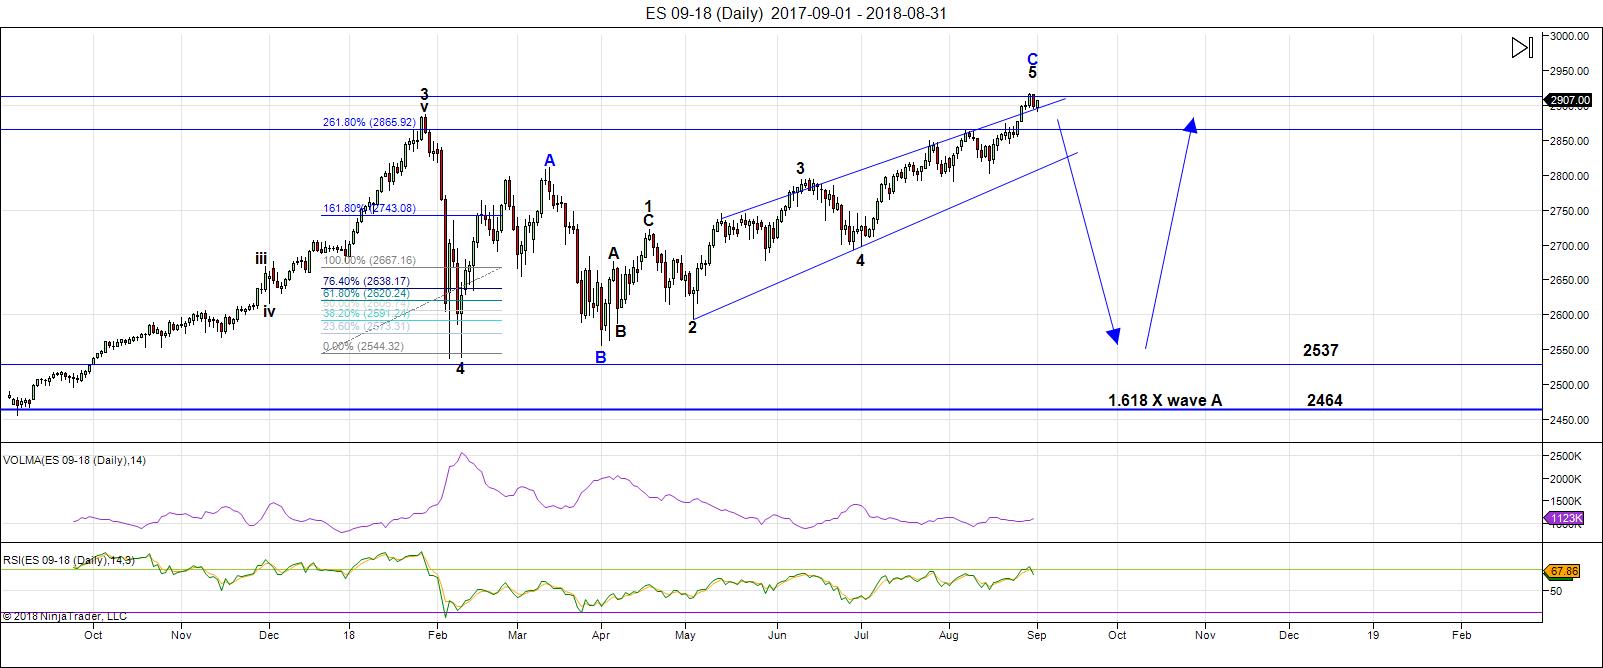
Above is the daily chart of ES (click to enlarge, as with any of my charts).
Small changes from last week. Because if the additional rise, the option of a regular flat has been negated.
My preference is for this unfolding fourth wave pattern is that of a expanded flat. A description of an expanded flat is here. However, technically, it could also be a running flat. At the present time, the B wave (that's the ABC wave up from about 2532) is longer than the A wave (marked as the 4th wave down from January 29, 2018). A regular flat registers as an expanded flat when the B wave is over 105% of the length of the A wave—ie, the B wave would need to reach above 2889, which is has done.
That means that the ES/SPX has multiple possibilities as to a target on the downside. Accuracy (in determining the most probable target) is going to depend upon both counting and measuring the waves to the downside. It's impossible to pick a downside target at this point in the process.
If we select all of wave 4 (on the chart—down from January 29) as the "A wave," then we're looking at an expanded flat. In that case, this outcome is the most probable:
- the C wave of a flat is typically 100 - 165% of the length of the A wave (so the target would be from 2532 - approx. 2360) - preliminary targets
There are other options:
- a running flat would trace out a C wave that is NOT longer than the A wave (in other words, it would not go to a new low). I regard this option as very low probability because it's extremely rare (I've only ever seen one of them). However, if NDX is tracing out a final impulsive pattern, its fourth wave should not be very deep, which may also restrict the length of the C wave in the SP500.
Summary: We're waiting for a top in a B wave, which will result in a C wave to a new low. My preference is that this structure represents an expanded flat, but there are other options. Once the c wave (down) is complete, expect a final fifth wave to a new high. That fifth wave up to a new high will be the end of the 500 year bull market.
___________________________
Trader's Gold Subscribers get a comprehensive view of the market, including hourly (and even smaller timeframes, when appropriate) on a daily basis. They also receive updates through the comments area. I provide only the daily timeframe for the free blog, as a "snapshot" of where the market currently trades and the next move on a weekly basis.
______________________________________
Sign up for: The Chart Show
Next Date: Wednesday, September 12 at 5:00 pm EST (US market time)

The Chart Show is a one hour webinar in which Peter Temple provides the Elliott Wave analysis in real time for the US market, gold, silver, oil, major USD currency pairs, and more. You won't find a more accurate or comprehensive market prediction anywhere for this price.
Get caught up on the market from an Elliott Wave perspective. You’ll also get Andy Pancholi cycle turn dates for the SP500 for the balance of the current month. There’ll be a Q&A session during and at the end of the webinar and the possibility (depending on time) of taking requests.
All registrants will receive the video playback of the webinar, so even if you miss it, you’ll be sent the full video replay within about an hour of its conclusion.


Peter t
I assume you meant 2950 as the previous wave 4 on spx.
Quick question though .
Just a thought . Does the NDX fit the description of an extended 5 th ?
Specifically I’m talking short term an extention from where your wave 3 ? Labeling is .
In other words waves 1 2 3 then . I’m probably doing a bad job explaining
Yet asking if that wave 3 ? Label could be minor wave I of wave 5 of wave 3 ?
I’m not sure if that would tie the spx count with the ndx and honestly I’m just
Thinking outside the box. You mentioned the possible 1 2 1 2 count so I’m just curious .
I don’t have the Elliot wave book with me to look up the extended wave counts yet
from memory ( don’t quote me ) I thought it a maybe . NDX only .
7 day ride up the hill ( north bound ) and can’t wait to further some research.
I can’t state anything indicator wise yet I’d be suprised if they are not looking a bit stretched .
Timing wise from my point of view is running out so I’ll keep my bearish bias yet honestly
I’m missing something .
Your updates are apreaciated and help me stay in tune .
Thank you for your time and efforts .
Joe
Joe,
2950 as opposed to what? I can’t find the reference I made to “wave 4 on spx” so you’re going to have to be more specific.
In terms of your question on NDX, I’m lost. Can you give me a timeframe, or otherwise be more specific?
Ooops my own typo : I meant I think you meant 2750 as previous 4
Ok, I’m thinking you meant 6950 on ndx
I ‘re read .
Anyways thanks
Joe
With Sir Peters new upside targets im adding to my longs in the am. Though this bull is a little long in the tooth im still planning for the Dow to make a new high before the next leg down. Rock on!
Captain Pete, any new revelations on whether this recent dollar dip was the beginning of an impulsive Wave 1 down or just another 3 wave fake out? If you deem the answer too proprietary, just ignore me like most women do.
Assuming there is a correlation (although not implying causation) between Trump’s popularity and USD strength, here’s a look at his odds of remaining president by the end of 2019 in chart form (crude Elliott Wave notations are my own): https://imgur.com/AgsLyPN
Hi Michael,
I believe the USD wave up is a B wave, but the reasons are somewhat subtle. The entire wave retraced 62% of the previous wave down (a first wave should turn at a previous 4th) and I count an extra subwave at the bottom of this wave up. I also count EURUSD as a three, but it’s more obvious than the US Dollar index.
And no, no correlation to Trump, although he hasn’t helped himself by choosing to own it. Big mistake.
Thanks.
The USD shooting star on the weekly, and gravestone doji on the daily have been confirmed as reversal candles by subsequent price movement downward. Unless equitiy correlation with the dollar which Peter T has often pointed out as important, has been broken, it seems we should expect market price to extend upward to complete the current wave as the dollar declines.
If the correlation holds, the turn in the dollar must mean we should not expect a large market correction in the form of a C wave down to be imminent.
Non-confirmation by definition means not all indices will make make new all time highs simultaneously prior to onset of a bear market. Just because one or more indices go on to notch new all time highs, does not necessarily mean that they all will. In fact prior to wide recognition of the bear’s arrival, either DJT or DJI will fail to confirm the other’s most recent ATH, confirming the bear when both take out prior swing lows…
Yes thats why my stop is at 2790 on spx. Keep on chugging along daybtrading on dips, keep my longs open (most are since 2600) so even if I give up some profits down to 2790 im still way ahead of the game..Kenny Rogers knew when to fold em and my limit is the 2790. Till then im long as long can be.
Verne,
Just want to be clear on the statement “Just because one or more indices go on to notch new all time highs, does not necessarily mean that they all will.”
In fact, they all will go to new highs and finish off their required patterns. However, they may do it at different times. It can also refer to the waves they’re in simultaneously. My point showing NDX and SP500 is that SP500 is in a fourth wave, while NDX is in a fifth wave. SP500 seems to be corrective, while NDX is impulsive (another non-confirmation). However, they will both eventually top in fifth waves. I note that I neglected to make that statement in the blog post and so my example may not have been as clear as I would have liked.
In DOW Theory, the non confirmation, of course, is that Transports often top and head down ahead of Industrials. But they will all top and finish out their patterns, ending in fifth waves. It doesn’t appear that that’s going to happen in this particular (eventual) top, but the same situation as SP500/NDX applies in terms of the DOW wave structures (Transports appears to be impulsive, in a fifth wave, while Industrials is in a fourth wave, corrective).
Any thoughts on how much higher this B wave can go for SPX..It’s looking like 3k could still be in the cards?
Peter T
Thank you for your time preparing the blog. Your help is immense. My question is, if we are in a expanded flat, how long (usually) is the B wave?
Jeff T
Jeff,
Time is not a documented feature of flats. Just wave structure and wave length.
I agree. In my limited experience, I have never seen anyone precisely call the final top in either DJI or DJT until AFTER the fact. In fact I have seen more cases than I care to remember when there was almost universal agreement that one or the other had topped, only to have price later prove that to be incorrect. My point was simply non-confirmation comes only after at least one major index has topped, as you said, AHEAD of the others. Good clarification. Thanks!
Many people have called a market top way BEFORE the fact too. Its a fool’s errand. Whats more useful is planning around dealing with new all time highs and that’s where Elliot rules come in very handy. My time frame is weeks/months rather than days. I rode the long long from 2600 to 2800. Lost some money on shorting after that (which got stopped out). I have no real way of figuring out a reliable count on SPX right now. Focusing more on DAX and Asia as they have better counts to trade with. Whether we get a 5-12% drop in SPX before or after a new DOW high is not at all obvious to me, and hence I cannot use that as a signpost. Components of Nasdaq are already showing parabolic moves. IMHO, we will look back at this time period as the window when global equity markets started turning lower. In 2000 cycle, some of the markets started topping in 1997 and one by one different world markets topped out leading to the crash. We have markets that started topping in 2015. Given that this cycle is playing out slower than 1997-2000 cycle tells me that we can get to some crazy valuations in US over the next 6-9 months. However, I cannot get myself to go long right now at these prices before a wave 4. I would much rather wait for that entry point or miss out all together. That’s just my way of staying prudent for weekly to monthly time frame trades. For people who can day trade profitably, its a different story.
Im sensing some more free money today. Will gobble up this dip once i see oversold indicator and sell on the bounce.
I’m buying up too with small stakes. It’s guranteed to break the market and send it lower but I’m happy to lose some money smashing the market back down below 2790 and beyond as the big money will be made on the final long as per Peters analysis. I knew my longs would break the market and my 100% record remains in tact
Bought 289 calls at .50 and sold at a $1 for 100% Gain. I told you to buy the dip. Just wait for drop below lower bolinger bands and buy calls sell when it gets above bands. Wash..rinse..repeat!
Did a second trade at noon on dip below bolinger bands and just closed out a second 100%er. This is such a gift!!!
I sold the rip last Friday. Cashing in DIA puts and VIX calls. I will NOT be buying the dip, but I will sure be selling the rips going forward. Will reload VIX calls on any move back below 12. I think this is a small fourth with at least one more high just ahead.
You missed todays free money. Made 100% on the dip.
You are more nimble than I sir! 😉
Waiting for a fift wave down to open massive VIX bear call spread in anticipation of fifth and final wave up. Hoping for not just a double, (not that there is anything wrong with that!) but hopefully at least a five bagger!
Yes I did two trades today on dips and each rewarded me with a double. Watch the bands..it works!
I think the ultimate High is on 6th arround 2927-2930 (end of the day?). I hope 2929 that is a nice number. (number freak) On that point My indicators give a decline to the 14th (must be confirmed by the red line) so we have 7, 10, 11, 12, 13, down and 14th start up.
http://www.prognoseus500.nl/
Trade carefull 🙂
💥Berg Astro Indicator dates during September and October…could be an intense, volatile period!💥
September 7 (level 11)
September 10 (8)
September 12 (7)
September 19 (7)
September 26 (7)
October 17 (level 7)
October 23 (7)
October 24 (8)
October 26 (7)
Looking like another day of free money. Hopefully a nice gap down.. will gobble up these dips.. these markets are perfect for scalping. The bulls are in full control.
Also may take a stab at some volatility puts if theres a spike
In some more calls at open..Thank you Mr Market!!!
Hope you took profits quickly! 😊
At least Charles’ method of getting long protects him from significant downside. At worst, if he is wrong, he looses his premium. A day like today was bound to happen. There is a rising support trend line that comes in around 2862 on ES. If we can take that out, then its back to 2790 as the real support. Till we take those levels out, I cannot get too bearish. I will end up taking some chips off and then waiting to see if we can actually break those levels. If not, then its back to more of the same.
Out with a small loss (-20%). Price to pay as eventually some of these dips don’t fully get bought up..glad I didnt buy the vol puts too.
I covered 50% of my shorts (still at a small loss in the overall short portfolio). This market has not given any sign of wanting to break and I did not want to hold a full short in front of payroll report and a New Moon.
We are probably in a small fourth wave. The break from several bearish rising wedges means we could see a truncated fifth as price heads back up to tag wedge underside.
Any upward movement is an opportunity to get positioned for the imminent correction imho.
Agree with you on the potential positioning for downside. I will give this market a few days at max. Some of the parabolic stocks are breaking their parabolic lines. Not a great sign for the overall market. We have a New moon coming up that coincides with a payroll report on 9/7. Lets see if we get that opportunity.
I am trying to do a bit more reading on lunar cycles. It now appears that the key principle of the method is that the period after the full moon tends to usher market strength even if the period leading up to did not result in a market low. Assuming that the period prior to the full moon necessarily will lead to market weakness is an incorrect assumption it would appear. People often forget that markets can exhibit sideways price action as opposed to trending up or down.
Interesting divergence between Nasdaq and DJI.
Not sure why banksters spending so much to keep the latter propped up. The attempt at protecting the risk/parity trade failing miserably as VIX refuses to be manipulated downward.
Looks like we are observing a slow motion train wreck in the making. Traders are selling futures to avoid notice of cash session participants. Sneaky!!! 😀
There is a ferocious battle going on in the volatility arena. Short sellers are viciously trying to sell VIX down and strong hands continue to accumulate at every single dip.
I suspect when they give up trying to smack it down we could see a significant upside gap. If we close near the highs today we could see a real unravel in futures as leveraged positions rush to reduce exposure.
Sold that ridiculous rip in DJI for a quick 50%.
They are going nowhere trying to stifle vol.
I think we are getting set up for a bigger dive. Perhaps this is not the small fourth I think we were in…we shall see!
I dont think so Mr Verne..looks like we are still waiting on dow to get to new ATH. Every dip gets gobbled up. I made back all my losses for the day and then some just buying the dips. This is a market that refuses to go down..meaning a lot more upside IMO.
Im adding some Oct 288 SPY calls and gonna take a stab at some VXX puts. Bears non existent. Cant even put together one solid down day. Im thinking S&P hits 3K before Oct and Vix tanks between now & then. This market looking like late 90s..up up & away.
I guess that is entirely possible Charles.
What I see are decisive breaks of a number of bearish rising wedges, and a steady accumulation of vol despite repeated attempts to drive it lower.
We also had the very rare phenomenon of traders aggressively selling futures in the middle of a cash session today. It is one thing to scalp intra-day volatility. It is another to trade on the expectation of imminent new ATH. I will definitely be avoiding the latter! 🙂
I have so much in gains..just staying long Mr Verne. Nothing crazy with these Oct calls. Just putting some of my longer term cash back to work with plan to make more if additional upside from here or cut losses if spy dips below 279..equivalent to spx 2790. I just cant see any evidence that this market wants to go down anytime soon. Usually 4th waves have some serious down days. This market cant even muster a 10 point down day so Im staying long til I see something to shake me out. Have enough chips here on sideline to keep scalping..but I like to have one in the oven baking and one in the fryer to cook quickly. Hardy har har! 🙂
Best of luck on the long trades.
I guess we could be seeing some sideways consolidation here, but Nasdaq sure has a very impulsive looking wave down and I seriously doubt that the other indices will diverge from it.
Sir PETER..do you have a target for the B wave in spx or have we already hit your projection? Looks to me like this market wants to go higher but I admit it looks to be running on fumes as momentum is exhausted like a fat boy who smokes two packs a camels a day.
If you’re in the Chart Show in a half hour, you’ll get your answer.
The big money trade is long volatility. I have been waiting all day for a decent retreat but none is forthcoming. We also have ES remaining red all day in what is supposed to be a completing impulsive wave up if ATH just ahead. That, is something I personally have never seen! 🙂
I dont think we will see a spike in volatility until 2019..maybe a slight uptick but the algos just keep hammering it down anytime theres even a slight rise. My money is on a slight decline into oct then a rapid decline into end of year. We would need some sorta event to get a spike..no bears left otherwise. JMO
The futures charts just might be telling a different story…!
The rest of the world is already falling down. US has been holding up but wave structure allows for counts that can lead to a sudden fall in September. VIX will spike up if that correction comes – after that VIX can definitely go down in October and into year end. Any forecast depends on time horizon. There are people who trade 1% moves in SPX and there are people who ignore 10% moves. They all can use Elliot rules as long as they know what they are using it for !!
I am also a scalper by nature, but you cannot make spectacular gains scalping. To turn serious profits you have to trade significant trend changes with more capital committed than when you scalp. It is quite interesting what you stated about trading 1% vs 10% market moves. It is right on the money. If you have been paying attention, clearly quite a few volatility proxies are displaying strong positive divergence at recent lows and are now in an uptrend. A 10% move up from these levels is a very real possibility. Several indices have also clearly broken out or bearish wedges and are now back-testing wedge undersides. I guess I must be looking at things a bit differently than some…! 🙂
Nasdaq now has a 3 waves down as 5-3-5. Dow and SPX are still looking corrective in their declines. Bond markets are taking all this very lightly – not reacting at all. Given all the astro events lining up and the fact that this is September after one of the strongest August in 20 years, the rest of the month can be very interesting. I would not be short volatility this month.
I spoke too early about the bond markets. Treasuries are starting to notice. Next week sets up nicely for a big decline. Since I covered 50% of my shorts yesterday, I hope we get the payroll bounce tomorrow to go back to 100% short.
Many impulsive counts invalidated today with proposed fouth wave overlaps…
Yeah, it just amazes me how someone (who supposedly knows something about EW) could label this wave down as impulsive … it wasn’t – right from the start. But EWI did and they’re just now coming around to the idea (duh) that maybe it’s not.
I don’t usually look at other people’s charts, but I did theirs today and it’s “amazing.” (overlapping waves, waves that get ignored ’cause I guess they just don’t matter, measurements that don’t make any sense, and a larger count that says this is a fourth wave.
I think I’m up against something much bigger than lil ole me … lol.
Hope everyone bought todays dip..showing us that bulls are still in control and this market is heading back up.
Charles bullishness suggests a market top is near. Great contrarian indicator. Made a few point going both short and long Dow today. FTSe and Dax are firmly in downtrends so the US markets should join soon. After the recent market action I disagree hugely with Charles mega bullish view but one of us will be right.
My money’s on you.
We shall see..but my target for the wave B is 3020 for SPX.
It is really surprising how little attention traders pay to the signals from VIX on the daily chart…! A few analysts who had SPX in the fourth wave of an impulse up have now switched to a far more bullish 1,2 count with volume and momentum on the wane and VIX putting in higher highs and lows….interesting! 🙂
I think its because every dip gets gobbled up. This market is due for a little correction and we are getting it..but I dont think pullback will be anywhere near as deep as everyone is expecting. My guess is it will be very quick like feb..then back off to the races through 2019 and maybe bear market starts in 2020. Down should hit 30-40k before all is said and done. JMO
^^^ “Dow” not “down”..hardy har ha. 🙂
I saw one analyst, who I think is quite competent, count a 1,2 impulsive wave up underway. While it is quite possible a second wave is incomplete, I do not recall ever seeing this kind of volatility price action ahead of a third wave up. Of course there is always a first for everything in this bizarro market!
So I’m lost in the minute and 5 minute charts. For me it’s clear we’re in a 5th wave of an ending diagonal for a B, with C wave coming as peter suggests. I called a top last week to the day, but as everyone is saying, the drop is not impulsive, sold my puts but trying to figure out what this down wave is. I thought maybe a 4 but it overlapped what I thought could have been my 2 in 2 of c of wave of the 5 zig zag. Not sure if that makes sense wo a chart. Any ideas of what this pullback could be from the top?
Thanks for great work peter and nice insight from everyone else.
Ps, the move up since today’s bottom looking far from impulsive either which is making me non condiment in my thought for a wave v up.
Still no new all time high is the cash Dow since January
Charles : while agree with your bullish bias for next year
I have a hard time being bullish today . I’m begining to think
Us treasuries will be effected by political turmoil ( higher rates as
Confidence in us gov fades ) gold and silver ( gold silver ratio ) may have
Finally completed its pattern . If so then silver will out perform gold .
Not home to look at the data .
The US dollar index I’m neatral on at the moment yet big picture it’s bullish .
The oddity I am concerned with because it doesn’t make rational sense .
a commodity rally along with a US dollar rally would really mess with people’s heads .
That scenario would also , I’ll assume, cause more political turmoil world wide .
Just thinking out loud here .
How does one position their money in the very large picture is my thought .
Not quite a bottom in precious metals but I think we are getting close!
Interesting observation re DJIA. It also was the lone index to put in a new low below the Feb lows…
Thanks for your insight Joe. My background is more in Treasuries than in Stocks. IMHO, a decline in US treasuries due to a lack of confidence is more of a wave 3 of 3 or a wave 3 of C event. Assuming we are making a 100 or a 500 year top, all we will get in 2020-2023 is wave 1 or wave A. Assuming 8.25 years from the top, wave 1 of 3 or C starts around 2028. So that treasury drop likely comes in 2028 to 2030. In this cycle, we may get a mini panic in December 2018 that takes 10y rates to around 3.25% but thats about it for this cycle. I think we see US 10y rate turn lower and join the rest of the world as the FED eases and restarts its QE program in 2020. A spike in US treasury rate due to lack of confidence will pretty much signal an end of the world order established post WW II. I have to assume that such a big event come later down the pike from the top.
Very strange all the infected passengers arriving in the US from overseas.
Wassup wid dat? 😎
Gobbled up the dip again at open..looking good! New highs here we come!
In a bunch of 286.50 SPY calls. Target 288-289
Already up 50%!
Close enough to target (287.99), out with 50% gain. Not too shabby for 1/2 hour of work. Thank you Mr Market. Will wait for next dip.
Lol! I cashed out a few doubles at the open as I could smell the banksters eager to maintain the BTFD pavlovian conditioning and boy was I right. Watching VIX for signal to reload short trades.
What are you looking for another hammer down on the VIX?
The key level is 15. If the short sellers can keep price below it, they just might live to fight another day. 😊
The VIX short sellers are SLOW learners. Make no mistake.
Despite their sound and fury, that is a BULL FLAG…! 😁
Regardless of where the markets close today, it in no way changes the bigger picture. The bulls are giddy over the bankster brinkmanship in reversing the slide this morning. All smoke and mirrors! 😑
Agree with you Verne. I was hoping for a bigger bounce than this. VIX seems to be forming a cup and handle formation. I will be resetting my short in ES soon. I am expecting the drop (greater than 3%) to come next week. It would be ideal if ES can jump to closer to 2895.
another daily hammer bar telling this is not the real down wave. New moon over the weekend– price is still inverted, lows at the new moon. Looking for an upmove till Oct 1. The next Full Moon on 9-24 should fuel the last gasp up, just for a few days.
I agree. The real deal initial impulse down is going to be a sight to behold and will leave no doubt whatsoever…so far it does look like the banksters remain firmly in control…! 😏
Didja get my sarcasm? “So far, it looks..” lol!
The banksters are burning up a phenomenal amount of capital fighting this decline. While I do not, for reasons previously cited, believe that this is the big one, we could head back toward 2800 prior to the final wave up.
I expect the FIRST impulse down after the final top to OBLITERATE the 2800 pivot.
I gurantee we won’t be seeing the B.S. we witnessed this morning from the banksters!
STILL selling the rips…lol!
Reloading long vol positions. I am expecting all you-know-what to bust loose if VIX closes abovev15…buckle up!! 🙂
I did an awful lot of scalping the whiplash today but have no idea what kind of count we are looking at. The moves all look corrective to me. Anybody has a large degree viable count?
VIX suggesting more downside ahead and I have serious doubt about folk calling this a move down a second wave. The volatilty and momentum profile simply do not fit an impending third wave to the upside. This has been one helluva B wave if it still going on!
Next cycle ow due Oct 12 and I’d note Nov 8 Of which Nov 7 is a traditional
Cycle low on the stock indexs with a bullish bias into Jan 16. An above average bullish
Statistic . Yet my model says otherwise and argues a negative outcome which will
Probably be caused by the mid term elections .
Let’s not leave tesla out of the mix. Get stoned elon , the guy is obviously losing it.
https://imgur.com/gallery/5nt9Giq
Loosing it??!! I think he already has…!!! 🙂 🙂 🙂
Joe,
Are you then expecting we go down the next several weeks into and past the full moon cycle?
Joe,
Thank You for your input!!
Verne
Short answer is yes I do expect a further decline.
The timing chart I posted if you look at the dates and compare
It to several indices shows some very strong correlations over
The past several months. That chart took me a long time to put
Together ( a few years research ) I credit arch Crawford as well as
Raymond merriman for it though because it is based on their research
That I studied .
The long version to my answer though I’m going to quote
Raymond merriman and leave a link at the bottom so you can read
All of what he wrote .
This is the highlights in my view
The concern to financial astrologers now is whether the Saturn station of September 6 will stop this decline and be followed by a new rally to new highs, for when markets decline into a strong Saturn signature, it often represents the end to that decline. Or, were the Jupiter/Neptune, Saturn/Uranus, and Mars direct correlations to the crest on August 29-30 stronger, and the start of a decline that will gain momentum as we head into Venus retrograde on October 5? We will probably know the answer to that question by the time Mars makes its third and final waning square to Uranus on September 18. This latter signature is a wild one, often correlating with primary and even 50-week cycle troughs or crests within 13 trading days. The high of August 29-30 was at the beginning of that time band.
We have been under this Mars/Uranus square since mid-May, and it has lived up to its hype in terms of chaos and disturbances in national and international geopolitics (think Turkey, Venezuela, Argentina, Iran, Canada, China, and the USA). It has not been an easy path for the leaders of either of these countries due to pressures put on them by U.S. President Donald Trump, the epitome of these Uranian dynamics. To his supporters, he is seen as a brilliant strategist and maverick who is making huge changes in favor of America. He is righting many wrongs the USA has had to endure from poor financial deals in the past with other nations of the world. But to others, his behavior and methods are a very thin line between brilliance and abnormality, even amorality. He had a lot of bad press last week.
—The U.S, economy may be doing well, but the personal attacks on the president’s persona via articles in the media last week are stunning. And just in time for the mid-term elections coming up November 6. It makes you wonder about the timing. Is it political or cosmic? It may be both. But more important, to us, is how this will affect financial markets. When Nixon was faced with a similar hatred for and from the press, his was brought down and the U.S. stock market collapsed nearly 50% from an all-time high January 1973 to a low in December 1974. Coincidentally, that high was also during the last 45-year Saturn/Uranus waning trine cycle, a geocosmic signature that just ended again the week of August 31, 2018, as the S&P and NASDAQ made their new all-time highs. It could get very volatile this week too, with Venus in opposition to Uranus on September 12. That is, both Venus and Mars will be making hard aspects to Uranus September 12-18 and you know what that means: support and resistance areas may be broken, for Uranus has no respect for either, whether in love or financial markets.
You can read it all for yourself .https://mmacycles.com/index.php?route=blog/article&category_id=1&article_id=215
Thanks Joe.
I am deeply conflicted about what to expect this month. As you all know, my experiment in trying to see if we could depend on full moon lows was less than a smashing success as we saw not significant decline last cycle but price did ramp higher after the full moon last August 26. I attributed it to the full moon being a time of sideways consolidation. The decline so far this month does have the potential to take us to a low around September 24, the next full moon, when I guess we could see either a corrective bounce or an outright trend reversal depending on what happens between now and then.
There are also seasonal forces in play. September is historically one of the weakest months for the stock market.
In addition, when it comes in the second year of the Presidential cycle it is even more so.
Other bearish portents are everywhere.
A number of indices have decisively broken down from bearish rising wedges and prices have not met the measured downside targets. RUT appears to have broken down from a small ED.
All these new highs came on steep negative divergences in just about all of the major indices, some even steeper that those seen in January.
VIX is definitely flying a red flag. It has stoutly resisted all attempts to crush it. The end of August saw continued massive short selling of volatility, yet is has established an uptrend the last few weeks that refuses to retreat.
The bullish sentiment also showed up in historical short positions in Gold, and also Treasuries. Very unusual for such one-sided trades across such a wide spectrum.
So all in all, I have to agree with your bearish leanings.
A few analysts have pointed to the possibility of a recently completed primary three top and the area of the intermediate four is roughly the same for Peter’s target for a C wave down, and it is quite a ways….
Last thought
I don’t know or even claim to know musks position in tesla
But: if my memory serves me he is leveraged . I read something
A while back that he bought shares on margin ( used his shares as collateral )
Don’t quote me on that yet we have all heard about people blowing up their
Accounts by being over leveraged .
it’s worth looking into at the very least .
He is indeed VERY leveraged, to the tune of some 8 billion dollars some genius gave him to prop up TESLA’s share price. Yes, that is billion with a “B”. Incredible.
He is not the only one, he just has more visibility due to his antics.
August was the month of the most massive share buybacks of the year.
An awful lot of US companies have taken full advantage of artificially low interest rates to issue bonds, buy back company shares, boost P.E. ratios, and pay themselves handsome bonuses for that feat.
It is the great un-reported financial scandal of the current business cycle.
The capital destruction that is going to be caused when the shares of all those companies precipitously decline and their ability to service those bonds as earnings shrink (which they have been doing for years!) is going to make the last financial crisis look like a leisurely stroll in the park. Those bond floats make this current bubble a lot bigger than many realize as we are dealing with far more than just inflated share prices! Who will bail them out this time??!
Solution is easy Verne. Re-issue all those shares they bought back at massively discounted prices to today and then issue more on top. End result is devastating share dilution that will mean Dow 30k will take decades to obtain. One problem I see is who is going to want to buy all the share issues in a major depression. Ah of course the Fed. Won’t be surprised if the Fed ends up owning 25% of the stock market and that will be the next bubble.
By the time the bull market ends in 2019 or 2020..Dow could be much higher than 30k..it seems like 50k or more is possible. The euphoric part of the bull market hasnt even started. Usually you will see stocks take off sky high before they plunge. Last few years have been tame. This year could be the start of the euphoric rise.
And don’t forget resumption of Q.E. infinity!
I will be heading to the chart show the next few weeks to get Peter’s take on the developing wave down.
I know it is expected to be a simple five wave affair but I have a sneaky feeling its going to be anything but simple based on what we have been seeing of late…
At any rate I am already about 20% loaded short and will be scaling in if Mr. Market cooperates.
We have plethora of broken bearish rising weges.
I’ve been looking back at my trades these past two week..every dip was gobbled up. It looks to me like the SPX should keep heading up into October then a shallow pullback and off to 3k. I’m 80% invested in long positions and using 20%..for scalping. Usually make 25-100% on 1 or 2 sometimes 3 day contracts. Any time the market goes oversold on the bolinger bands I add calls and sell once it gets to oversold or I have a good profit then use a trailing stop. This is a market that wants to keep going up. No volume on selling.
No volume on selling?
Look at the size of the red candles! 🙂
A new free blog post is live at: https://worldcyclesinstitute.com/a-slowly-dying-market/
This website is for educational purposes relating to Elliott Wave, natural cycles, and the Quantum Revolution (Great Awakening). I welcome questions or comments about any of these subjects. Due to a heavy schedule, I may not have the time to answer questions that relate to my area of expertise.
I reserve the right to remove any comment that is deemed negative, is unhelpful, or off-topic. Such comments may be removed.
Want to comment? You need to be logged in to comment. You can register here.