A Change of Trend
It’s still early to call a top, based upon Elliott Wave methodology. However, here are some facts regarding Friday’s action:
- at 665 points, the DOW had the largest decline since Dec. 1, 2008
- more than eight times as many stocks on the NYSE closed down than closed up
- every single one of the 30 DOW stocks closed down
- 469 of 500 stocks in the SP500 finished the day lower
- in 5 days, the SP500 wiped out 2 weeks of upward progress
- the DAX has completed (or almost so) its first wave down.
AAPL has traced out an extended third wave and is poised to rally in a fourth wave of the first. TSLA turned down after a double-pronged second wave. FB turned down after spiking up in what looks like the final rally of an ending diagonal.
The wave structure of the USD currency pairs I follow don’t support a turn … yet. It looks like the US dollar has one more low to go before all the currency pairs turn. I would expect the turn here to happen as the second wave of the US indices reaches its high.
Oil looks to be topping. Gold and silver are heading down while USDJPY traces out an expected bounce.
Everything I’m seeing tells me a top is forming internationally.
The First/Second Wave Combo
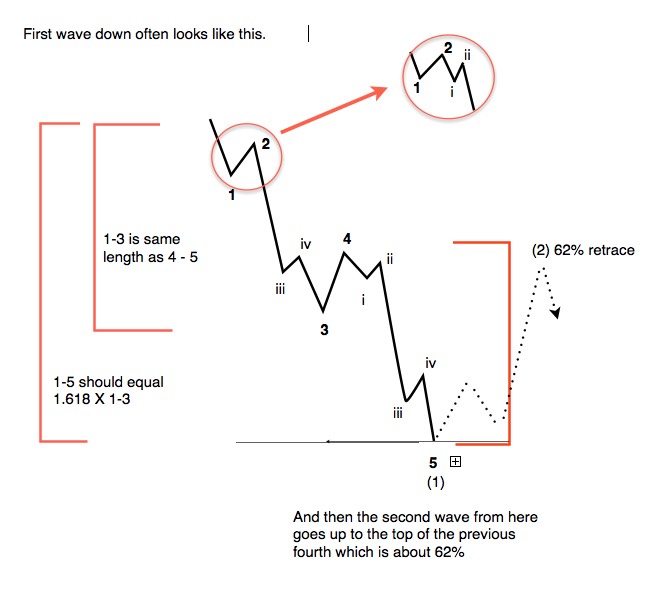
The above chart is not something you’ll find in the Elliott Wave Principle book. This is the typical configuration of a first impulsive wave down, with a second wave shown in dotted lines.
There are certain criteria that are critical in the determination of an impulsive first wave rather than a zigzag (a corrective wave):
- There must be two small first/second wave combinations at the start of the pattern (shown in the inset).
- The third wave must contain a subset of five waves.
- Wave 4 must retrace 38% of the progress down thus far from the top.
The current wave down seems to meet the above requirements. However, a further determinant of a change in trend is the need for a second wave retracing at least 62% with a subsequent drop to a new low. This is what we’ll be watching for over the next ten days or so.
In this week’s Chart Show (links at the bottom of the post), I’ll be providing the targets for entry for the next phase … the 5 year (at least) bear market we seem to be entering.
Turning the Ship — A Process
Let’s look at an update of the US Dollar.
I’ve been maintaining for the last couple of years that once the US Dollar found its low (it’s in a large fourth wave—a corrective wave), that it would mark the top of the US market.
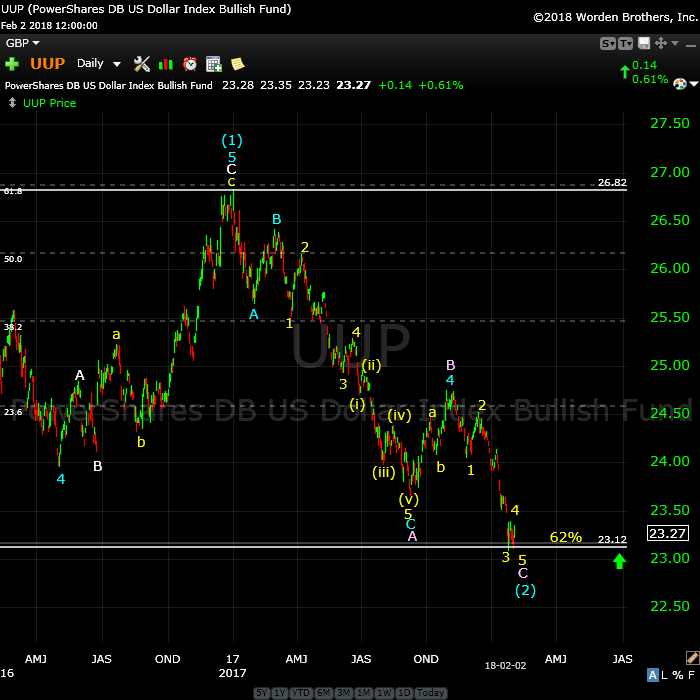
Above is the daily chart of UUP (US Dollar ETF). UUP is representative of the structure of DXY (the US index) and will provide an excellent predictor of the impending top in currency pairs and the US indices.
Last weekend, I wrote here that I was expecting a small yellow wave 4 and then a new low in a wave 5. We now have that pattern in place, but it doesn’t look quite complete yet, although very close. I’m expecting one more small final fifth wave down to conclude this trend, culminating in a turn up and leading eventually to a new high above 26.82 for UPP and a similar new high for the US Dollar.
The movement of the dollar strongly influences the movement of just about everything else, so it’s important to pay attention to what it’s doing on a large scale.
___________________________
The Tesla Train is Confirming a Trend Change
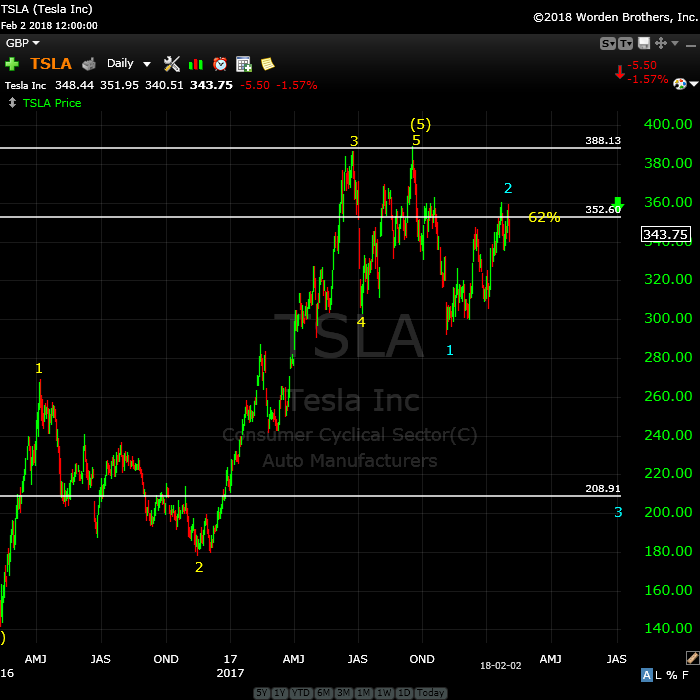
Above is the 2 day chart of Tesla, showing my prediction playing out. The top is not officially in here; we need a new low below ~290.00.
Last week, I suggested we’d head up in a “double-pronged” second wave, which is exactly what we’ve done. We’ve now potentially turned down into a third wave with a target in the 209 area.
There are potential variations to this pattern, but the ultiamate goal for a full first wave down should be below 140.00. (This includes the first and second waves already traced out, a large third wave down to about 209.00 and a further drop in a fourth and fifth wave.)
Apple Continues to Drop
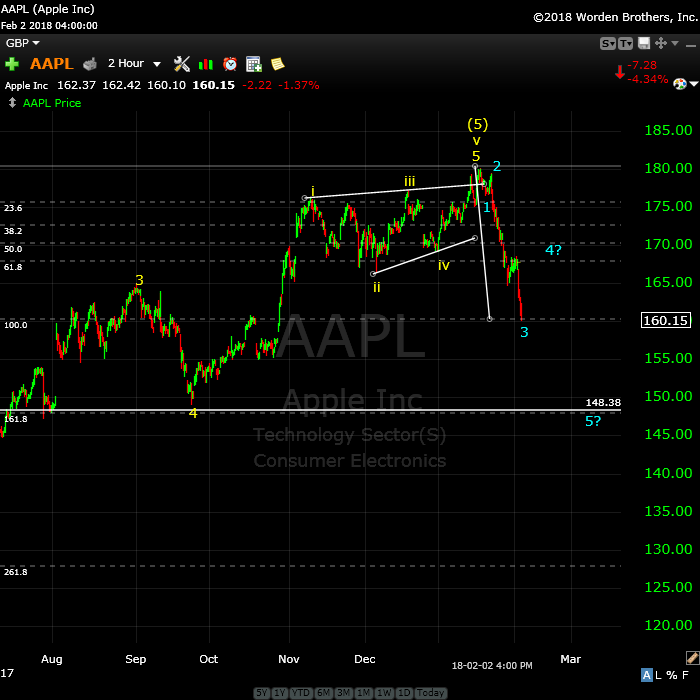
Above is the 2 hour chart of AAPL.
Last weekend, I identified a pending top here, with a third wave currently in progress. We’ve continued down in that third wave to the point where we have five waves down.
Expect and fourth wave bounce and then a drop to a new low. It looks like the target is indeed the 148.00 area, the same target I identified last week.
On Deck: Facebook
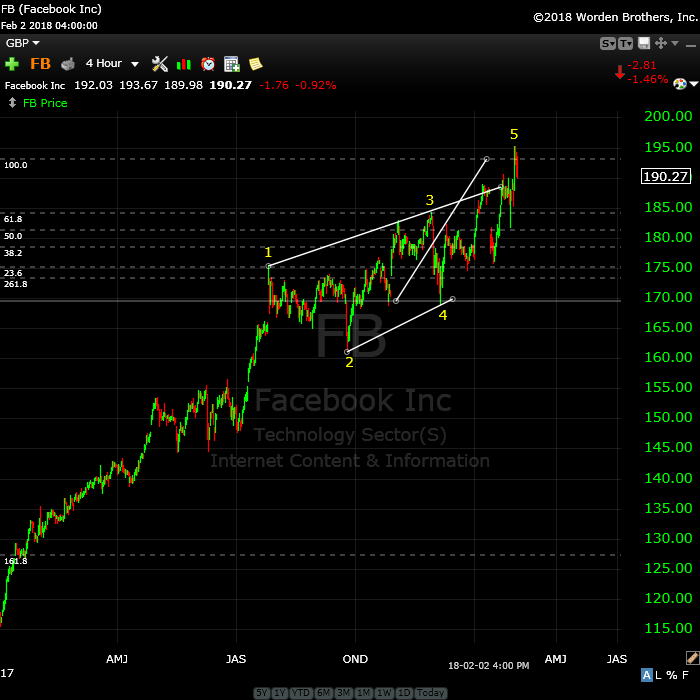
Above is the 4 hour chart of Facebook (one of the FANG stocks). This shows the final pattern I described last weekend, which is an ending diagonal. Ending diagonals gained that name because they form at the end of a trend. You can short a pattern like this when it drops below the lower trendline.
The bigger they are, the harder they fall. This is potentially the start of a first wave down, which should revert back to the beginning of the ending diagonal, the previous fourth wave, around the 145.00 area.
__________________________
I’m Moving (but hopefully, you won’t notice)
This last week, I had a big blow-up with my current hosting service (Bluehost). They have a bug on their server, but they refuse to acknowledge it. The WordPress code on my site doesn’t communicate with their php engine, which we’ve proven, BUT …
… so we’ll agree to disagree, and I’m forced to move the site to another hosting company, which should happen sometime this weekend.
My current site has been tested on the new server and it works just fine (as it does on two other servers we’ve tested it on). I’m hoping that the switch will be seamless, but if the site is down for a short period, that will be the reason.
Registration for Commenting
Want to comment? You need to be logged in to comment. You can register here.
If you register, it protects your information. It also allows you to comment without filling in your information each time. Once you’re registered, simply go to the home page and click on the login link top right in order to log yourself in. Usually, you’ll be logged in for several days before needing to be logged in again.
______________________________
Problem receiving blog comment emails? Try whitelisting the address. More info.
______________________________
The Market This Week
Here's the latest daily chart of ES (emini futures)
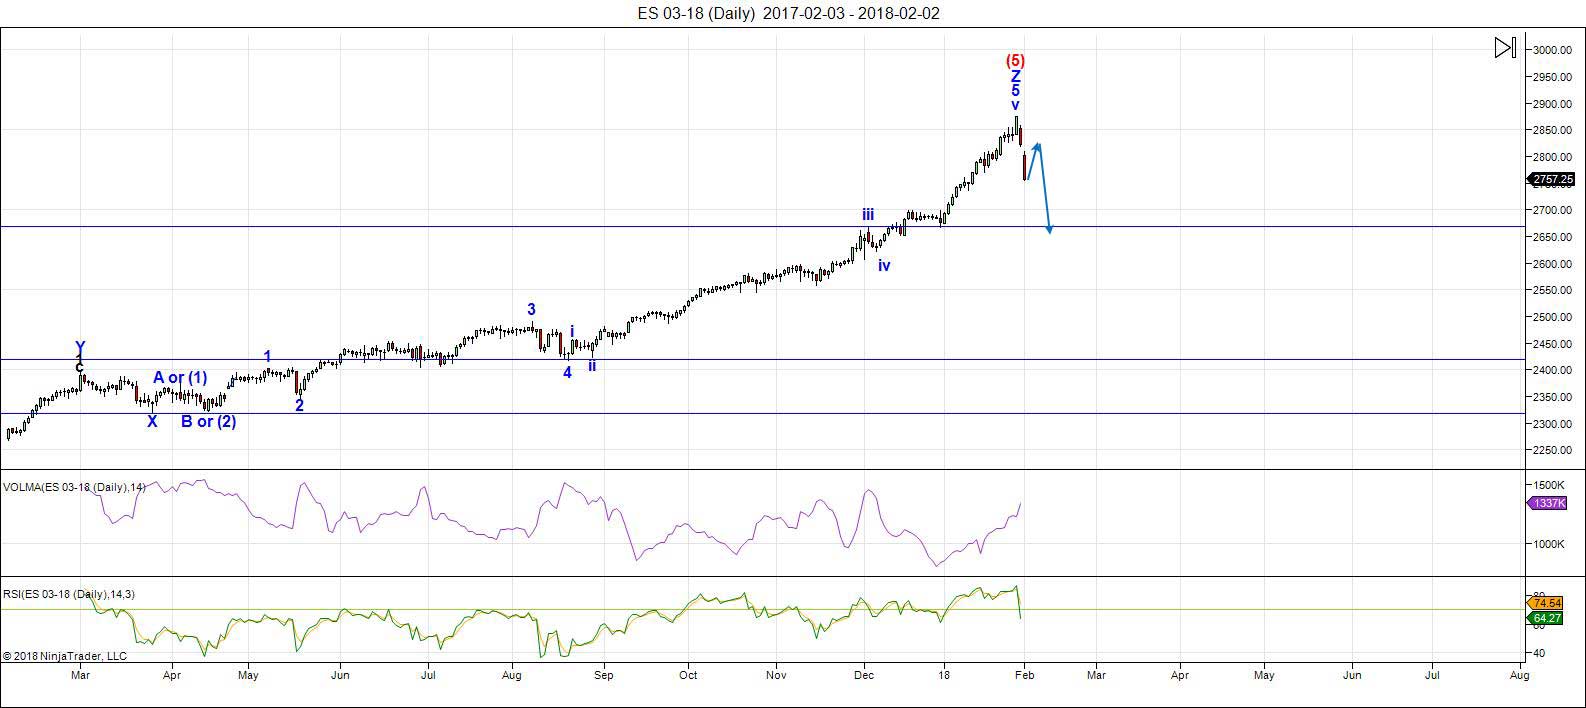 Above is the daily chart of ES (click to enlarge, as with any of my charts).
As predicted, we reached the final high and have turned down with gusto! The methodology does not let me call a top yet, however. I'm waiting for a second wave and a successful drop from there to a new low.
We're still in the first wave down and I expect more downside this weekend to approximately 2730 (my lower prediction for a first wave low). Then look for a second wave probably starting Monday morning.
Volume: It's risen as the "early rats are leaving the ship," as expected.
Summary: We've turned down across the US indices. I can't confirm a top yet, but early signs suggest an impulsive wave down in a typical first wave scenario.
___________________________
Trader's Gold Subscribers get a comprehensive view of the market, including hourly (and even smaller timeframes, when appropriate) on a daily basis. They also receive updates through the comments area. I provide only the daily timeframe for the free blog, as a "snapshot" of where the market currently trades and the next move on a weekly basis.
______________________________________
Sign up for: The Chart Show
Next Date: Thursday, February 15 at 1:00 pm EST (US market time)

The Chart Show is a one hour webinar in which Peter Temple provides the Elliott Wave analysis in real time for the US market, gold, silver, oil, major USD currency pairs, and more. You won't find a more accurate or comprehensive market prediction anywhere for this price.
Get caught up on the market from an Elliott Wave perspective. You’ll also get Andy Pancholi cycle turn dates for the SP500 for the balance of the current month. There’ll be a Q&A session during and at the end of the webinar and the possibility (depending on time) of taking requests.
All registrants will receive the video playback of the webinar, so even if you miss it, you’ll be sent the full video replay within about an hour of its conclusion. For more information and to sign up, click here.


What a time to be a trader!!! 🙂
…and thanks for the update Peter….see ya Thursday…
Thank you Peter!
Peter … I FINALLY got in ? LOL … let’s see
got to learn HOW TO read the English language – INSTRUCTIONS.
Good, sorry you had problems. I wasn’t sure what they were by your email or I would have tried to help …
NOT sure — but someone here mentioned 2 weeks ago about Feb 2 …being a low/downdraft ?
Feb = 2 [ or as in Freemasonry = 2 ones / 11 ]
2 = Freemasonry = 2 ones / 11 ]
2018 = 2 + 0 + 1 + 8 = 11 [ which doesn’t get broken down — the MASTER #s]
so Feb 2, 2018
= 111111 / 6 ones = 6 ? flip it over & its a “9” = completion
now this is interesting re “666” = TIME
check Jeff York’s tweet :: https://twitter.com/Pivotal_Pivots/status/960180749331763201
Peter T — you expecting a 50% retracement from the high ? $SPX
2,715.16 50% Retracement From 13 Week High/Low
https://www.barchart.com/stocks/quotes/$SPX/cheat-sheet
2715.16 was MY price target for END OF DECEMBER 2017 on $SPX …lol — based on 1810.11 [ Feb 8, 2016 low] x 1.50 = 2715.165
got to learn EW … am re-reading your posts.
Peter T — gather this is wrong — all these charts on EW ?
tweeted them at my twitter accounts which now Twitter won’t allow me to tweet unless I give them my phone # which on their site tells me its optional & of course I won’t. so its a battle. have to clear my cache & then go by the backdoor to get some of my tweets. frustrating & bugs me to no end.
https://twitter.com/BUDDIEE18/status/959232399606345728
also Feb 4 is a GANN day — give or take -/+ 2 or 3 days
2nd chart :: https://twitter.com/BUDDIEE18/status/958900236662943744
had to go thru all my tweets in order to get that tweet. doesn’t show any tweets using “Search Twitter” box. infuriates me — but I always try to be a step ahead of them. lol
also $NYXBT — methinks 7400 — the 144 SMA [where price & time squared] is in the cards ?
do also $NYXBT : $GOLD / $GOLD : $NYXBT
g’night
That first chart is a simplistic chart of a bullish impulsive wave. It doesn’t have much to do with what’s going on.
ok. thanks.
was in the process of replying to your email — but my hotmail seemed to freeze and I kept clearing my cache — but still didn’t seem to help — even though I just had hotmail email addy opened.
thanks again for your help.
energy chart for Feb. 5th
https://ibb.co/jQ6pMH
Hi Tom, spot on do you have a follow up for this week?
Thanks.
Looks like ES completed a third down, and now tracing out a fourth. We should see an interim low in the cash session today, then we get to sit back and see the BTF dippers go Ape-Wild! 🙂
Kinda sad really…
verne,
please ……no “throwing” things………..or tossing spiders…………..and especially nothing with “snakes”…………….. so here is my count so far…{gasp}
are you sitting………………….https://invst.ly/6jfvt
“Tossing Tarantulas”….has a nice ring to it…! 🙂
How about “Pitching Pythons?” 😀
“Casting Cobras?”
Somebody stop me before I hurt myself! 😀
……such vitriol ………………….it was ONLY one chart!!!!
…………………………………………remind me never to post 2 charts!
and verne,
speaking of “vitriol”………….an elevated VIX is ……bi directional………….
larger moves both to the upside AND the downside………..
If you do, I am afraid I am going to have to….”Mobilize the Mambas!”…d’ya hear??!!
An active VIX is every trader’s delight!
I consider it that we completed the first wave down and are now in a second wave. As peter has said ( i think sorry if i put words in your mouth) often gets confused with a zig zag corrective pattern in threes since wave 5 of the first wave is so larger.
Which just means the next wave 3 is much bigger :).
…….[cough]…………….ahhhh ……..TED………….
what EXACTLY is the subtext of your “wave” comment…..hmm……………..
forgive me…………….but did you just call me ………..a FAT lardbutt???………..
No such comment from me! With NYMO readings so oversold i think we are in a wave 2 now!
are you seeing divergence in your NYMO readings ted??
no? ………………… hmmmmm………….time for a bar bee qua!
No divergences yet, just using some of Northman Traders Charts that show the NNYMO made an extreme weekly low reading of -90.22. Short Term bottoms typically form at extreme lows like Friday. Sometimes there are divergences like in August 2017 and in early 2016, sometimes there aren’t divergences like Early November 2016. And the early 2016 had that two week bounce after the January low before making that February low. this weekly will likely close higher than last week open. BBQ later this month imho. And i love the Spicey BBQ sauce.
ted……. its ………..bar – be – qua!!! https://www.youtube.com/watch?v=7Z3c-4W3LJI
and NYMO – how did it perform to the upside?? did it tell you about a “short term high”……………………oh wait…………we never had one of those in 2 years……….it has been higher highs…………….hmmmmm…….. NYMO!
finished watching James Flanagan’s latest video
2581 is 10% decline from Jan 26, 2018 high of 2872.87
2752.20 would be a nice close today … or better stilll the 2777 which is EMA (26) – also pivot point. miracles do happen. lol
he also talks about bonds :: http://www.gannglobal.com/webinar/2018/01/18-02-05-Video-Offer-Is-Open.php?inf_contact_key=f49bb703792122f8069b5e290d2ef33f04e176cc60de325996681974a7db23ca
oh yea… $BPSPX is down 8.40 @ 75 from 83.40 — we shall see IF this is the low/not
$BPSPX now @ 74.40 — down 9.00 from its high of 83.40
70 = line in the sand now ? — normally used
http://stockcharts.com/h-sc/ui
just use “$BPSPX” for those who don’t use this site.
also:
$BPNDX down 18 @ 65 from its high of 83 this year
use 5 year charts & you’ll see a pattern
same w/ $NYMO
$TNX made a NEW 52wk HIGH earlier this a.m.
52 Week High 05 Feb 2018 28.62
the 30 year — $TYX still no show THIS year.
52 Week High 10 Mar 2017 32.01
the 5 year — $FVX ..NO NEW 52wk High…today:
52 Week High 02 Feb 2018 26.21
20 year bond ETF –> $TLT
Today’s Range $119.33 – $118.64
52 Week Range $116.49 – $129.57
also ::
ISHARES IBOXX $ HIGH YIELD CORPORATE BOND ETF :: $HYG
Today’s Range $86.51 – $86.13
52 Week Range $85.99 – $89.04
SPDR® BLOOMBERG BARCLAYS HIGH YIELD BOND ETF :: $JNK
Today’s Range $36.37 – $36.22
52 Week Range $36.19 – $37.46
latter 2 are watched like hawks by some pundits
just looked at his twitter stream. should have done a “Search Twitter” on $TLT , bonds, etc.
anyhow — something to think about ?
https://twitter.com/CiovaccoCapital/status/960564157677490178
so far day low :: 2726.23
wonder since PP #2 taken out::
Pivot Point 2nd Support Point 2,728.06 and day low (so far) 2724.15
IF..
2,715.16 50% Retracement From 13 Week High/Low
…on deck TODAY
https://www.barchart.com/stocks/quotes/$SPX/cheat-sheet
$VIX which most are fixated w/it. don’t know why…anyhow
52 Week High 05 Feb 2018 21.82
$VVIX
52 Week High 10 Aug 2017 135.32
$VXST
52 Week High 05 Feb 2018 27.06
$VXO
52 Week High 05 Feb 2018 20.06
WHEN their 52wk TOP is in — normally means BOTTOM in markets are in.
at least to me. could make newer 52wk highs… but I doubt it — the $VIX’en Familia normally runs from 1-3 days tops
ok verne………………i need to you take one your “pills” please……. the ones that calm you down……………..because i am going to post another ES chart.
https://invst.ly/6jk51
Looks like SPX just below 2673 is the target. Wow what a nice wave though. Longer than I expected though. Wave 3 and 5 are going to be monsters.
jody……
so let’s play “what if”………………….
#1 what if – this C wave completes itself in 3 waves rather than 5 waves…….
#2 what if – each phase of a 3 wave, C wave, is also in 3 waves……..
#3 what if – the b waves of each of the zigzags were muted…. sideway shallow b waves………..
what if we get a zigzag C wave that look like this — https://invst.ly/6jl02
ok… FINALLY $VVIX made a NEW 52wk HIGH
52 Week High 05 Feb 2018 138.89
joined the rest of the $VIX’en Familia… yea.. know majority of you here & those on Twitter expecting more downdraft. somehow …don’t think so — am looking at the 3 amigos :: $FVX $TNX $TYX ..versus $TLT and they all scrambled right now — hard to explain. when 3 amigos up — $TLT down & vice versa
also — Crude Oil — down — so yea… some use this one as a correlation to the markets $SPX
https://www.investing.com/commodities/crude-oil
$VVIX always MY No.1 indicator for the $VIX’en Familia
also:
2,715.16 50% Retracement From 13 Week High/Low
2,677.94 38.2% Retracement From 13 Week Low
https://www.barchart.com/stocks/quotes/$SPX/cheat-sheet
oh yea.. 4got — the VOLATILITY indicator on the 10 year $TNX — non-existent. should have been flying today. nope
Open 4.62
Prev. Close 4.48
Day High 4.65
Day Low 4.32
52 Week High 08 Feb 2017 11.73
52 Week Low 14 Jul 2017 2.09
seems a lot of disconnects ?
anyhow — SPX back to Jan 3 levels.. the day low 2697.77 and the high 2713.06
watching Crude sell-off. some fibonacci traders swear by the relationship of SPX / markets to crude.
$TRIN hit 2.11 — normally anything > 1.60 @ close indicates RALLY next day/2
take it fwiw
I’m not all that thrilled by the look of this wave down from the top. It’s looking more like a fourth wave, which would mean we’d visit the top again. We’ll see how and where it ends, but it’s more than likely now that we’re headed towards 2673, the previous larger, fourth wave.
this is NO 4th subwave – boss!
This seems similar to late July Mid August 2007
update ES………….https://invst.ly/6jl44
$BPSPX now @ 67 NOW.. WOW
$SPX so far & 3/4 of an hour more to go.
Day High 2,763.39
Day Low 2,638.17
$TRIN hit 4.01 SO FAR..
think its all about fibonacci levels — the market up & down.
Island radio giving reason why market sell-off — cause of inflation & interest rates being raised in march ?
but here I am … looking @ $BANK & $GS and they NOT up.
nor is $TLT
so all I see ALGOS gone WILD ?
or just cause we taken up in such a short time — reversal just as fast. that’s MY thinking now.
$BANK
4,065.00 (US) DOWN 102.39(-2.46%)
do you think it is the fed in there propping up the market – or did they walk away and let TRUMP/treasury do the heavy lifting……………..?
FED’s not doing anything and NEITHER’s Trump — see many tweets/posts referring to some particular event. am w/Peter T on this one — nothing to do w/events/people. still maintain that its all about FIBONACCI levels when broken/breached & all cyclical.
turn off the TV & so called experts & just watch the #s on your screen & levels & go from there.
this is “margin call” x the greatest leverage amounts ever in history………… this is show time – peoples……………………………..
I see.
am not concerned. not panicky…just observing how fast we moved up & how fast we moving down. its a mirror image to me.
emily – its ok to admit the adrenaline is flowing …….. “a little”…….it gives one that feeling of being ALIVE!
lol… luri ?? nope — am just fascinated. I had BIDU calls for this week — but sold them on Fri…and rest of holdings are like PLUG GENE FCEL SSC BLDP [ which I used to trade when I 1st started trading in ’99 — was in the 80 range — traded blindly — w/20 minutes delay but still made dough on this one. now its like $2. lol ]
just wish I took my advice last week — kept tweeting all kinds of charts & dates and one would think that I would take the other side ? lol.. nope ! just know how to look up & not down. LOL
Peter G…
Your S&P chart from a little after 2pm on January 31st is looking pretty good!
Yes, Ed. That chart for the closing price channel was virtually perfect at the top. It called the closing price high on the index to within 1 point!!! As the fundamentalists say, a “random walk.” Sure!!!
Here is the link to the updated chart…Click it for a full-page view…
https://imgur.com/a/KeQw2
Try this if the above link doesn’t work…
https://imgur.com/a/9p7pn
And final try:
https://imgur.com/03of7kT
Someone today is using my S&P500 & BTC analogy at another site. Lol. Unbelievable.
https://worldcyclesinstitute.com/way-too-much-bull/#comment-27471
Anyway thank you Peter T., Luri, Joe, Valley, Original Dave & Andre. Thank you very much for all you share. Good luck to all.
thanks liz………… !!! be honored that your work is being plagiarized – it means it is good work………………….
Ok I guess we have fear now!
Fear yes; capitulation, not yet….
ES update – https://invst.ly/6jlmg – still need to make a new low for the end of wave 3……….methinks………..
I follow many on Twitter — Mark’s one of them:
https://twitter.com/MarkNewtonCMT
“IF” this stock market decline is being attributed to rising bond yields,(as bonds and stocks have begun to show some strong positive correlation) than buying Stock dips is early, as Bond yields look to have more upside this week-Close, but early & we should see Tues-Thur >2.88
“S&P has taken out earlier am lows.. so not much here until down near 2675-2690, with about 2-3 more days of this selling possible before relief rally develops.. For now..while bounce creates minor divergences, undercutting 2733 is a clear negative technically in the short run”
not much on the gold futures
1,340.00 +2.70
https://www.investing.com/commodities/gold
like I’ve posted earlier — nothing’s in sync — the TNX v $TLT etc — not even OIL v SPX — at least not what I’m seeing — Crude didn’t tumble THAT much compared to SPX & rest of the market indices.
and as to the FEAR factor ?? the $VIX’en FAMILIA ? they all made their NEW 52wk HIGHS today — TOP for them is IN. am basing on previous times when the VIX’en Familia went for 3/4 days straight of NEW 52wk highs. that’s about it. ALSO — $TRIN spiked to 4 area & closed > 1.60 @ 3.22 indicating RALLY next day/2
I keep stuff simple.
my 2 cents w/o the GST [ goods & services tax – in canada] lol
watch morgan stanley – MS……they were levered so “bigly” that only a 3.8% move in their assets would blow them up!!!!…………….
oh wow… another one of those “too big to fail” ? & then we bail them out ?
btw — do you follow Peter Ghostine ?
he pre-warned on January 22nd
https://twitter.com/PeterGhostine/status/955509614296141825
the ES has continued to drop….is at 2607 https://invst.ly/6jm9-
Luri – could you draw up an EW daily chart for Bitcoin. This market could be following it.
My target is about 2400
Red Dog … Bitcoin 2400 ? then IF SPX / ES_F correlates to that one — what price target will $SPX be ? this directed to everyone here.
am looking $NYXBT : $SPX here
6000
Red Dog … SPX @ 6K ?? WOW
ok.. thanks for your input
no worries red ………….i am on it………..will post it asap…………..
okey-dokey
RED,
i am unable to accurately and reasonably chart Bitcoin/USD pair………….. we go from zero to 1200 in wave 1 and in wave 2 we go back to zero???? how is that possible?? do we start the count fresh from the point of the second zero, as in w1 all over again? or is it a w2 to zero, to a high in w3??
the scale is so enormous, the fib ruler becomes a distraction, rather than a tool……………. see for yourself…………https://invst.ly/6jnmq
lol, if this is w2 to the downside we can retrace up to 99 per cent of w1……… help?? can i have a ruling here as to the second zero?? peter?
That’s a bad tick. I included bitcoin in last week’s blog post. It hasn’t changed that much. In 4th wave (the wave down is corrective).
S&P 500 future
Prev. Close: 2,756.75
Open: 2,757.25
Day’s Range: 2,596.00 – 2,763.00
S&P 500 2,620.00 -136.75 -4.96%
right now. quite a sight
hope many of you follow this dude:
https://twitter.com/6_Figure_Invest/status/960638820914905088
“Data is chaotic now but key numbers show $VXX IV value at +96.10 % for the day and $SVXY IV down -96.67%. It’s likely $XIV & $SVXY terminated. If so their final values will be set by what value the futures were when they closed out their position. Likely at least down 80%.”
ALSO ..you’ve all seen Francis Bussierre’s tweet ?
https://twitter.com/AstroCycle_Net/status/960276599559081984
today feels like aug 24, 2015. (week) … remember previous week to Aug 24, 2015 — the devalue of the YUAN ? also week ago/2 — China comes to mind re no bond buying. I wonder now.
anyhow — saw some twitters complain that Trump shouldn’t have gone after the FBI — c’mon — why not when those @ THE TOP @ FBI ARE CROOKS !! and the FBI is NOT elected. so just WHO is CON_trol of the USA ? appears NOT the President.
anyhow …can go on & on.. but won’t.
ok.. last post for the day.
haven’t been to Gabby’s site for a looooong time. she’s pretty damn good @ astrology:
World financial markets and astrology
https://astrologyandthemarkets.blogspot.ca
Hey Verne;
I know you trade Vix products sometimes….so just a heads-up..
There seems to be some weird stuff going on after-hours, particularly in XIV..
I doubt you’re on the wrong side here, and you’re probably on it, but ~something’s~ gonna happen here tomorrow…
Hi Barry:
I cashed in SVXY March 130 puts today for 50.00 ever (bought for average cost of 3.80). The most explosive trade I have made…ever!
Not sure what is going on with the vol instruments.
Considering what has gone on prior, only the incorrigibly gullible would not have seen this coming, The short vol trade has yet to fully unwind and as we speak,
many leveraged accounts are now irrecoverable. The margin calls have probably already gone out, and I trust those boasting about remaining long were invested without margin. It is beyond amazing, but as I frequently opine: “Nothing new under the Sun!”
I have said previously on this forum that SVXY and XIV are going to practically zero after interminable reverse splits, if they even continue trading. My opinion has not changed in the slightest.
end of day ES…….. https://invst.ly/6jnqb
hey verne,
remember that vix chart i posted a few weeks back of the monthly time frame ….as i am unable to chart the vix at the daily time frame………….
well here the update of the chart………..so the two price labels i had on the internal pink channel………well that one was hit today………. well see for yourself……
https://invst.ly/6jor0
and the RUT chart i used to post……and then i would exclaim……”BE WARNED”!
https://invst.ly/6jot6
zigzags are the new “pink”…………………so think pink!
https://invst.ly/6jov1
Peter G,
It looks to me like the bottom parallel trend line on your S&P close only chart that you posted on January 31st has been broken to the downside by 50-60 points. That seems like a major violation and perhaps a change of trend.
Peter G,
I have just noticed that you had responded several hours ago to an earlier post I had made. Not quite sure how I missed your response. Thank you and I didn’t mean to keep asking similar questions. Very much appreciated!
It’s midnight est. PPT needs top step in here right now.
*to
Just back from vacation. We where on Fridays dicline to today=low.
7/2 we can make a higher low but the high is on friday (close?) Then again a decline until 13/2 = low (—then up? to the experation day 16/2?)
Longterm is unchanged: 29/1 High, 23-25/2 Low, 9/3 High and 29/5 Low (it can change if 9/3 is not predicted as a Low from two indicators Next weekend I hope to be sure)
Willem…check the message in the World Cycles Institute Forum…please let me know what you think!
sorry, I don’t know witch one. You must know I am an old trader. I have sent the FIRST WAVE DOWN WITH DATES to Peter. I don’t know how to publish it.
i wil make a new message now
so ………………hmmm……….
with the potential demise of XIV [its 90% loss after hours]……the “slam the vix” trade, which induces the risk parity algos to bid up equities, is seemingly OVER….
how then, does one RIG the market – with this heavy lifting tool gone?
my thesis is — they can’t…………………….THUS we get zigzags down in a waterfall progression…..
the next move after the A, is a shallow sideways B wave, which sends us into a C wave down etc…………………. see chart example………..https://invst.ly/6jxes
here is the ES overnight…..i added an additional small degree…..https://invst.ly/6jx7q
note to red…………..
i am going to tackle that bitcoin chart again today……!
saw a twitter comment on $XIV LAST week….that something was amiss.
today saw Sam make a comment on it:
https://twitter.com/smartertrader/status/960855111659671552
also ::
https://twitter.com/vixcontango/status/960866315195076608
oh yea.. you would think that w/all this carnage in the stock markets — that GOLD futures would be SKY HIGH or that $TLT would be through the roof.
this is what’s CON.fusing to me.
recall also beginning of THIS year – 2018 — looking @ MY NUMERO UNO indicator for daily movement of $SPX — it was going south — YET $SPX was going north. commented on this one in one of my posts.
anyhow — this is quite fascinating.
watching Bitcoin, Oil, Bonds, Gold and some other indicators.
some of the guys who did charts on Bitcoin/Crypoto currency are:
Ted Aguhob https://twitter.com/wavegenius
Chris Carolan :: https://twitter.com/spiralcal
for any VIX’en info — Vance Harwood’s the guy :: https://twitter.com/6_Figure_Invest/status/960882422190456832
check his site in his bio
hmmm…….one is left to ponder if the market is broken……….. with the termination of XIV…………..
the algos are in a right state now!!
https://invst.ly/6jz4w
/ES 2529 I’d like to see it retested sometime during the day to make sure it’s a firm short-term bottom.
Was XIV terminated?! Who dunnit? Was it a SKYNET T-5000??!! 😀
sorry — the url for the charts is ::
https://www.elliottwavetrader.net/scharts/Charts-on-S-P-INX-Russell-IWM-201802051783.html?utm_source=WW&utm_medium=email&utm_campaign=AviSPX
well.. my trading platform was down 1st thing this a.m. — honestly — you’d think w/all the dough they taking in they can’t have state of the art software to keep it humming all day long ? excuse for not having a run at the “bank” so to speak.
anyhow — the $BPSPX down to 57.20 — opened @ 66.40 — the low was on election night 2016 @ 50 and the lowest Feb 12, 2016 @ 27.60 — something to ponder, eh!
July 24, 2002 — the lowest was @ 12
Expect more of that crap as all hell breaks loose…
This website is for educational purposes relating to Elliott Wave, natural cycles, and the Quantum Revolution (Great Awakening). I welcome questions or comments about any of these subjects. Due to a heavy schedule, I may not have the time to answer questions that relate to my area of expertise.
I reserve the right to remove any comment that is deemed negative, is unhelpful, or off-topic. Such comments may be removed.
Want to comment? You need to be logged in to comment. You can register here.