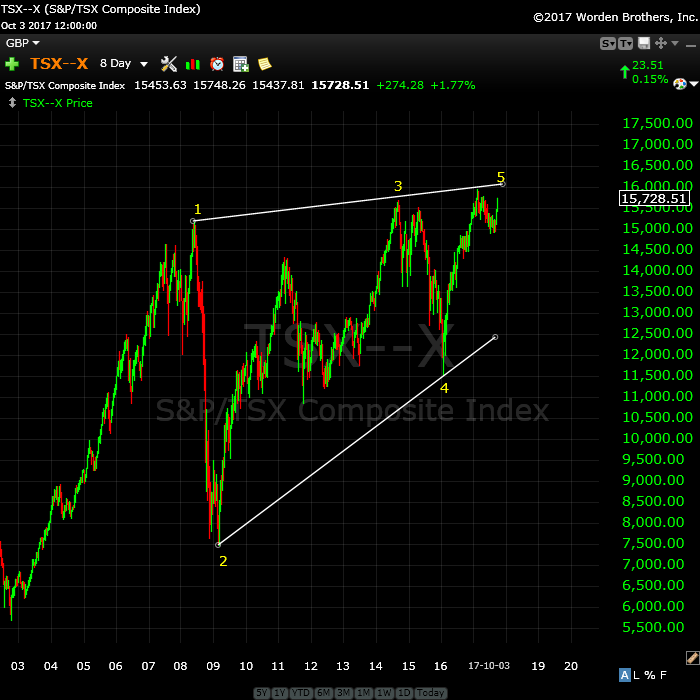
A Textbook Ending Diagonal

An 8 day chart of the Toronto Stock Exchange. I don’t think it requires much of a comment.
_____________________
The Reluctant Fourth
We’ve seen this story before in this market, particularly with ES/SPX. The waves rally just as far as they can legally go and then when everyone “gives up” and turns bullish, they turn down. Here we are again!
I have multiple measurements (along with potential cycle turns, and even Tom’s energy charts) that point to the US indices having completed a top at the end of the Friday session.
Once again, we’ve traced out a wave to absolutely the maximum length it can go under Elliott Wave rules. We are at the top of the third wave of an ending diagonal. Any more than about two points more will break that ending diagonal. We also have fibonacci measurements that target 2517.33-9. This is the final fib measurement and means that the C wave is 1.618 X the larger A wave of the third wave up. This is one of the few times that the smaller a wave (I go through this in today’s video) hasn’t provided the definitive target. However, the wave has hit a strong fibonacci target based on the larger A wave and this is very good news. There are multiple valid measurements that target this same point, which is added weight to a turn here.
There is one further potential turn area, and that’s 2525. It’s the most extreme fibonacci measurement of the A wave of the final zigzag of the fifth wave up of wave three. Above that and the ED breaks.
While you may care little about the specifics, my measurements now give me confidence measuring ending diagonals, which are considered somewhat of a rogue pattern (this is the second major ending diagonal I’ve concentrated in in the past few months). I don’t think anyone else knows that power of fibonacci in ending diagonals. A first!
What it means is that future ending diagonals should prove much easier to predict—in terms of ends of waves. Even though this particular third wave of the ending diagonal has been a real dog to predict the top of, it means we’ll be able to pinpoint the bottom of the D wave (may have more than one target) and the final wave to the final high, with much more confidence.
One Market, Two Waves, One Trade
The “obvious” characteristic of this market as a whole is how everything is moving in tandem now to the final target.
There are in still two waves left in the US indices; that’s clear. We have a fourth and fifth of an ending diagonal to complete (the Nasdaq indices and futures have the balance of a fourth to complete, along with a final fifth). They should turn in tandem through to the end of their respective patterns.
There is really one one trade left, because everything is turning together and moving together to the final top. But, we’re not there yet.
For example:
The US Dollar looks to be forming an ending diagonal, which would take it down to its final target.
USD currency pairs have, for the most part, one more wave to a final target. Some have less. For example USDCAD is at a point that if an ending diagonal is forming, it also has two legs left.
Oil is turning down. It already has or it will rise up once more to a double top before the wave down begins to the $32 level.
Gold has turned down and it’s about ready to turn up in a second wave. Measurements strongly suggest we’re going to see a B wave and a final C wave to end the pattern down to the 1122 area (or slightly lower) before a turn up with a large wave that should target close to 1600. The bottom of this set of waves down should coincide with the top of the US market, which I’ve been saying for some time, of course.
Treasury bonds are also topping, setting up for a large 5th wave down.
If you look at the DAX and AEX, you’ll find that they’re in their final waves, heading for an all time high and the top of the bull market. They’ll all top at the same time as the US market … in a few weeks.
It’s all coming together.
_______________________
The Market This Week
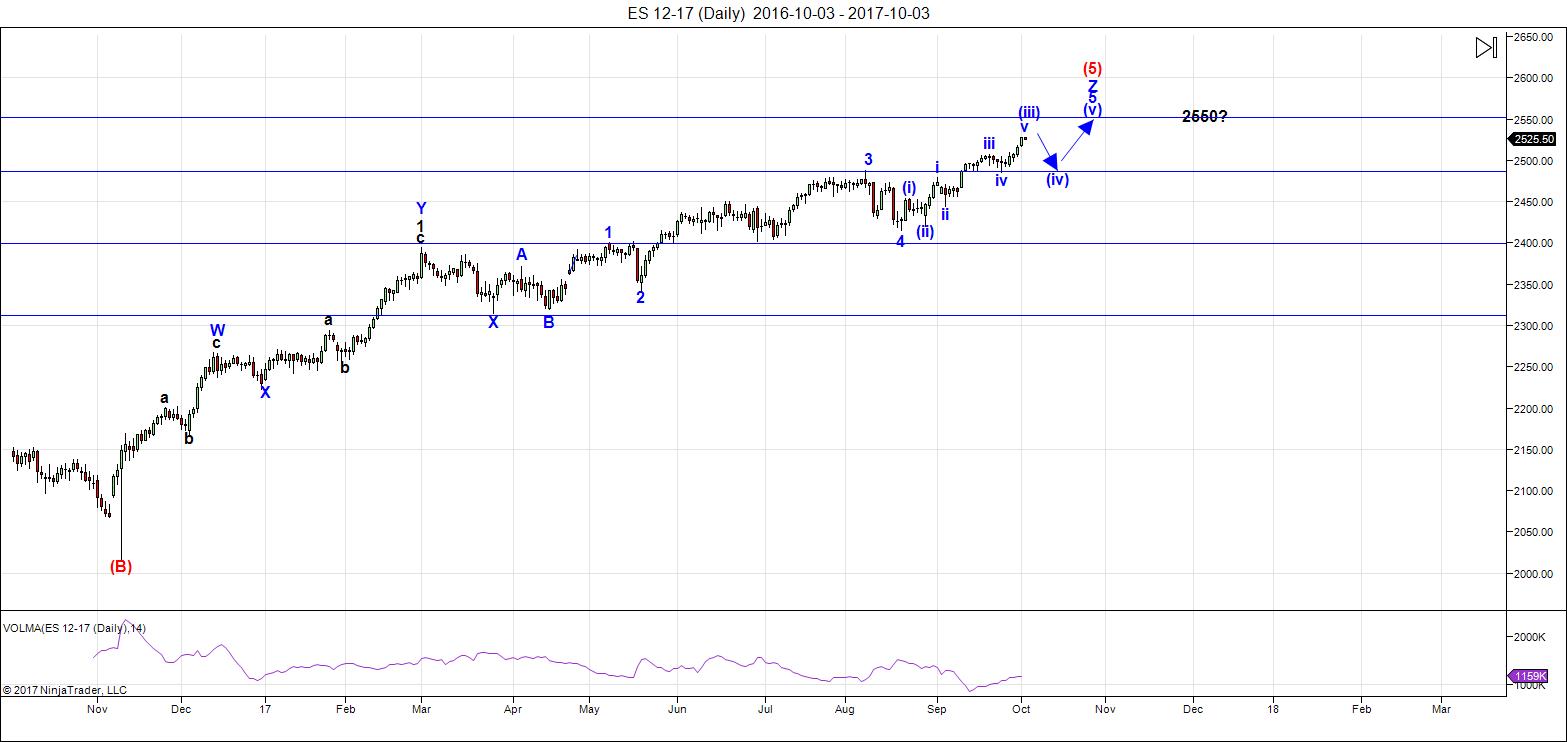
Here's the latest daily chart of ES (emini futures)

Above is the daily chart of ES (click to enlarge, as with any of my charts).
UPDATED (Oct 3 after the close): We rose above my final target of 2517 and after careful review, I’m relegated the ending diagonal the trash bin. Today’s continued wave up has given us what looks like a third wave top (particularly in SPX, which shot up in what would be a typical third wave blow-off).
I’ve now labelled this final wave up as a wave in five waves (1-2, 1-2 complex wave), which means we have a larger degree fourth wave to complete, which should drop to the previous 4th as shown, and then turn up in a final fifth wave to the 2550 area (my current measurements show the 2545 area, but this could change, based upon the depth of the 4th wave.
We likely have a little more upside in the third wave, based upon a double second wave within the ES wave so far. Expect a double fourth and fifth of the third.
Overall, little has changed. The biggest change is that the fourth wave is going to be much smaller and the top of this market is much closer!
The waves up are very obviously corrective and this will lead to a very dramatic drop once we've hit the final target. More on that once we get into the final 5th wave.
___________________________
Trader's Gold Subscribers get a comprehensive view of the market, including hourly (and even smaller timeframes, when appropriate) on a daily basis. They also receive updates through the comments area. I provide only the daily timeframe for the free blog, as a "snapshot" of where the market currently trades and the next move on a weekly basis.
______________________________________
Sign up for: The Chart Show
Wednesday, October 11 at 1:00 pm EST (US market time)

The Chart Show is a one hour webinar in which Peter Temple provides the Elliott Wave analysis in real time for the US market, gold, silver, oil, major USD currency pairs, and more. You won't find a more accurate or comprehensive market prediction anywhere for this price.
Get caught up on the market from an Elliott Wave perspective. You’ll also get Andy Pancholi cycle turn dates for the SP500 for the balance of the current month. There’ll be a Q&A session during and at the end of the webinar and the possibility (depending on time) of taking requests.
All registrants will receive the video playback of the webinar, so even if you miss it, you’ll be sent the full video replay within about an hour of its conclusion. For more information and to sign up, click here.


I agree that 12-16 Oct should be an important high for now. After that down into a low per 25-30 Oct (I can’t pinpoint it exactly). Depending on what decline we will see, I say 1. The TOP is in or 2. More blow off to come. I hope 1. but I learned since a few months to not be biased anymore, so I go with what I see and the different techniques tell me.
The larger scenario that Andre is giving (down into May 2018 for starters), seems logic when 1 is going to play out!
Cheers,
W
I have a target in mind for /es or spx. If it goes beyond that number then it negates my theory. My question, however, does it get hit before Peter’s “larger degree fourth wave” or is it Peter’s 5th wave top? Since the number is sooo close I’m inclined to think it’s the elusive third wave top but right now there are no clues for a higher number for me.
The final thing I wanted to say about the coming bear market is that despite its being the biggest bear market of our lifetimes, I suspect few will really take advantage, and the reason is simple. First, few people seem to remember their history, or perhaps never learned it. Bear markets unfold much more swiftly than bull markets do.
Furthermore, central banks have so corrupted and distorted the mechanisms of price discovery that you actually have people now thinking that markets can go up forever, and will view every decline as a buying opportunity. I actually had someone chastising me for talking about a mean reversion principle, and who insisted that when it comes to market price there was no such thing. Bullish sentiment is now so firmly entrenched, it is going to take a substantial decline, probably thousands of points in DJI, before the herd even begins to awaken to the reality of what is unfolding. I know this goes against the grain of core EW theory which posits that sentiment changes before price does. I think bubbles could be an exception and we are in the mother of all bubbles. I think this thing could be half-way over before people really understand what has happened, and by that time of course the best opportunity for taking advantage will have passed.
I will be back after the first 1000.00 DJI points to the downside, and observing with great interest until such time. ‘Bye all, and all the best!
A new free blog post is live at: https://worldcyclesinstitute.com/the-top-is-at-hand/
This website is for educational purposes relating to Elliott Wave, natural cycles, and the Quantum Revolution (Great Awakening). I welcome questions or comments about any of these subjects. Due to a heavy schedule, I may not have the time to answer questions that relate to my area of expertise.
I reserve the right to remove any comment that is deemed negative, is unhelpful, or off-topic. Such comments may be removed.
Want to comment? You need to be logged in to comment. You can register here.