
A Textbook Ending Diagonal
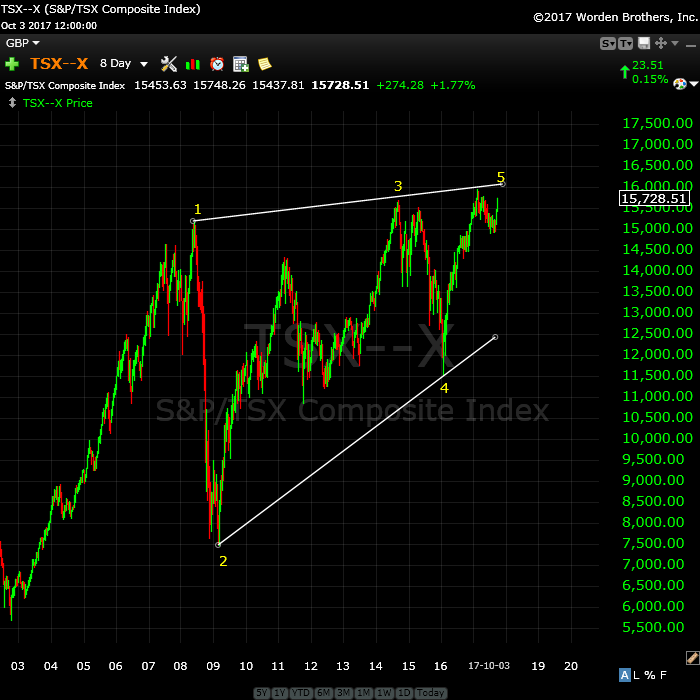
An 8 day chart of the Toronto Stock Exchange. I don’t think it requires much of a comment.
_____________________
The Reluctant Fourth
We’ve seen this story before in this market, particularly with ES/SPX. The waves rally just as far as they can legally go and then when everyone “gives up” and turns bullish, they turn down. Here we are again!
I have multiple measurements (along with potential cycle turns, and even Tom’s energy charts) that point to the US indices having completed a top at the end of the Friday session.
Once again, we’ve traced out a wave to absolutely the maximum length it can go under Elliott Wave rules. We are at the top of the third wave of an ending diagonal. Any more than about two points more will break that ending diagonal. We also have fibonacci measurements that target 2517.33-9. This is the final fib measurement and means that the C wave is 1.618 X the larger A wave of the third wave up. This is one of the few times that the smaller a wave (I go through this in today’s video) hasn’t provided the definitive target. However, the wave has hit a strong fibonacci target based on the larger A wave and this is very good news. There are multiple valid measurements that target this same point, which is added weight to a turn here.
There is one further potential turn area, and that’s 2525. It’s the most extreme fibonacci measurement of the A wave of the final zigzag of the fifth wave up of wave three. Above that and the ED breaks.
While you may care little about the specifics, my measurements now give me confidence measuring ending diagonals, which are considered somewhat of a rogue pattern (this is the second major ending diagonal I’ve concentrated in in the past few months). I don’t think anyone else knows that power of fibonacci in ending diagonals. A first!
What it means is that future ending diagonals should prove much easier to predict—in terms of ends of waves. Even though this particular third wave of the ending diagonal has been a real dog to predict the top of, it means we’ll be able to pinpoint the bottom of the D wave (may have more than one target) and the final wave to the final high, with much more confidence.
One Market, Two Waves, One Trade
The “obvious” characteristic of this market as a whole is how everything is moving in tandem now to the final target.
There are in still two waves left in the US indices; that’s clear. We have a fourth and fifth of an ending diagonal to complete (the Nasdaq indices and futures have the balance of a fourth to complete, along with a final fifth). They should turn in tandem through to the end of their respective patterns.
There is really one one trade left, because everything is turning together and moving together to the final top. But, we’re not there yet.
For example:
The US Dollar looks to be forming an ending diagonal, which would take it down to its final target.
USD currency pairs have, for the most part, one more wave to a final target. Some have less. For example USDCAD is at a point that if an ending diagonal is forming, it also has two legs left.
Oil is turning down. It already has or it will rise up once more to a double top before the wave down begins to the $32 level.
Gold has turned down and it’s about ready to turn up in a second wave. Measurements strongly suggest we’re going to see a B wave and a final C wave to end the pattern down to the 1122 area (or slightly lower) before a turn up with a large wave that should target close to 1600. The bottom of this set of waves down should coincide with the top of the US market, which I’ve been saying for some time, of course.
Treasury bonds are also topping, setting up for a large 5th wave down.
If you look at the DAX and AEX, you’ll find that they’re in their final waves, heading for an all time high and the top of the bull market. They’ll all top at the same time as the US market … in a few weeks.
It’s all coming together.
_______________________
Couldn’t be happier … KK 2
Couldn’t be happier …The analysis and insight you provide is simply amazing! I’ve been trading the futures and equity markets for well over thirty years and usually average around 5% monthly. Since joining your Traders Gold Service two months ago, that number has better than doubled. I couldn’t be happier.—KK |
Have not had a losing week RW 2
Have not had a losing week …I have been with Peter almost a year. The only thing that matters is have I made money with his service. I think I have finally turned the corner using Peter’s EW. I have not had a losing week in the last 5 months. Thanks Peter, for your amazing amount of hard work. —RW |
the real deal SM 2
The real deal …‘Educational, insightful and thorough market analysis for all levels of traders. It’s Elliott Wave at its best….Peter Temple is the real deal’ —SM |
Tops in your field DZ 2
Tops in your field …You are tops in your field. Tried to follow Elliot Wave international for years. They were always behind the market. After discovering you, I perceive that you are an expert in reading the waves, which puts you way ahead of the rest of your peers. And you can read the Waves like you are reading tomorrow’s financial section. I pray you stay healthy. —DZ |
Get an upper hand … JC 2
Get an upper hand in trading …Seeing all the different currency pairs and the wave structures and hearing you explain why this has to do that on a nightly bases gives one a upper hand when trading. Elliott Wave applies to all stock and indices and can be applied to any candlestick chart. If someone ask what you want for Christmas – Tell them a membership to Peter’s “Traders Gold!”—JC |
The best of them JL 2
The best of them …Last couple of years, I subscribed to several ‘market traders’. You are by far the best of them and the personal contact is awesome. Daily and daily updates are very well written! Besides your expertise in EW, I also like your cycles analysis. Best investment I ever made! —JL |
A true expert in Elliott Wave FL 2
A true expert in Elliott Wave …You are a true expert in EW analysis. What you provide is not available anywhere and is priceless. Subscription on your services is the best thing I have ever done. Many thanks for your effort to make me a better investor. I now have more trust in my investment decisions. I hope you will continue the excellent work! —FL |
Rise above the rest … SM 2
Rise above the rest …I have only ever met a few people who, in their chosen fields (astrology, medicine, music, martial arts, technical analysis), rise above all the rest and you are one of them…you have ‘the gift’…and that’s why I’m a Trader’s Gold member. —SM |
The Market This Week
Here's the latest daily chart of ES (emini futures)
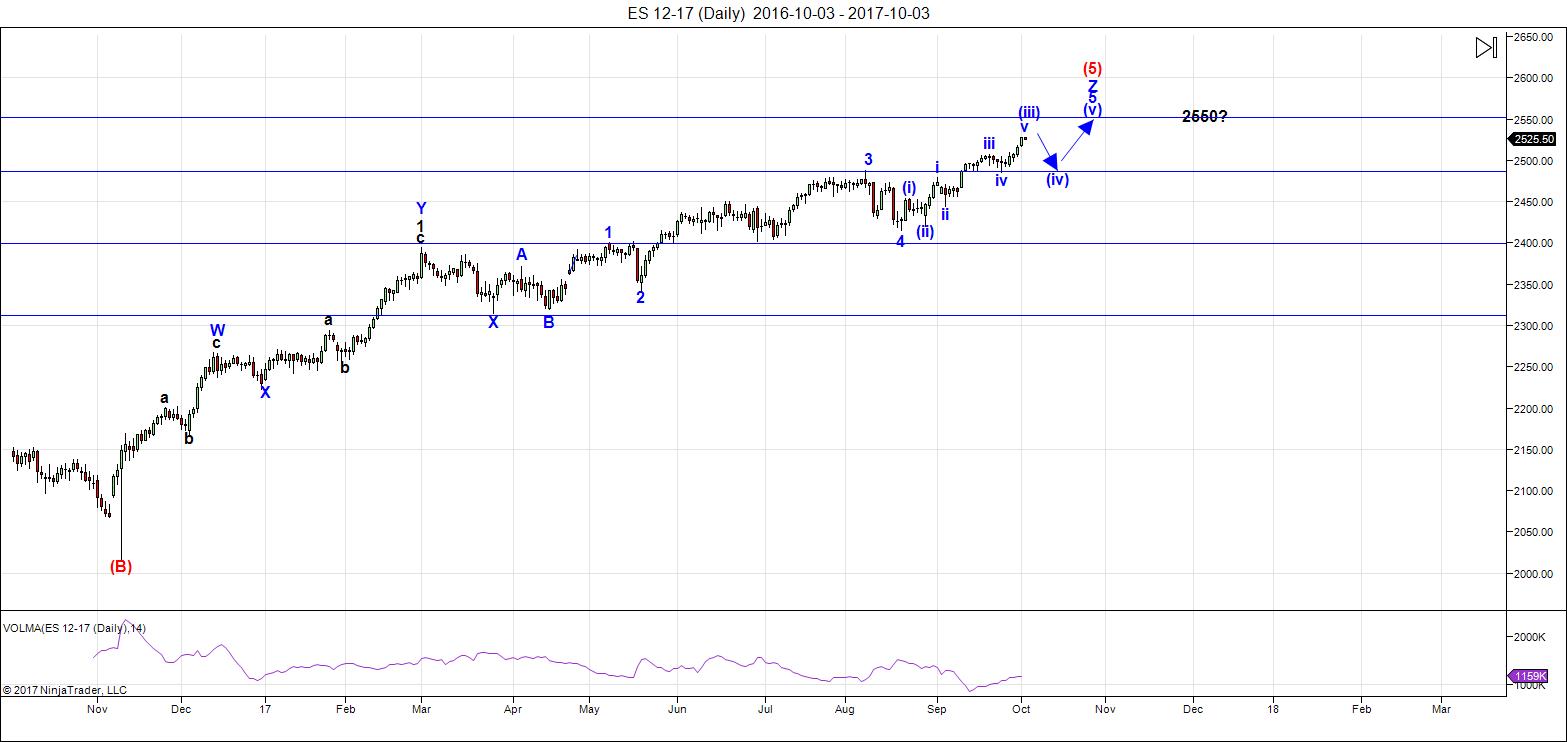
Above is the daily chart of ES (click to enlarge, as with any of my charts).
UPDATED (Oct 3 after the close): We rose above my final target of 2517 and after careful review, I’m relegated the ending diagonal the trash bin. Today’s continued wave up has given us what looks like a third wave top (particularly in SPX, which shot up in what would be a typical third wave blow-off).
I’ve now labelled this final wave up as a wave in five waves (1-2, 1-2 complex wave), which means we have a larger degree fourth wave to complete, which should drop to the previous 4th as shown, and then turn up in a final fifth wave to the 2550 area (my current measurements show the 2545 area, but this could change, based upon the depth of the 4th wave.
We likely have a little more upside in the third wave, based upon a double second wave within the ES wave so far. Expect a double fourth and fifth of the third.
Overall, little has changed. The biggest change is that the fourth wave is going to be much smaller and the top of this market is much closer!
The waves up are very obviously corrective and this will lead to a very dramatic drop once we've hit the final target. More on that once we get into the final 5th wave.
___________________________
Trader's Gold Subscribers get a comprehensive view of the market, including hourly (and even smaller timeframes, when appropriate) on a daily basis. They also receive updates through the comments area. I provide only the daily timeframe for the free blog, as a "snapshot" of where the market currently trades and the next move on a weekly basis.
______________________________________
Sign up for: The Chart Show
Wednesday, October 11 at 1:00 pm EST (US market time)

The Chart Show is a one hour webinar in which Peter Temple provides the Elliott Wave analysis in real time for the US market, gold, silver, oil, major USD currency pairs, and more. You won't find a more accurate or comprehensive market prediction anywhere for this price.
Get caught up on the market from an Elliott Wave perspective. You’ll also get Andy Pancholi cycle turn dates for the SP500 for the balance of the current month. There’ll be a Q&A session during and at the end of the webinar and the possibility (depending on time) of taking requests.
All registrants will receive the video playback of the webinar, so even if you miss it, you’ll be sent the full video replay within about an hour of its conclusion. For more information and to sign up, click here.


Thanks again, Peter.
I have an EW question. I know in the EWP book on pages 57-58, Prechter attacks Elliott’s idea of an “Irregular Top.” What is your view? Will a B wave sometimes reach a higher high following a fifth wave extension?
I don’t pay any attention to the “irregular top” concept. What Prechter’s book doesn’t go into in detail is the importance of fibonacci measurements (he just touches on them).
The issue with irregular tops is whether the count is correct between a third and fifth wave. By measuring the waves, you can determine what’s going on. A third wave will be 1.618 X the first (or 2.618 in an extension situation) in almost every case. The fifth wave has the same characteristics. So, doing measurements will help you determine what wave you’re in.
I don’t find situations in which the normal progression of waves is not obvious once you take into account the measurements.
peter,
as an “aside” – truly one of the greatest minds of our current day – Marko Rodin, has created a brand new mathematics “vortex” mathematics. This mathematics has never existed before as far as we know [maybe the ancients used it].
Using his mathematics, the numbers themselves become the building blocks for the entire universe [versus being conceptual representations of it]. I have been communicating with marko for help understanding various particular numbers [pi for example]……. As for the fibonnaci numbers – his mathematics shows very clearly that numbers are in fact – a number sequence detailing “an electric circuit”, and this electric circuit is ubiquitous throughout all torus “structures” of the universe…….
That sounds really interesting.
reread your “own” words above as you “describe” the fib importance in an ending diagonal…..what you are describing is in fact the absolute requirements for an electric circuit to exist.
To exceed any circuit is to “break” that circuit, upon which electrons can no longer flow. – which is why markets “turn” {or loop} – if it failed so to do, the market “flow” will permanently “break”.
Humans are electric circuits, and once our “circuit” breaks – we are called a corpse……..
this could be why the markets are reflective of humans because they are both based on their “circuits” and the limits of circuits [fib levels], rather than based on some false understanding of “sentiment”and sentiment extremes… …….
Does this gentleman have a site somewhere? More info?
Many traders incorrectly assume a wave count is wrong if the market’s corrective wave exceeds the previous motive wave high but this can and does take place with expanded flats, so technically wave three could have already topped with us now finishing a b wave of wave four. Of course this labelling would negate the ED since there the subwaves all have to be zig zags..l
There are no motive waves to be seen anywhere near anything to do with SPX/ES/NYSE, etc.
Any wave that advances the trend is motive.At least that is my understanding. If we just completed a third wave the trend was clearly up. My point was simply that a new all time high did not necessarily mean the trend was not down if the fourth wave was an expanded flat. In that sense I meant the recent possibly completed third wave was motive, and the fourth wave, if underway, corrective. Discussion of trend can be tricky as it obviously depends on your time frame.
Your first sentence is absolutely false, as I have explained again and again here. You’ll also find an explanation of a motive (or impulsive) wave several times in the Elliott Wave Principle. Please don’t spread inaccurate information about EW. If there’s anything that gets my back up, that’s it.
PLUS, we’re in a countertrend wave (it’s corrective up from 2009), as I’ve explained many more times.
Are you saying Peter that an Ending Diagonal is NOT a motive wave? Prechter and Frost define motive waves as waves that sdvance the trend and I will post the reference if you like. I realize that not all motive waves are impulsive. I also understand that within a larger context you view the entire move from 2009 as corrective as of course b waves are. Even though that may be true, the trend the last 7 years has clearly been, and continues so far to be up. I am more than a bit puzzled by the point you are trying to get across and not at all understading what is incorrect about what I wrote. 🙂
That’s not what you wrote. You wrote, “Any wave that advances the trend is motive.” That is not correct.
An ending diagonal in a C wave is not a motive wave. It is only classified as motive if it’s at the end of the motive sequence (ie – in a fifth wave). C waves are part of an abc sequence, which is corrective.
Thanks!
Prechter and Frost define motive waves as waves that advance the one larger degree trend. Clearly a corrective wave does not advance the larger trend. I am a bit startled that you think I am not aware that a corrective wave goes AGAINST the larger trend. I am gong to leave that topic alone as we seem to be completely at odds as to what we are talking about here Peter, no offence.
The C wave is you choice of labeling the current movement Peter. That is not the only way to label the current upward movement that meets EW rules.
Enlighten me with a chart.
http://rense.com/rodinaerodynamics.htm
https://www.youtube.com/watch?v=unqKSfZfzho&list=PLr6U3JfQRaDSITH-XQiZOZL2Ks4FB9ZZa
Very cool stuff. Joe will be all over this.
Tks, Red Dog!
https://www.youtube.com/watch?time_continue=363&v=YN2LBO8wig8
Could be right
Hi Peter, with ES hitting 2523.5 does this change the count at all?
Thanks for your hard work on this.
No, I don’t think so. It’s difficult to near impossible to accurately call the edge of the ending diagonal because you’re dealing with to trendlines that must converge. The slope makes it difficult to pinpoint the number at which the trendlines become parallel.
There’s one last measurement that extends the C wave of the final wave up to 1.618 X the A wave, and that number is 2525. I think that’s right on the edge of the ED, but it’s hard to say for certain. So, I believe the ending diagonal is still active, but 2525 would be “it.” Any higher than that and I think the ED is broken. However, with a very obvious corrective wave up, I don’t have an alternative. It’s the ending diagonal at 2525 (or below) or I don’t know what’s going on.
Since 2009, we’ve been in a corrective wave … a B wave. The final high will lead to a C wave down with the DOW eventually under 3K.
Here’s the “personality” of the B wave from the Elliott Wave Principle”
“B waves are phonies. They are sucker plays, bull traps, speculators’ paradise, orgies of add-lotter mentality or expressions of dumb institutional complacency (or both). They often involve a focus on a narrow list of stocks, are often “unconfirmed” by other averages, are rarely technically strong, and are virtually always doomed to complete retracement by wave C. If the analyst can easily say to himself, “There is something wrong with this market,” chances are it’s a B wave.”
Peter T,
Any comments on “Social Mood” with all that is transpiring over the past month or two?
I’m working on an article that will fit your query.
Peter T,
Looking forward to what you write!
There now.
It looks to me like the analog of the July to August run is playing out. If so, we should get turn today. DJI has an important fib number around 22,496.00. Futures pointing higher.
I just took another look at Prechter’s definition and I did omit motive waves adance the trend “of one larger degree” 🙂
Hi Peter, what is the maximum the 4th wave can come down to before we head into the 5th and final?
Peter, es high of 2525.75 as of this post. Are we counting chump change to eliminate the ending diagonal ?
I’d say we’re still ok. I can’t be that accurate.
Keeping in mind that so many bearish signals of late have failed to pan out, the long upper wick on SPX this morning could be important. Nasdaq also sporting a long upper wick after new ATH. Bulling engulfing candles would I think strengthen the case for an imminent turn…FINALLY!
VIX divergence this morning has also been a heads-up.
Oops! Meant to say bearish engulfing candles..but you knew that! 🙂
Nasdaq already in the red…
In light of your comment about the NASDAQ, Verne, take a look at the so-called market leaders today from the opening bell…the FANG stocks, FB…AMZN…NTFLX…GOOG Leaders?
Indeed Peter G. It is quite amazing the NASDAQ is printing a green candle today. The three most difficult words in the English language is:
“I was wrong!”
A few weeks ago McHugh expressed some doubts about his alternate expanded flat for a wave four and voiced the opinion that we could possibly be in a final wave up. The new ATH for SPX was not particularly a problem as b waves of expanded flats by definition go past the price extreme of the A wave. I think guidelines recommend they be discarded if the B wave goes past 2X the A wave. At any rate, McHugh opined that if the expanded flat was wrong, we could see a target for DJI of around 23,000.00 when it would meet the upper boundary of a large rising wedge. At the time I thought he was nuts. It certainly seems as if a lot of us were wrong in judging the bullishness of this market. I remain heavily short IWM, as there are too many other things telling me that this move is probably terminal. Clearly one has to hedge under these circumstances. It sure looks to me like for now the banksters are still firmly in charge! 🙂
Those of us who have been around a while know that valuation levels cannot be used for market timing…and whose valuation definitions are you using anyway? For my money, John Hussman has the most accurate long term valuation indicators. He has been early in his determinations of where markets might turn, but his 10-12 year projected returns have been remarkably accurate historically. With all that in mind, here is a quote from Hussman last week. What a fabulously descriptive statement about the current market status and current psychology. The article is entitled “Bubble Psychology” and the sub-headline is the following quote I am referring to: “What investors presently take as a comfortable environment of pleasant market returns and mild volatility is actually, quietly, the single most overvalued point in the history of the U.S. stock market.” What a perfect description!! (I love the “actually, quietly”). I emphasize again that valuations should not and cannot be used for market timing…
I hear ya. The thing that tells me we are in Wonderland along with Alice is the way VIX is trading. If anyone ever needed proof that the theory of efficient markets was a pile of horse feathers there you have ample proof! We have there an unprecedened divorce from reality, thanks to central bank liquidity.
My smaller degree iii wil be equal in length to the smaller degree i around the 2530 area. I’m assuming we turn there, or it may keep running.
let’s keep rolling
We continue to see bearish signals morph into something else before our very eyes!
I mentioned the SPX upper wick that got completely absorbed. Now we also have a hammer in TZA that has also morphed into a solid red candle. Does anyone really believe that CB liquidity has been withdrawn from these markets?
I guess I’m getting different signals, but this market should be bullish for awhile. But it will have pullbacks, IMO. We still have a larger 4 pullback coming after this smaller iii up, smaller iv, and smaller v is complete.
Yep. I do think it is an impulse up of some kind. Nonetheless, volume continues to be tepid. OBV to be honest, has been also quite bullish the last week so the signals have been mixed. Of course, volume has been falling for years and that has not stopped the bullish price action lol! 🙂
Yep, very strange, but it has been nice on this long run up being on the right side. I have no complaints.
IDK Peter, can a 3 point over ES 2525 really make that big of difference in a final wave of a 500 yr cycle? Just hate to give up on the count.
The issue I have is with ES in that the trendlines now look parallel, but I don’t have a way to determine whether they are or not, so we’ll need to see what happens overnight and into tomorrow. I don’t have an issue with SPX or NYSE.
Charles, after more than a couple of hours of analysis, I think the ending diagonal is dead. I don’t like the look of the third wave, as well as the resulting count (and subwave lengths). I will post an alternate count a bit later tonight. All it will change is the depth of the 4th wave. It puts us closer to the final top by quite a bit.
I’ve trashed the ending diagonal after we exceeded my target. This puts us much closer to a final top and I’ve replaced the daily chart within the blog post.
The only real change is that the fourth wave is going to be much smaller than it would have been in an ending diagonal. The final wave ends up being about the same length as it would have been, although it could extend.
To err is human…! 🙂
Still waiting for those charts so that I can learn about EW!
I really like the way you keep changing your predictions.
It’s only been around a year that you’ve been calling for a top, well done.
One day wave 4 is behind us, the next day it’s still ahead.
Really useful.
Good job your commenters are more accurate than you.
Out of the ten assets I analyze every single day of the year, I like to change my count in ES about twice, whether it needs it or not, just because I know it royally pisses you off, and that, my friend, gives me EXTREME pleasure!
Mike: Your comments are rude, thoughtless, ignorant and inaccurate….maybe you should spend your time elsewhere. As a Trader’s Gold member I find Peter’s insights and guidance invaluable.
The value of the site is the consistent application of EW across all asset classes. Due to recent changes in ES trading due to algos and the increased capital inflows of CBs into ES and other broad equity categories (and the 20 trillion in savings the Chinese have looking for higher returns), the apparent market patternicity has become more random and market timing based upon EW (and all other market timing methods based upon cycles) may become less effective (algos don’t have waves they are binary on/off systems).
Thanks for the update Peter. Do you see $ finishing an ABC around 94.1 here or could the low already be in?
I’ll be changing the free blog to feature different assets, not ES any more. It may show up on occasion.
Hey Verne, can I have your email?
vernecarty@msn.com
Peter, as a trader/investor of over 40 years, I implore you to ignore the trolls. Nobody, and I mean nobody knows where the market is going with 100% certainty or they would rule the world. EW counts change like the wind. There are more cycles in play than at a Schwinn Bicycle factory. TA has been broken time and time again. Day trading is the best way to lose all your money. It is a game of chance, luck and probabilities. As a longer term investor it not that hard. The market goes up about 90% of the time. The trick is not to get caught in a bear market correction, but if you do, the market always comes back ( age and risk factors should be considered). When the market passed spx 2350 I posted here that the bull market will continue. Time not known, but after a pullback to spx 2250 area, we will see spx 3000 area before the next bear market back to the spx 2250 area. This what I think, but I always keep an open mind to alternatives such as yours. As I have said before, many readers come to your site for your analysis only. I hope you will continue to post an SPX related chart.
Mike, I would say that we are surely getting valuable EW info and prediction for free in this blog. I have been watching diff markets for 25 years and was subscribed to EWI & many other services for decades. They all have been consistently wrong in predicting top since 2010. In this regard, if Peter Temple is calling for top since 1 year, it’s not bad at all. Also, EWI always talks about 11-12 patterns and multiple scenario vs Peter sticks with 1 or 2 possibilities. As compare to other experts in the market, his work is really good and I truly appreciate it.
I know tech analysis is not working good, since 2009 due to unbelievable control and manipulation by Fed/CBs using advance technology. I can’t still comprehend that there is team called “PPT”.
thanks, God Bless All!
bp
I agree with bp. No analysts is 100% accurate nor should anyone expect them to be. There is no way I am going to criticize any analyst trying get a handle on this tough market. As you pointed out, this blog is free, and everyone is free to disagree with Peter’s perspective as some of us sometimes do. The bottom line is I am responsible for executing my own trades based on my own due diligence.
Having said that, I can understand the frustration of folk who make bad trades and feel they have to point the finger at someone. I think this experience prompts people to make sarcastic remarks and in my humble opinion unless it becomes abusive, they should be ignored. I think the way Peter who is clearly a very able and generous host, responds to these folk elevates those comments to a place entirely undeserved. No offence Peter. Just saying this a friend. 🙂
bp,
I am with you!!!!! Mike – simple thought here – “do you own homework” – responsibility for charting begins and ends with “the self”…………. We are talking a “500 year cycle” here – to be off by one or two years in 500, and to adjust your EW count on occasion is mathematically “EXTREMELY ACCURATE”!!!
I have been posting [since 2014] the “same” broadening topping pattern chart of the RUT. Do you know how many times i have called a top…..and how many times i have screamed “BE WARNED”!! …….. During this entire time – peter has stayed consistent saying “no its not the top”………. AT times it was difficult to accept peter’s call, but I personally respect his consistency, and as a result, i respect his judgement.
[For the public record, as an aside – peter has kicked my “butt” for me calling my chart pattern as an “EW ending expanding diagonal pattern”….. Fair enough – he is in fact technically accurate – as this is really and truly a non EW ‘broadening topping pattern’]……..
So once again, i post my RUT charts, and if you look at the short term one, it has overthrown the pattern in a spiking/ vertical motion. This indicates to me, the top is at hand – BE WARNED!!!!!
short term – https://invst.ly/5b-e2
medium term – https://invst.ly/5b-gc
btw,
this chart is borrowed from shanky – but i was unable to get in one snapshot the entire move of the spx from 2009, so i am using his spx weekly chart. We are so close to the upper blue line, methinks we tag it for a top……. thoughts?
http://stockcharts.com/public/1129702/chartbook/183530378;
I know Peet a little and I find it sad to read that some have no clue about the amount of passion, time, energy, work etcetera that he puts in and what he is doing in comparison to others… Trading and analyzing are the hardest workfields one can imagine!
Peet, stay true to yourself and keep your focus and energy for those that can and will listen.
Cheers,
W
To clarify, there are two “Mike”s on this comment page. I made the initial query into irregular tops and posted a thank you for the answer. To avoid further confusion and not to be confused with trollish behavior, I will post as MK. Thank you.
Luri, In my opinion,
RUT – short term top is probably in place today.
DJT – short term top could be probably tomorrow.
However, both of them will make new top after giving 3-4 pct reaction.
Anyways, I’m not doing daily trading, so, it does not make much diff for me even if it’s 5-7 pct move. I’m waiting for long term bear market which is due since long time.
thank you
bp
Peter
Thanks for the update 🙂
I think some people don’t realise the time and effort
That goes into these free posts ,
I also feel anyone who cannot take responsibility for
Their trades should not be trading .
Luri and red dog
Thank you for the intro into vortex mathematics
And yes red dog it blew my mind 🙂
The interview was also a key piece and I will
Look into it .
Over the past month I have been reading up on AI as well as deep learning .
I looked into because I wanted more info on what hardware you need .
How much ram on a gpu what type etc…. Then I dug into financial software
And realised that what I want in my software I can’t find . So I dug further
And found something close but it’s expensive and would need to be customised
( 25 bucks an hour to do the modifications ) in the end I would own the code
So that is on the list yet for another day .
I learned more on bits and pieces , mother boards cpu gpu ssd or using 2 ssd in a raid .
Then I found my starting point . The cost will be cheaper , I won’t need more hardware
Yet I discovered that I have plenty of horse power to work with on my latest computer build
And room to expand if need be , larger gpu etc. Yet the next step up it gets expensive big time
And at the moment it’s not needed . Datanitro I’ll test out for 200 bucks after I use the 30 trial.
I’ll run excel through in real time and then once I get that working I can Begin my automation
Process . Then once it’s refined I’ll go with the expensive software and the modifications which
Will be my own specific instructions .
I am going to attempt to run that vortex mathematics model through a deep learning or ai type program
The vortex mathematics to me is full of wd Gann as well as Fibonacci and my curiosity has definitely
Taken over , the idea of the donut along with the offset center of the circle .
Whether or not I find anything in it for the stock market is somewhat irreverent to me .
The guy in the interview noted the key pairs and there meaning . Only way to know anything
Beyond is to run it and see .
Peter t
If you do change the asset ? USA treasury bonds please 🙂
Wheat ?? Or lol rough rice lol but no need for pork bellies or lean hogs
10/9 will be a low. But Nyse wants up into 10/6.
10/5 is stronger so Thursday we will make a high and the down into 10/9. Friday will be very bearish. Remember september 2016? SNP make the high Tuesday (=10/3) but Nyse 9/8, Friday was 9/9 and markets declined 2%. This is the 56 week cycle. Will explain why 28 is so important.
Thursday high but Friday big slide down. Monday 9 a low.
I am just about at9 the point of having to concede that this third wave is extending big time. Price action way too bullish to be an expanded flat for a fourth wave correction as I had it at primary degree. The b wave is really srarting to look a bit ridiculous…
So far ,Andre, at the close of Thursday, you are certainly correct. Very hopefully, you will also be right on about tomorrow and this coming Monday !
I have been having all kinds of trouble trying to post a chart of my own feeble attempts at a wave count with no luck. It could be too big a file. At any rate, I am thinking we may be in only finishing the minor wave of the third and this sounds a little crazy as the target for completion of this wave at intermediate degree would be around 2615.
I have to admit I am eating a bit of crow on this as I laughed at McHugh’s projection of DJI 23,000.00 a few weeks ago and now we are not that far from it. I think some of us have been misjudging the bullish potential of this remarkable market. I still cannot believe we have come this far after already being so insanely overbought. I think we still need a minuette four and five to complete minute five and minor three at around 2540 This is nuts! 🙂
New chart at the top of the post
Thx!
I have to say I do like that count although the one I had in mind is two degrees of trend lower. I have been chased by this bull so many times I tried to find the most bullish count I could. While I think so many signs support the more bearish outlook, the bull continues to rampage notwithstading. Price will tell all.
Did you get my email?
Yep!
Thank You Peter for new TSX chart. This seems to be 8 year chart. I think 5 Canadian banks are also forming major long term top. Eventually it will bring insane real estate market down as well.
thanks a lot
bp
Verne
The statement of this market being so insanely overbought caught my attention .
So I ask what is the insanely overbought reading coming from and what is it based on
And is there any comparable reading on this reading in prior history ?
Personally I have realised that many of the typical software packages have pretty much
The same indicators and most everyone uses them which I’m beginning to think is at their
Detriment.
I have been there , fighting and fighting a bull market move believing I was right and the market
Was wrong and it was painful . The truth is the market is always right and it’s up to us to figure out
What it will do next , if we are wrong we except it and move on
One thing Peter has posted numerous times is to look for 5 waves down and then a 3 wave bounce
Back to or near the .62 retrace . I’ll admit it’s a hard rule to stick to but being patience using
Pays off because you can define your risk and you can enter with more confidence.
Selling the top is a great ego boost no doubt yet for me I’d rather just let the market work for me
Than fight it .
The bigger the bull market the bigger the bear market that follows .
We had essentially a 9 year bear market from March 2000 to March 2009
Come March 2018 ( no timing just noting ) we will have 9 years from the March 2009
Lows
Well said Joe, with the over bought indicators creating an illusion.
Boy you sure are right about it being painful for the bears fighting this bull market. I am glad a long time ago I decided to take a scalping approach and while I would have probably done better just holding long or buying the dips with the crowd, I felt greater caution was warranted.
The longer term metric that I think is quite overbought and has been for some time is the monthly stochastics.
Price to sales ratio (NOT earnings per share which has bee artificially inflated by share buybacks) is at unprecedented valuations.
Long time volatility suppression I think is also masking true value at risk.
I have thought these things were true for some time and the market has still not put in a top. All this shows is that extremes can continue for longer than any of us expect.
Of course other indicators like volume, RSI, and ADX I think no longer reliably predict market direction. As you well know, they can remain extreme for extended periods and not necessarily indicate any imminent change in market trend.
It has been a tough market that has seen a lot of seasoned traders throw in the towel and walk away for just that reason Joe.
I have also watched in amazement at how the market demolished expectations of seasonal bearishness expected for both May and September. Another huge surprise was a Gann 30 year cycle that predicted a turn around August that did not pan out in any way shape or form, so the market continues to baffle. In all fairness, there have been a few, including some on this site who thought the bullish trend would continue and they were right, and those of us with a more immediate bearish outlook were wrong. Hope that helps a bit.
BTW, I am still bearish. The final marker for me will be how the market reacts to a retest of the 2470 -2480 price area. A bounce there and I think we are going a lot higher. A decisive break on high volume and only a very brief back-test makes the current break-out upwards questionable, to say the least. At least that’s my personal take.
I know we are not supposed to argue with price but I sometimes wonder how much of what we are seeing of market price action is real.
I cannot help but wonder about this when I look at what has been happening in this country with regard to the blatant lies fed to us by this government and the monumental gullibility/stupidity of the public at large.
Take the recent Las Vegas shooting for example.
Even the most profound weapons ignoramus who listens to the audio of that assault can clearly hear from the tempo, interval, and pitch that there are several weapons being fired simultaneously.
I am so depressed I can’t stand it.
How is it that these lying bastards in the government and in media can get before a microphone and with a straight face tell us there was only one shooter?!
Worse, how is it that they are so confident that the vast majority of the American public are so incredibly stupid as to believe such a claim?
If you know anything about fire-arms, one of those weapons being fired sounded very much like belt-fed high caliber weapon and those things are unbelievably difficult to get hold of. I am not buying it for one minute. As I said, I am REALLY depressed and disgusted by what I think was a wanton act of mass murder that involved far more than just one pyschopath. I know I am going to get in trouble for saying this but I don’t give a rat’s you-know-what.
Verne,
you are good and kind and aware. As you know – human history is rife with the same types of false flags, the same lying and untruths coming from those who pretend to rule, the same psychopathy [again] from those who pretend to rule – and even with all those odds and centuries stacked against the good humans of this human race – 2017 has “YOU” and those like you – who are “HERE” – “NOW” – “TODAY”….. That is a great comfort for the future……… So no need to despair in the little picture, when we can see clearly the goodness of the “big picture”………..
You are so kind luri; I feel better already…
There was a similar massacre back in 11/18/1997 (note the year ending in 7) which killed 60 people. It happened near an ancient temple at Luxor, Egypt. https://www.washingtonpost.com/archive/politics/1997/11/18/gunmen-massacre-60-in-ambush-at-egyptian-tourist-site/e94044a4-9d16-415f-bc78-40c474adc0de/?utm_term=.e0f0dc8b51de
The Las Vegas shooting occurred 10/1/2017 at a venue right across….wait for it…the Luxor Hotel. You can see the pyramid-shaped hotel and the obelisk in the background in the first slide.
http://kcur.org/post/section-las-vegas-strip-closed-after-music-festival-shooting
Verne, you asked “How is it that these … can get before a microphone and with a straight face tell us….” The same people who keep telling us “The wealthy are not getting a tax cut under our plan.” 🙂
Going back to the markets, I think Andre said the 5th may be a swing hi. It turns out 10/5 is Mars-Venus conjunction. Apparently, the last one was 11/3/2015. https://jeffreylhunt.wordpress.com/2017/07/29/2017-october-5-venus-mars-conjunction/ So if this conjunction has any effects on the markets, one can look at the various indices and check out what happened on the date. As a clue, it looks like in the apex part of a pyramid.
….. and liz [cough]……what “date” did this false flag occur = 10/1/2017 …..a 111 day that we “illuminated” previously……..catalonia beatings of voters was also this day….
coincidence? hmmm…… so next up is black tuesday 10/10/2017…….hmmm….
Very tragic day indeed Luri. As Pres. Trump said after the incident,” we can take solace knowing that even the darkest space can be brightened by a single light and even the most terrible despair can be [u]illuminated[/u] by a single ray of hope.”
https://www.nytimes.com/2017/10/02/us/transcript-video-trump-las-vegas.html
LizH,
What is the takeaway from what you posted?
Ed,
Are you referring to the Venus-Mars conjunction on 10/5/17 & 11/3/15? If tomorrow aligns with Andre’s prediction and 11/3/15 then tomorrow should be bullish, a swing high and Friday in the red.
Ideally, /ES will open lower, buyers step in at value low and press the gas pedal.
here is some interesting view I see it elsewhere. just to share across, no other bad intention.
The summer melt-up rolls into the autumn season…
New all-time highs continue to be a near-daily occurrence. The Dow and S&P 500 have had six consecutive positive months and eight straight quarters of positive gains…
I still think the markets have great opportunity to keep going higher. Just because we’ve come a long way doesn’t mean we can’t go further.
That’s rule No. 1 in trading: Markets can always go a lot higher than you think and a lot lower than you think.
Novice traders make the mistake of trying to anticipate the turn — they want to “call the bottom” or “call the top.”
The problem is that mentality can be very expensive, not only financially but mentally as well.
There have been people talking about the top in the market since 2009, and it’s essentially gone straight up. Unfortunately, people factor their own emotions and biases into their trading instead of letting the markets give them the clues as to where they’re going.
Will the market keep going straight up?
No way. But as a professional trader, it’s not my job to predict when the next earthquake or shark bite is going to happen.
Right now you cannot ignore the fact that we are in one of the greatest bull markets of all time. That’s the opportunity in front of us.
When the market does turn, it won’t happen overnight. It’s not going to be a straight-down move.
In fact, it’ll happen in a very recognizable way…
The first step is we need to see sustained “sideways” action. In other words, we need to see a period of time when we don’t make new all-time highs. You don’t have to make this any more complicated than it is.
And by the way, I don’t think we’ve gone more than a couple weeks at most without seeing new all-time highs in the major market indexes.
So you see, a downturn won’t just sneak up on us! Professional traders don’t sit around guessing — they wait for a change in the trend and they act appropriately.
I know there should be a lot of people losing their $$ by shorting the market from 2016 till now. Personally I have been burnt twice in shorting SPX since 2016 too, due to all kind of reason: own 6th sense, prophecy, dream, technical analysis, news. I am not blaming anyone, as this is my own action, and the information is shared freely by kind soul who try to help others with their own ability.
That is why I am sharing my personal experience here. I still believe market is crashing, but the question is when??? I am not going to give up, and will definitely want to take advantage of the next crashed. What I am trying to say here is: do our own diligence, while taking consideration of other people opinion too.
lastly, I would like to thank Peter and commenter here for sharing their view, as always.
I agree with your view Allen. Question: what is it going to do to corporate profits of trucking companies and fast food restaurants when 3.5 million truck drivers and 3.5 million fast food workers in the US are replaced with automated long haul systems and ordering kiosks/burger machines? Answer: going to increase even with the cost of acquiring and maintaining the new machines.
so allen,
if i was a chicken, on a small farm in a large enclosed wire pen – i would be kicking my feet back every night “thinking” – geez, life is good. twice a day we get fresh food, and fresh water, i get fresh air, and a big place to run around and call home. So what happened yesterday, will assuredly happen tomorrow, and the next. This would be “linear” chicken thinking.
That warm day in the fall – which eventually rolls around- the day in which the farmer decides that he needs to put away those chickens into the freezer for winter – well from the “linear” perspective of the chicken – that day is an “impossibility”. In fact, the closer to that fall day – the more “linear” the perspective becomes from the chicken – that absolutely we will get our fresh food – and fresh water as usual. I am sure the chicken would argue this apparent “fact” most strongly……. i think you get where i am going with this analogy here.
how much of the “expectations” and analysis of the market over the last 8 years has become purely “linear” in fashion……i mean, “how many chickens DOES it take to screw in a light bulb?”………….
Great analogy. Perfect for the current mentality
Allen makes some great points and I agree with most of what he stated. I have heard so many folk now confidently what this market is going to do or not do before it turns that it does make me wonder. Normalcy bias can be a dangerous thing. Of course they base that opinion on the fact that prior major turns in the market were preceeded by signals that are nowhere in sight. They could be right. They could also, for more reasons than I care to cite, be very wrong.
Yes Lori, u might be right also… Nobody can confirm right or wrong until it happened. Of course, one should go ahead when he or she think the probability is at their side. If not, one shouldn’t invest at all.
i borrowed this weekly chart from Shanky – as he is able to get the entire move from 2009 in on one chart. Methinks the market is looking to “tag” that upper blue trendline.
http://stockcharts.com/public/1129702/chartbook/379628021;
Great chart. The bubbling up of bullish sentiment is SO interesting. I know the persistence of this bull run has in the minds of many rendered all talk of bearish signs and signals null and void, and frankly, so far the naysayers have been proven right by price action….so far! HOWEVER…since when did a bearish rising wedge cease to be a bearish rising wedge I ask you? Stand by… 🙂
http://time-price-research-astrofin.blogspot.com.au/2012/03/090701-sergey-tarassov-djia-1789-2009.html
interesting
This minuette iii just keeps melting up. After minuette iv completes, i think we could see 2575-2650. Crazy bull market. But who knows.
Oh my, very nice up move.
I think we are looking at the greatest con job of all time. I look at the A/D line, I look at volume, I look at global geo-political risks and I just can’t get that bullish feeling. Someone commented about the market always being right; I would modify that by saying it really depends on right in what time frame… 🙂
I believe this move up is terminal….
Verne, don’t fight it and read into something that’s not there. NO BIAS
I am not fighting my friend, but I sure am reading! 🙂
I hear ya. ?
verne,
i concur. an aritcle from zerohedge “there are no bears left, not a single one” seems appropriate here. I think “no one” truly has a grasp on the true EW count – so all the talk of minuette 4’s, ….blah blah……. for me – is a “fairy tale” shot in the dark of “directional” momentum.
The RUT is failing to confirm the moves up in the dow/spx! We could indeed be at the very edge of completion – finality……. The bearish technicals of yesteryear have been overthrown, and rewritten – it has become old school. And yet – there is a comfort to relying on those old school indicators from yesteryear. why? ……
http://www.zerohedge.com/news/2017-10-05/there-are-no-bears-left-none-not-soul
Absolutely!
Minuette 4’s blah blah blah, you’ve missed a huge run up. Will it turn down at some point, absolutely it will. But why fight a bullish trend such as this one? Makes no sense.
Peter T,
I am the guy with the aol.com email address. I tried to contact you about the Chart Show and about “posts”being moderated. Did you receive any of the emails that I sent you?
I am guessing you did not! I can only guess that you still have trouble with aol.com addresses.
Ed,
I got one email that I can see that reads: ” …not go thru “moderation” every time they post? I have been around for quite awhile!
I am not necessarily complaining…just wondering! I have never posted anything offensive or derogatory.”
I don’t understand it and I can’t email you back due to the issues with your email address. I’m a bit behind in emails, so there could be another … or two. Hoping to get caught up today.
If you’re asking whether you have comments that have been moderated, the answer is no.
Peter T,
Whats your thought on this market, I know you had a line in sand of max 2550, Do you change your thoughts based on this melt up
Not so far. 2550 was where we ended the day. Blow-off waves are typically fifth waves.
Still a bit more to go.
Thanks Peter. I know you had an early october as a turning for this market. My question is do you think we complete bull market here and start going down. When you say bit more you mean few more points. I know you have a multi year bear market start from here kind of Idea.
Peter T
on my laptop instead of my phone so checking to see
if this works better since im now home .
Ed
I think it was you that asked me what level i was watching out for on the cash dow
and i said i did not recall .
that level is 23367-23471 and above that 23523 . those are the round numbers
23467-23471 is the main level which id really like to see not broken yet
if hit ill go short and ill give the market some time to get there .
those levels are based on a retrace of the 2000-2009 bear market and the retrace
of the 2007-2009 bear market .
the 2000-2009 bear market was from 11750.28 to 6469.95 or a total of 5280.33 points . 5280.33*3.2=16897.056 and when added to 6469.95 i get 23367.006
the bear market from 2007 to 2009 was from 14198.10 to 6469.95 or a total of
7728.15 points , that times 2.2 = 17001.93 and that added to 6469.95 =23471.88
i have mentioned before that i use numbers that are not all Fibonacci, the reason i do is because i have seen them work by observation . this method
is far from perfect when coming up with a target by a retrace. the 2.2 and 3.2
extensions are very good for targeting crash lows . that all said its the level
i am targeting .
the june 2016 low at 17063.08 to the july 2016 high ( not the aug 2016 high )
at 18622.01 was 1558.93 points that number times 3.618 = 5640.20
and that added to the November 2016 low at 17883.56 = 23523.76
you can check my math …..
averaging them all together 23367.006 + 23471.88 +23523.76=70362.646
divided by 3 =23454.21 . anywhere near there id say is good enough yet
i would prefer that range gets rejected hard .
i have not been home long enough to update my data to see just how overbought my indicators are so no comment on timing or indicators from me.
Just for grins ill add one more fib extension to this even though it has
no true meaning based on anything . the bottom in august 2015 at 15370.33
the the august 2016 high at 18668.44 was 3298.11 points times 1.618 = 5336.34
and add that to the nov 2016 low at 17883.56 and you get 23219.90.
that gives a wider range from 23219.90 to 23523.76 to keep it simple
ill take the mid point yet you can average them if you wish .
the mid point becomes 23371.83.
im sleeping in tomorrow and im very glad to be home .
Joe,
It is good having you back!
Every action has an equal and opposite reaction
unless its the stock market which of course you never really know for sure.
$hgx at new all time highs
Valley,
How does your PALS system look for next week.
Bill, I still think we are in a multiyear bull market. PALS is mixed until end of October.
I agree with this ?
Full disclosure, PALS as a theory works on 20 years of data. Danny at Lunatic Traders has charts on Full Moon/New Moon effect going back to 1950. PALS in practice has resulted in steady decrease in my account balance over time mostly due to inexperience as a trader.
10/16 is a significantd date. Last week I said it would be a low. After more analysis I now think it will be the final high. The long term trend is down. But the market needs to test 10/16. From 10/16 down into10/30.
An inversion window 10/8-9 screws up my initial forecast. Last week was type 4 kind of wave; consolidating in time.
Monday will be a high but also a low. then 10/11 high, 10/13 low and 10/16 high.
The Monday high is very signifant. But that is the character of a wave 5. From 10/9 up on low volume. 10/16 major date. A last serious (lower) high 10/25 but then everything I see is bearish into early may 2018.
So 10/3 was significant but 9/21-22 basically was the start of the down trend.
Volatility will bottom 10/16/17 but will be up after that into 2020.
One more week and then it will all start, Wonder what FOMC will bring.
cheers,
André
Thanks Andre. My puts from 9/27 are garbage now. Should of waited till after 10/3. That’s what happens after an all-in short and a smartass analogy. Never expected the market this strong. Next time see me doing the same? Buy all on margin. I’m a better contra indicator than Gartman.
Your PALS system is not the only one having difficulty in trying to get a handle on this market. All kind of cycles predictions have seen windows come and go with the market powering ahead despite anticipated turns to the downside. It really makes you wonder about folk who insist central banks have no influence on market price- they have totally lost touch with reality. It is clear, at least to me that the continued run-up on ridiculously low volume can primarily be attributed to central bank buying in unison, and in my opinion also using leverage. They are determined to keep this market afloat, and the herd deluded for as long as possible as a market collapse is going to expose malfeasance of such magnitude as to make the financial crisis eight years ago look like child’s play. I have been contending for some time now that a failure of this market to correct at least 5 % for well over a year now probably meant we were in a final wave up. Prices are now starting to trace out a parabolic rise higher and we all know how parabolic rises resolve. They do not correct, they collapse.
Ah great point. Thanks Verne.
Yes, so true!
Tom,
Did you post your energy charts..
Dear Diary,
Will there be a rare historical Freeze in Florida this year ?
If so, what date will that freeze happen ?
Historically when these Florida freeze hit what happens to
other commodity prices ?
How low do these trends move for on average following
that initial freeze date ?
Are there any planetary pairs that correlate somewhat accurately
with these date further back in history ?
The future of artificial intelligence if programmed correctly will answer this .
Is that what martin Armstrong has voiced ?
All the same market !!!!!! most definitely .
the most consistent date appears to be Dec 12th and another
feb date yet the dec 12th date is the most consistent.
Dec 1 is mars Uranus opposition, that would have to have a consistent
lag in order to be counted .
Mid Dec is the sun mercury Venus conjunction and is the date of the
switch from Venus bull cycle to Venus bear cycle based on the dow .
Currency movements tend to have major trend changes in January .
Natural Gas ???????Wheat and grains ?
Historical seasonal bias of Natural Gas From Now into Jan-feb ??
Industrial Metals ?
Dig Further ………………
Currency movements tend to have major trend changes in January .
*edit. A TREND IN MOTION STAYS IN MOTION . ( January ,what is Mercury retrograde, When is upcoming solar eclipse lunar eclipse ??? , ( the next
51 trading day puetz cycle ? Chris Carolan calendar, how does this dove
tail to planetary pairs ?, May April off top of my head ))
My food for thought
Natural Gas ???????Wheat and grains ?
Mid Dec is the sun mercury Venus conjunction and is the date of the
switch from Venus bull cycle to Venus bear cycle based on the dow .
( January ,what is Mercury retrograde, When is upcoming solar eclipse lunar eclipse ??? , ( the next 51 trading day puetz cycle ? Chris Carolan calendar
Write your ideas down and add to them as you narrow down this further .
January ,what is Mercury retrograde Can be end of cycle !!!!!
Dec 3 to Dec 23 mercury retro i looked up on online .
dec 3 plus 10 days is dec 13th , dec 23 plus 10 days is JAN 2 2018<-______
DEC 1 TO JAN 2 is a major swing Starting Point !
( Give the entire month of dec for what ever kind of bottom or top you see developing across all asset classes ).
Happy 2018 everyone .
It all began with a Florida freeze would be a nice headline
Venus moves away from the sun and becomes n evening start .
Good night bull market .
Joe,
Just seeking clarification…Your “turn window” of 9/28 to 10/08 is about to pass us by. Has that turn window now around December 19th? And you are now looking at the 23,450?
Last post for a while .
James mars langhams work .
this can be published already online so im not
taking anything by showing this .
he has a book about grain trading and book was written
in 1939 i believe .
https://imgur.com/Q2B37DJ
also worth a read is the latest update with raymond merriman
which you can find with a google search .
one a diagram the other an explanation as i see it
Ed
the cycle that began around july 21 st 2017 is now ending
so what goes on next will be based on something else
the mars uranus cycle points higher from a low sept 28
and another day being oct 14th , from oct 14 to oct 19th
points strongly up so i cant rule out higher prices as
this cycle ends .
as for the dow and only the dow .
my key ideal dates for highs and lows short term
are oct 14 a low of sorts and a high oct 19th
a low nov 7th into a high dec 1st .
past December i posted above
right or wrong none of this changes
im not interested in shorting any of that yet i may get in and out
on a very short term basis .
Don’t think markets have much upside. 10/9 is another significant cycle the turns down into 12/7. 7 lunations give the high 10/8 and a low 10/20,
After 10/25 it’ll all be over and then we will be down into early may 2018 between 5-2 and 5-10.
9/22, 10/3, 10/9 all significant highs. The market gets weaker after every turn,
10/16 very significant for many reasons.
Many analysts were bearish before I was. Remember Mahendra? Patcholi? Erik Hadic gave a high q1 17 and a low q2 18. They were all wrong. Dr McHugh has been warning for a catastrofic wave C down ever since the end of 2013. And they all offer payed services, My thoughts are free,
Next week a fifth wave. 10/11 will be a high but FOMC will be a non-event. The market has become a zombie, a walking dead. We are already in a cycle down into may 2018. And this is within a longer cycle down. 5/19/2019 will be another signifcant low.
Monday high and low. Then ABC up into 16. After 10/16 volatility will go up and the moves become larger. After 10/25 we have a bearmarket for many months/years. Patience; just one more week.
Don’t forget Harry Dent who has been disastrously wrong since 2012. In some cases people use gloom and doom to drive traffic. In most cases I think analysts have underestimated the ability and determination of central banks to continue the price distortion. Considering GDP growth, equity price distortion has now become grotesque, and may well become more so. Dent thought 17,000.00 would be the top, and said as much when we were still under 16,000.00 based on his megaphone pattern.
Here is another thing few people have figured out.
Governments stole around 4T from investors’ Panamanian accounts and this extra cash has extended this bull run by at least two years. The FED is certinly lying about their balance sheet and that is nothing but propaganda to try and mask their ineffectiveness as the market becomes more bloated and more divorced from economic reality. Yes this thing has gone on for far longer than economic reality and a host of other reasons would have suggested. All the current talk about how long it will continue and the unimagined heights it will attain could be quite a sign of what is coming. It is pointless for us to end up looking silly by trying to date the end of this runaway train. Having said that, I suspect Zerohedge is right in saying there are no bears left. If true, with central banks out of bullets, upside is limited.
This website is for educational purposes relating to Elliott Wave, natural cycles, and the Quantum Revolution (Great Awakening). I welcome questions or comments about any of these subjects. Due to a heavy schedule, I may not have the time to answer questions that relate to my area of expertise.
I reserve the right to remove any comment that is deemed negative, is unhelpful, or off-topic. Such comments may be removed.
Want to comment? You need to be logged in to comment. You can register here.