Update: Wednesday, Dec 9, 3:30PM EST
Bottom line: We’re in the final pattern of this very large corrective flat that started on Aug 24. It’s a fourth wave triangle and today marked the bottom of the C wave. We have two more legs of the triangle left and then the final wave up to complete the much larger C wave. I have no doubt that finishing this pattern will take us right up to FED announcement on Dec 16. Expect firework then!
Here are a couple of charts to update the progress of the triangle.
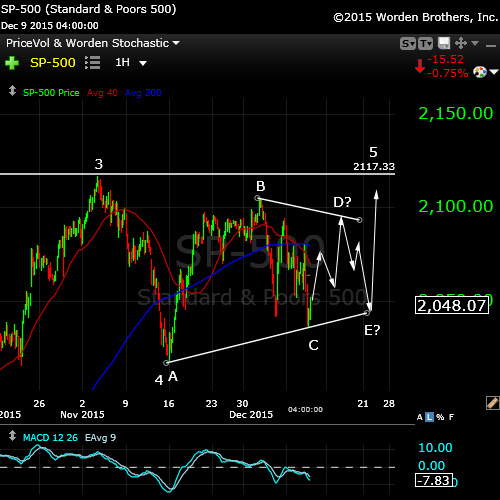
The 1 hour chart of SP500 above for today shows the triangle continuing to define its boundaries. We should head up tomorrow in wave D. The EUR/USD is running counter, so as it tops at approximately 1.09, the equities should head up in earnest. I expect the euro to top tonight.
I’ve drawn in the expected path. Wave C in a triangle is almost always the most complex path of the lot. We’ve seen that this is true in the case of this triangle.
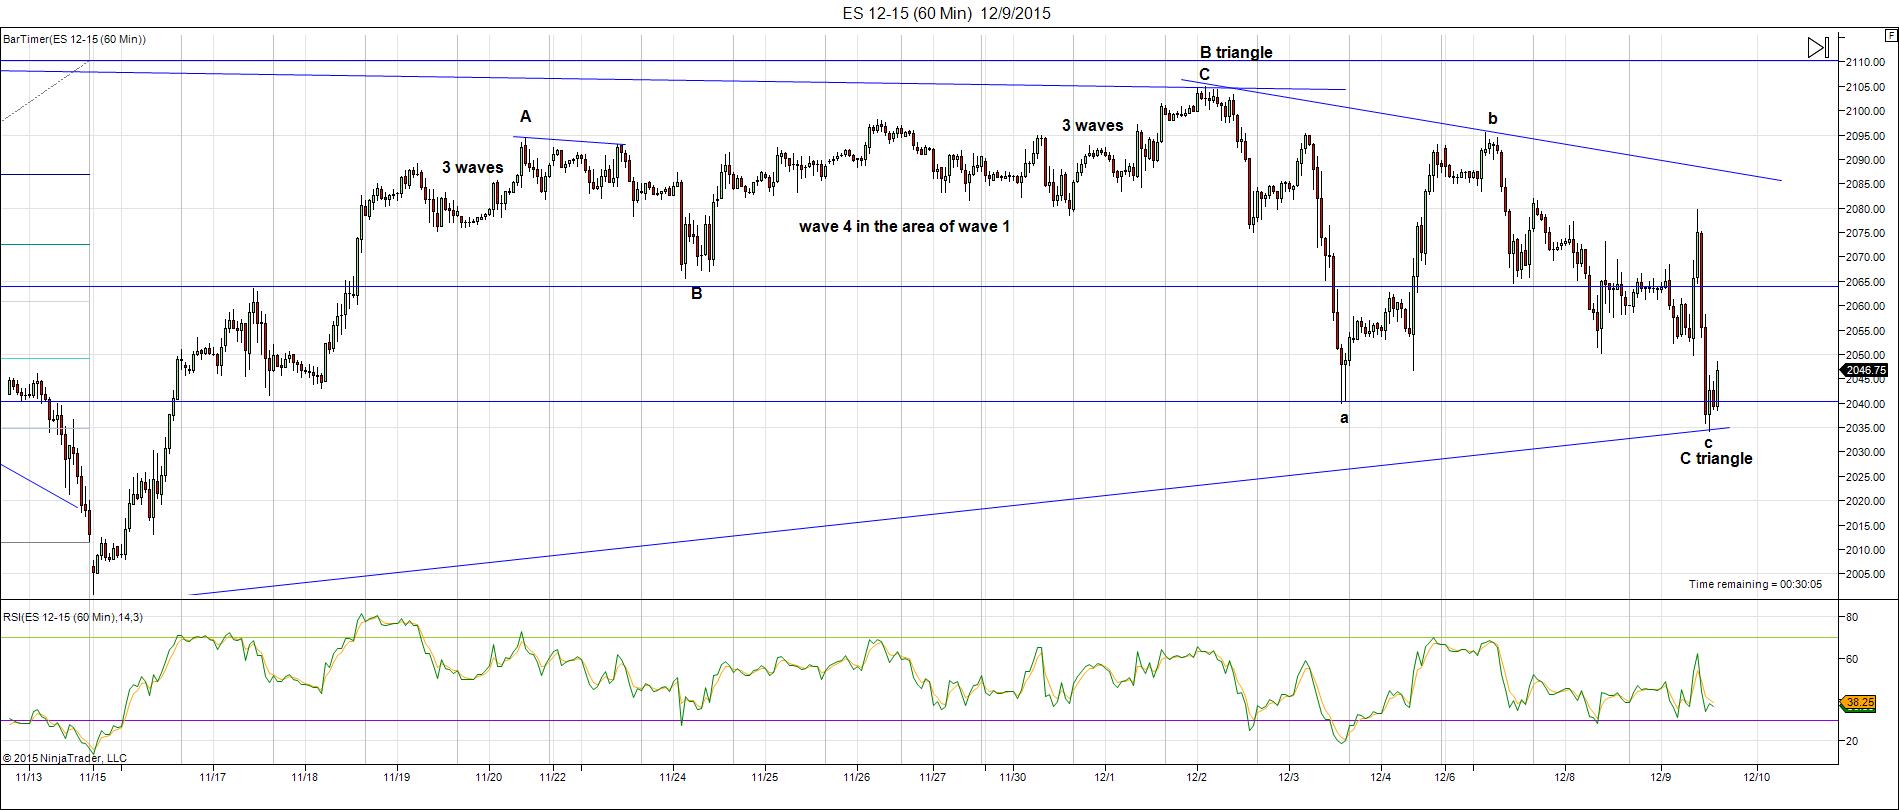
ES (e-mini futures) 60 min chart also shows the very large triangle. We’re currently at the bottom of the C wave. We should head up tomorrow in the D wave.
___________________________
Original Post Starts Here
The US Equities markets are running on empty. It’s only a short matter of time (days now) before they roll over for good. There are only about ten big cap stocks that are fueling what’s left of this rally.
And while I’d like nothing more than to see us head down, the wave structure in equities tells me we’re not quite there yet.
We are now seven market days away from the next FED announcement and it doesn’t take much imagination to envisage the market staying afloat until that announcement.
Almost all the US currency pairs have now turned up, dollar down. This is going to put a lot of pressure on equities to drop. Gold is also showing signs of life. It’s finished an ending diagonal and GLD, for example, looks to have completed one small wave of 5 up, and is working on the second wave.
Both of the above examples I’ll provide below.
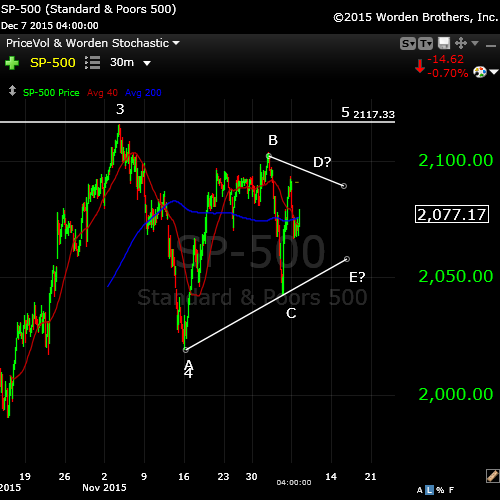
Here’s a look at the SP500 (30 minute chart) as at Dec 7 after the bell. You can see it’s tracing out a large fourth wave triangle. However, the D wave has not met the trendline and it should. So there’s some uncertainty at the moment as to the next short term move.
All the waves so far are in 3 and the remaining waves should be also. The final wave up (wave 5)will likely just test the previous high. It could go higher, but with the underlying weakness, my sense is that this market is dying very quickly.
A triangle in a fourth wave signals that there is one more wave to finish up this larger C wave.
The alternative. For all the skeptics out there that think we’ve somehow topped, there is one alternative. We may have truncated. There are two instances since 1932 that we know of at major degree (which this is):
- October, 1962 at the time of the Cuban Missile Crisis
- End of the year, 1976, after a large wave 3.
Typically, a truncation happens after a very strong third wave, which we have. However, I’ve never seen a truncation—that’s in ten years. They’re extremely rare, which doesn’t mean they can’t happen. But EW is all about probabilities.
Other than that, we had a wave up in 3 waves, which is not an ending wave. We’ve also have a wave down in 3 from November 4, which much retrace in its entirety. Those are Elliott Wave rules.
EUR/USD
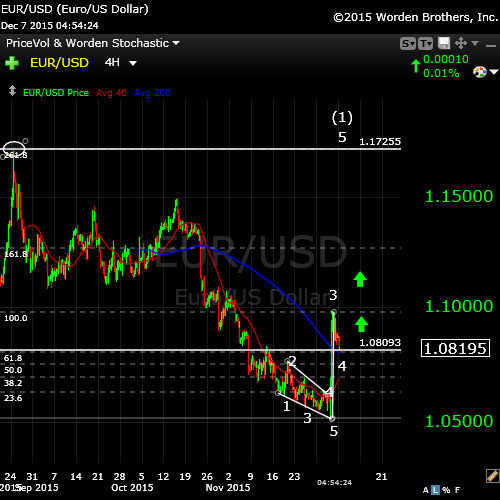
With Draghi’s announcement of more easing, the currencies seem to have changed direction. The eur.usd have completed five waves up and should now come down 62% to complete a second wave and then head back up again.
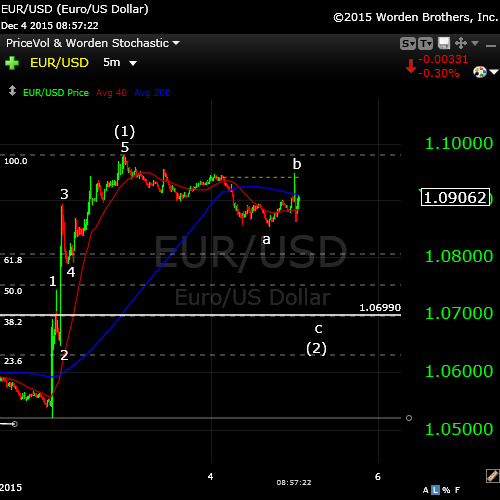
Above, a 5 minute chart of the eurodollar. You can’t quite see the ending diagonal complete at the bottom of the chart, but you can see the five motive waves up to complete the first wave up. It may back off 62% in a second wave before taking off again in a third wave. The horizontal line marks the 62% retracement level (the reciprocal of 38%).
Alternative: I am also reminded that this is a first wave (in 5) and as a first wave, it may only retrace to the previous 4th before launching a 5th wave up, which would likely take it up to 1.172 before doing a 62% retrace (SHOWN BELOW). Be on the lookout for a breakout up this morning.
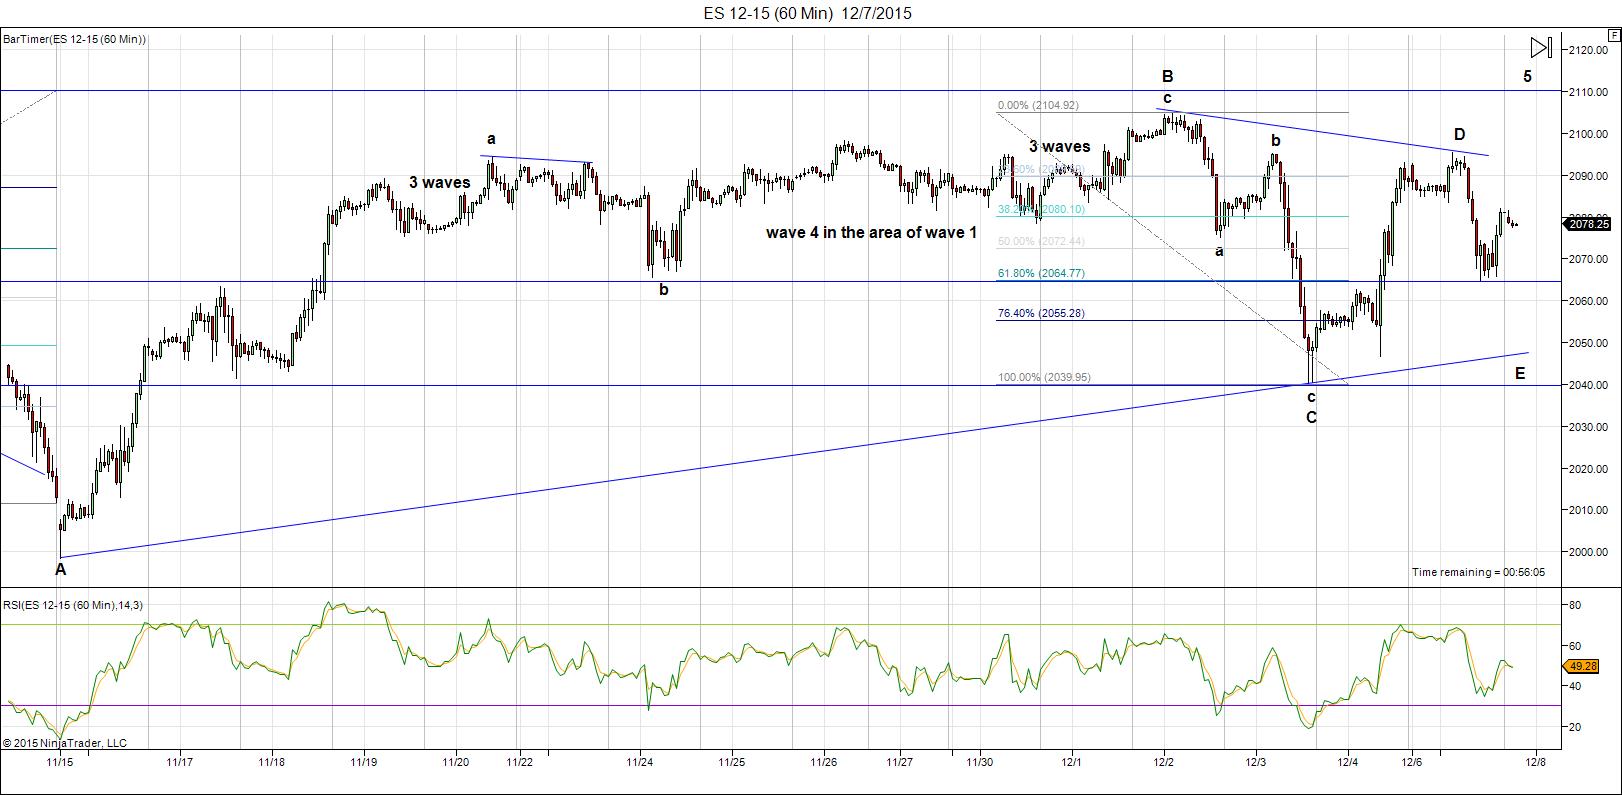
Above is the count on ES (60 minute chart) as of tonight (Dec 7). The configuration is a little different here than the cash indices, although we seem to both be in some stage of completing a D wave of a triangle. They appear slightly out of sync, so they will need to resolve that problem over the next day or so.
You can see on the above chart the issues with the 3 wave configurations. I pointed out the first one several days ago (the one to the left of the A wave). We need to test the previous high in an eventual 5th wave.
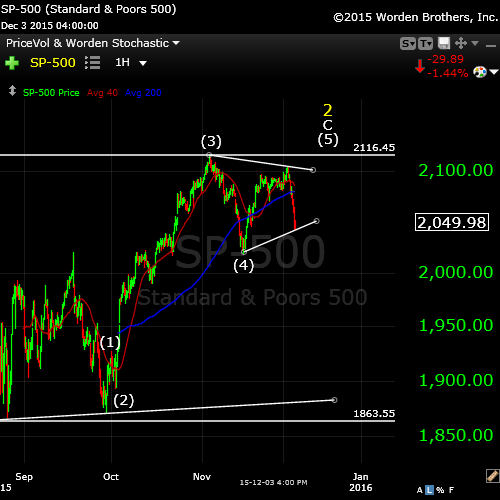
Above is a “wider shot” of the SP500 (one hour chart) showing the larger pattern. I would expect to see this potential 4th wave triangle finish up at a the previous high of 2116.48.
Gold
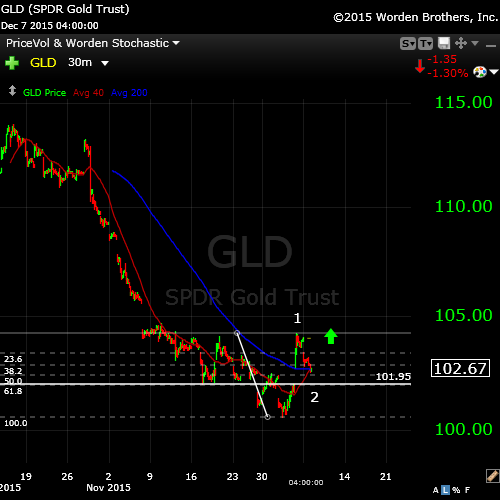
Gold (GLD) has a similar pattern to this ETF. It’s sporting an ending diagonal within a larger ending diagonal. We had a rather large jump over night. This wave up so far looks motive. We’re expecting a large rise from gold as the equities head down.
Here’s the US dollar:
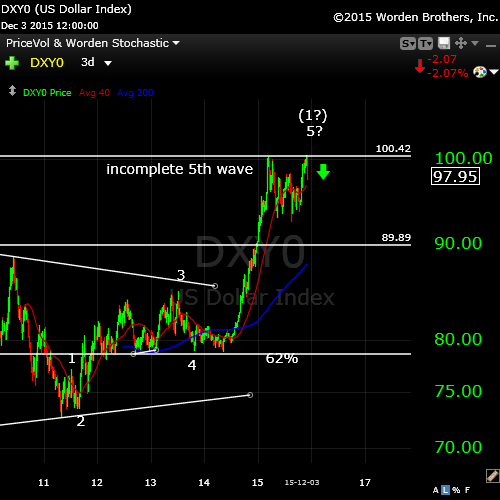
The US dollar chart (3 day chart) above is the interesting chart to me of any of them here. The fifth wave is not complete. I actually didn’t expect the dollar to reach a new high, but it did. So, while I have left the motive count on the chart, it’s a 3 wave configuration at the moment, which would mean the dollar would be expected to retrace right to the bottom.
Either the dollar heads back up to complete the 5th wave (the fourth wave also did not retrace a sufficient amount) or we should have a large retrace ahead of us. One to watch.
And finally, here’s a really super set-up, the British pound/dollar.
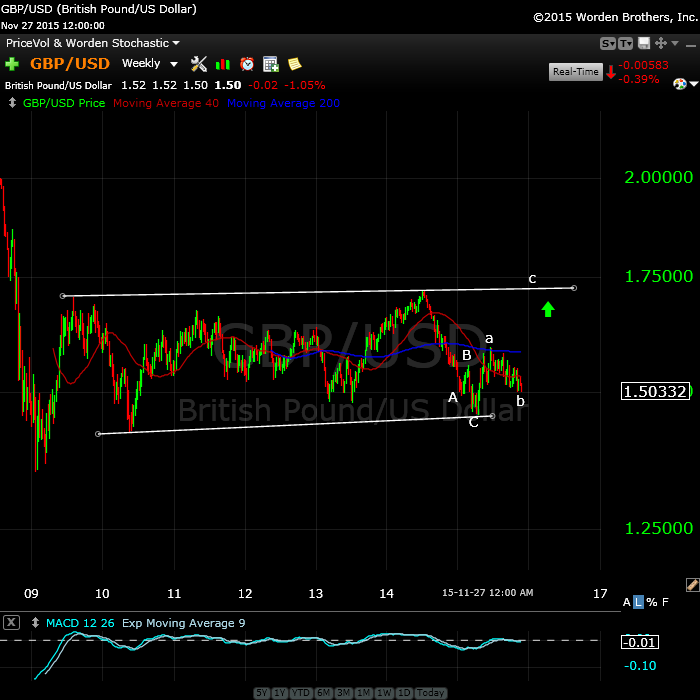
If you like trading currencies, here’s a no brainer. The GBP/USD weekly chart shows a large 4th wave triangle. We have a C wave left to go on the last leg of the triangle (the e leg) and then we should turn down into a fifth wave. I’ve been watching this one off and on for quite a while.
____________________________
The Question of Seasonal Bias
The Decennial Cycle (chart below) that’s tossed around without a lot of thought is not a “cycle” in the true sense of the word. It a short-term phenomenon, or pattern, perhaps. It’s interesting that most charts only go back a few decades to make the case for a continuing pattern.
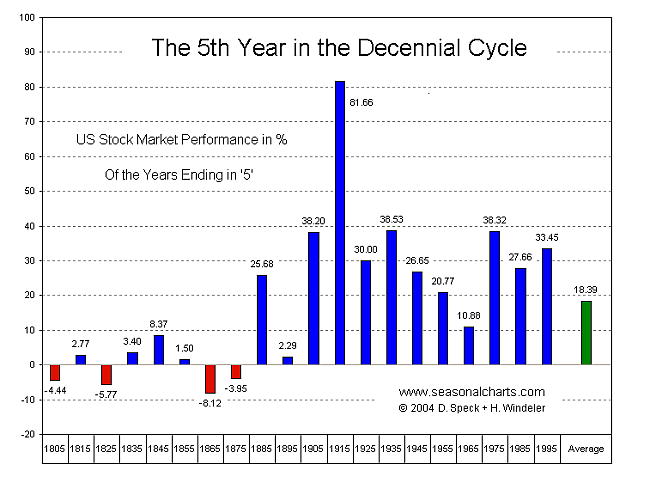
The chart above goes right back to 1805 so you can see the issue I have with this phenomenon being anything other than a short-term pattern. 2005, in fact was ‘flat’ or negative, depending on who you listen to. So far this year, the NYSE is down one percent. I find the reference to the “decennial cycle” lacking in any kind of credibility.
You’ll find the article to this chart here.
In terms of seasonal bias, Santa Claus and end of year seasonal rallies show even a spottier performance. On the other hand, as a contrarian, I would much rather see rabid optimism in the market, as we have now. In my way of thinking, it sets up the perfect scenario.
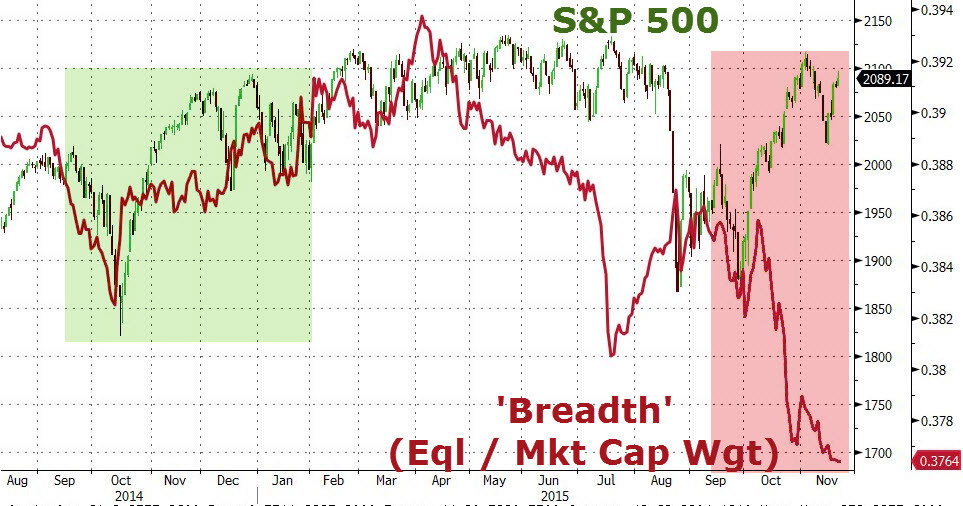
Above you’ll find a snapshot of market breadth, which continues to implode. This is from a zerohedge blog post.
Now on to cycles:
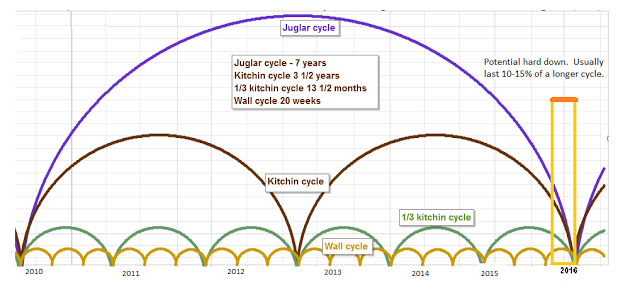
Here’s a chart of the Juglar, Kitchin, and Wall cycles which are harmonic. They’re forecasting a turn near the end of 2015 or very early 2016. More specifically, they point to the January/February time period as a bottom.
You can find this chart and a full explanation at http://swingcycles.blogspot.ca.
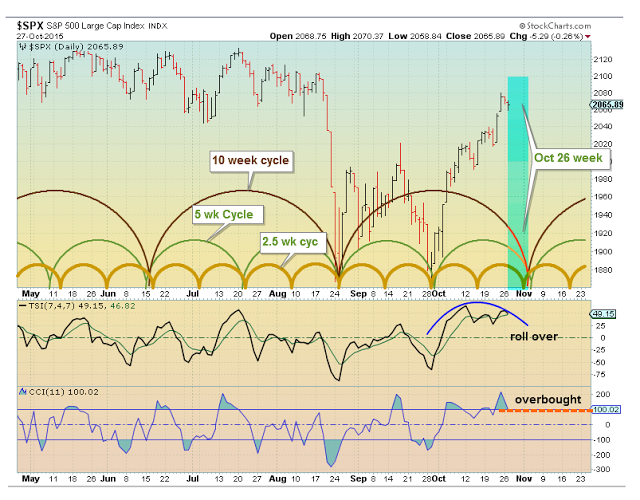
This is a similar chart of the recent past. You’ll see the end October/beginning of November forecasting a major top. In fact, we topped in wave 3 of C on November 4—a direct hit.
Andy Pancholi’s “Market Timing Report” forecasts November 23 as the major turn point for the month. I highly recommend it for its accuracy. You can find it here.
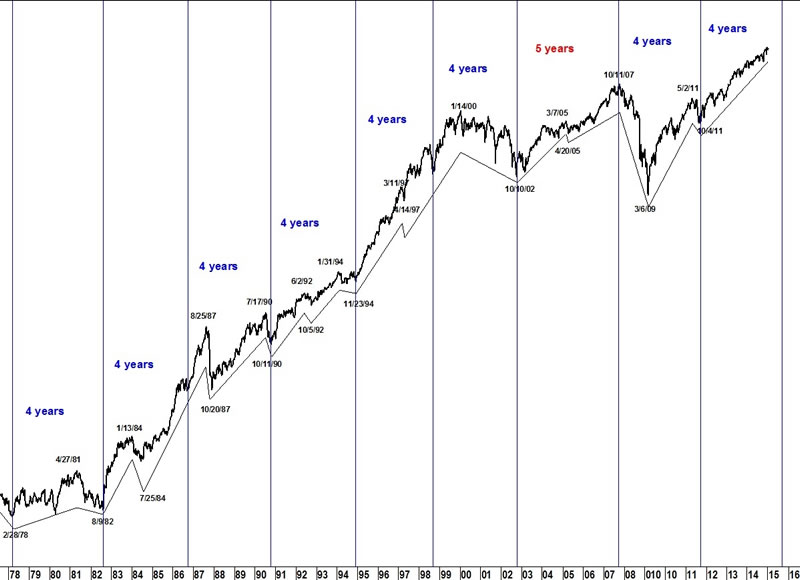
On a longer-term basis, here’s a look (above) at the 4 year cycle on the DOW. This cycles forecast looks to the end of 2015 for the turn. You can see how long-term and persistent this cycle is.
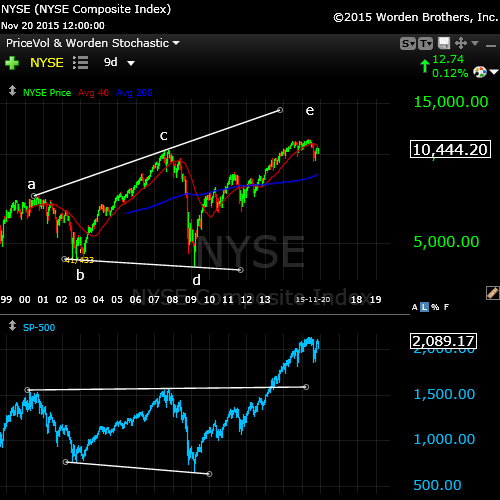
I was asked this week about the broadening market topping pattern (well-known market topping pattern—not Elliott Wave related), so decided to include it here.
Above is the larger broadening top of the NYSE in a 9 day chart going back to 1999. This would be called an “ending expanding diagonal” in EW terms. It’s an extremely bearish pattern and seem to be failing in the final stages.
It’s interesting to me to note the difference in the NYSE as opposed to the SPX (lower blue chart). It speaks to the breadth of the market. It tells me the buying is concentrated in the big cap stocks.
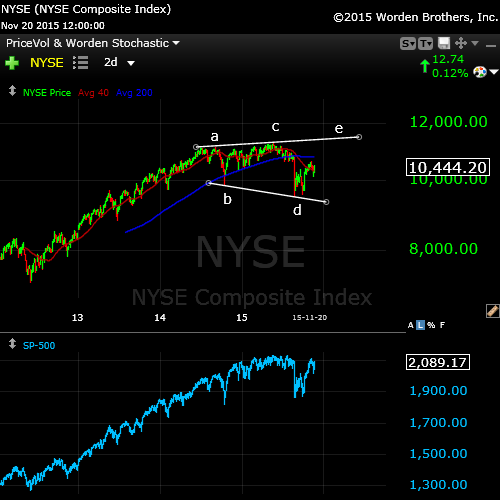
Above, we can see this same pattern on a short term scale in the final wave of the larger topping pattern. We have what appears to be a failing e wave in the NYSE 2 day chart.
There’s also a non-confirmation here, as well. with the SPX chart. This suggests the rally is narrow on even a short term-basis, with most of the buying in the big cap stocks.
DOW Theory (Transports and Industrials Non-Confirmation)
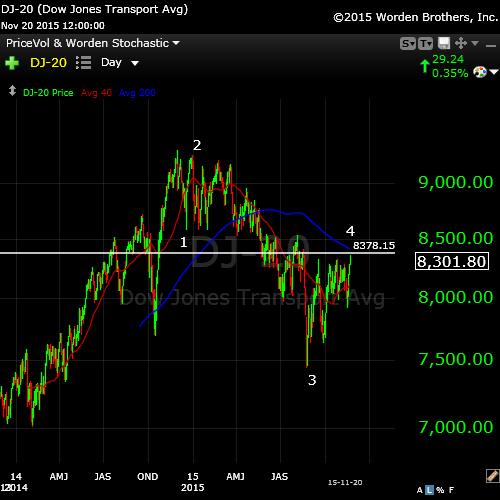
I haven’t brought up the Dow Transports non- confirmation for a while, but it’s been busy at work setting up for the next drop. The Transports Index (DJ-20) is tracing out a typical fourth wave (above), with the Industrial Index finishing off the 2nd wave (below). Both are setting up for a turn down in tandem. You can find background on the DOW Theory here.
For more confirmation, you can visit this article on the Baltic Dry Freight Index. Scary stuff!
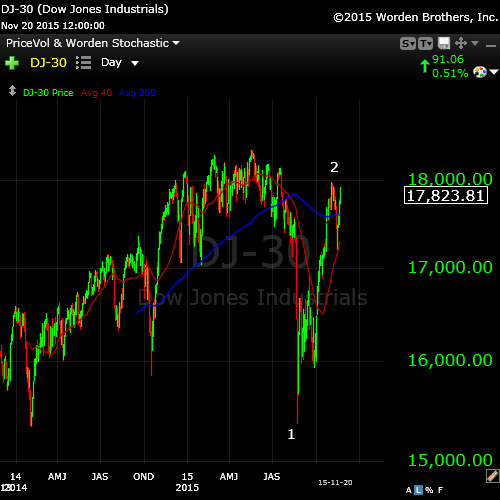
Above is the daily chart of the DOW, showing us at the top of wave 2.
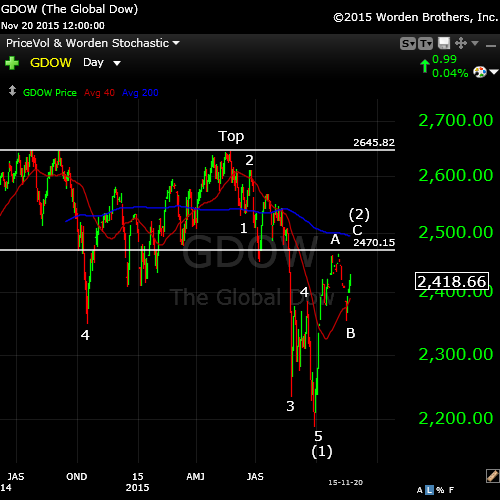
Next to last, here’s a daily chart of the Global DOW. Not much has changed here lately.
The Global DOW is like the elephant in the room, letting you know what’s happening on an internationalk basis. We’ve completed one set of motive waves down from mid 2014 and have retraced exactly 62% in a second wave, where we sit now. Actually, we’re completing a fifth wave up in this second wave rally, which should top at the same time as the US equities roll over. The writing is on the wall!


Peter–This clearly has the look of a 3rd wave to me. The broad market is breaking down. Gary (Denver)
http://stockcharts.com/h-sc/ui?s=%24NYA&p=D&b=5&g=0&id=p58474924683
ES low was 2011 , which is within my target between 2010-2013 . If that holds for next hour , then there is a good chance the low is in and we start going up from here.
AZ
DOW and SPX are now simply fourth waves. All they have to do is a final wave up in five waves. They’ve all come down to the previous fourth. That’s made the end that much closer.
I’ll have to think about ES as it has three waves up as a first wave. I would have expected it to come down to the previous fourth, as well.
Peter–The NYSE printed a rather large gap this AM, acts and looks like 3rd wave behavior. They are hold the DOW and SPX together with Duck Tape and Chewing Gum. Gary (Denver)
Yeah, I’ve been watching that and GDOW. GDOW waves are indecipherable as far as I’ concerned. NYSE’s first wave still looks to me like a 3 to me, and the first wave of this “third” looks like a 3. The waves after that are overlapping. I think GDOW is done but I’m not sure about NYSE.
DOW as I look closer is actually in a second wave, as is Nasdaq comp, which is fine since their first waves up were in 5. SPX had a wave up in 3 so it either had to start over, which it’s done, or finish the triangle, which it couldn’t do.
I’m focused on Yellen and here announcement for the final nail in this coffin.
Peter–IMO, Yellen does not matter….she and all central bankers are dead ducks!! How did it work out for all those hedge funds that thought Draghi mattered? He mattered but not in the way they thought? Non linear thinking suggests that Dollar might just pull a EURO no matter what she does (which is likely to be nothing). Underlying conditions stink and are getting worse every day. Dollar denominated liquidity is becoming a very important issue. The dollar moved up 25% in the 2008 debacle…..this time a much larger move is likely. Gary (Denver)
haha … well, that’s reality, which doesn’t carry a lot of weight in the markets, as you know, or we would have rolled over a long time ago.
In the ad world, we say that “in terms of the audience, perception is reality.” Substitute “herd” for audience and we have the current situation. Yellen will simply be the trigger, imho. The herd (en masse) still has the perception she (and other central bankers) will save the world …
In terms of the dollar move, I stick with EW analysis … and not what I might think …
In the NYSE, the C wave is the same length as the A wave, which is a appropriate point for a turn up. I still think we’ll see a double top here.
Peter–Are we looking at the same chart. Off the Aug lows I see a large ABC with a rising wedge at the conclusion of the C Wave. Then the start of a 3rd Wave down? Seems to me that the gaps in the chart indicate instability and very emotional trading? Gary (Denver)
If you’re talking about the NYSE, yes. I was looking at the ABC down on a one hour chart from Nov. 3. I can’t conclude that the larger C wave up has concluded. I have nothing that tells me that.
I wouldn’t be surprised to see ES come down to the previous 4th wave. I don’t think it’s quite done yet.
Peter ,
Yes, I think you will be right .
My level on ES at 2010 – 2013 is gone now
AZ
It really has to. From an EW perspective, the previous wave up in ES was in three waves. The only ending waves that can be up in 3 waves are triangles and ending diagonals. The triangle is all but done and the ending diagonal doesn’t make any sense either. So the wave up in ES has to bottom and start over, and that dictates that we go back to square one, which is the previous 4th at about 2000 in ES. Then we need one final wave up in 5 waves.
Ditto for cash, except possibly the Nasdaq which looks to have completed a wave up in 5 already to a new high (but it looks to me that it’s going to do the same as the other indices. It doesn’t necessarily have to. The wave down is in 3 waves, though so it should retrace to the top, as well.
This leg down today has now lasted 1.618 times the A wave on dec 9 .
if there is to be a bounce is should begin very soon or id say i am wrong about today .
the weekly wave count on a close only chart would call for today closing down here somewhere.
Joe
Next week is very important
Yes, should turn soon, although I still expect ES to hit the previous 4th. Futures are all down in 3 waves so we do have one more wave up to go to top. SPX can come down to about 2008 or a little lower before I’d start to wonder.
Yes, as I’ve been saying, next week (and Yellen) looks like the big one. Doesn’t matter what she says. Get the powder ready … I’m looking still to the 16th.
Finished letting go of shorts. Remain long and strong.
As mentioned from my above post, waiting for a shallow v shape bottom with volume. With the possibility of seeing a 20 -30 point drop.
Good luck every one.
Hi peter
Just a thought before the weekend .
the guys at Trend Fund ( i think they have a new name now days )
they used to say the market tends to rally into fed meeting more times then not .
also if the rumor is true above the heavy put options from 2050 to 1900 .
id say there is a good chance the spx closes above or at 2050 by expiry .
I use closing numbers so un officially the 5 day and 10 day ad lines are into there
lower ranges . there is a very good chance this market rallys all next week
as for today who knows a close below 17383 is all im looking for .
if we see a bounce up to 17450 over the next hour im done for the day .
that’s a best guess .( id be a bit surprised to see it actually bounce )
the 10 day tick plus ad line is now at the same extreme as the aug 24 low .
going to keep my powder dry today .
im not a big options trader yet i bet people are eye balling the weekly
spx options
Enjoy your weekend
Joe
Joe
GLD hit the 62% second wave retrace this morning and we’re now heading up in a third wave. The first wave up from Dec 2 appeared to be in 5. So the prognosis is to continue up.
I’ll put together a market update tomorrow with a projected path and targets for after the top. We likely haven’t bottomed yet today, but the last wave up in 5 should start by Sunday in futures, I would think. ES should still bottom at 2000, I think.
US currency pairs continue to move contra to equities, so they should come down over the next few days, bottoming I suspect when equities top.
Peter ,
If ES for any reason goes below 2000 , then does that mean we are in Wave 3?
AZ
Only if it’s a truncation can we have topped and the odds are heavily against that happening. And one futures index does not dictate the market. In other words, going into wave 3 changes the game but the rest of the indices would have to confirm it. For ES, 2000 is the likely target as it negates that previous wave up in three and allows us to make a traditional top (a wave in 5). It can still go a bit lower, but I suspect not.
Everything about these waves down say “corrective” so far. All the waves are in 3. They’re all overlapping.
In SPX, the previous 4th in the wave up is 1990.73, based on my numbering of that wave. It still has some maneuvering left before it reaches there. That would be a normal retrace level (other than the 38% level). So the market is well within expectations from an EW perspective. And of course the test that would confirm a top is when this wave down crosses into the previous first wave, which is much lower still.
I’m looking at charts of all the indices, as well as the major currency pairs, and I don’t see anything that suggests we’re going lower than that – quite the contrary, in fact.
Thank you very much Peter for this detailed explanation .
Very much appreciated
AZ
You’re welcome. Not the happiest of markets 🙂
To be expected at a top.
I’m sticking to currencies for the time being until we top. They’re a little more predictable on a shorter time scale. But then, I don’t have the time to day trade, or watch the market. However, I will clear my desk for later next week …
A wave down from Dec 3 in SPX is the same length as the C wave now, so we may end right here. ES could still drop of course on Sunday and then reverse up. Monday should be up, through to Yellen.
Thank you and have a nice weekend.
Regards
AZ
AZ … and to you. Next week should be fun.
Update:
As explained last August… (Cycles/Macro-Economic Fundamentals/TA) a 20% correction would be followed by a double top into mid 2015… going into Wednesday’s FOMC, we are basically here. Hope all are prepared to profit from the next more severe 50% correction into 2016.
I notice that once again, most TA “experts” were baffled that stocks did not fulfill their projections and have been making a double top into late 2015. John Hampton spoke to this concern, and I agreed. Gold also bottomed into my exact cycle date (based on a unique mathematics principle that I’ve been using since the late 90s). Get ready for Gold stocks to head higher in a new leg up based on a number of reasons.
Hey Andre
If you see this
i’m curious if it fits with in your work
https://equityny.files.wordpress.com/2015/03/spxtimezones3-26-15.png
Joe
Joe,
Jonathan Stephens is a friend of mine and we talk a lot about timing and forecasting. I also am a guest writer on his site.
The 11/3 high was significant. On 10/4/2011 a major low was set. Using months with 30.4375 days, 49 months from the 2011 low gives 11/3/2015.
The 8/24 plus 49 trading days (=71 calender days) also gives 11/3.
411,78 (full moon cycle) days from the 9/19/14 high gives 11/4.
Gann considered 49 (7-squared) to be very important.
.Next week will be down with some reversals around the fed meeting. Then one last leg up into Christmas where a full moon makes a 45 degree angle with the Death and Destruction midpoint with Uranus turning direct 12/26. First major low 2/17.
Cheers, andré
P.s.
The square root method on the S&P 5/20 high gives 12/24. 12/10 was 90 degrees from this angle. Geo Bradley gives a high 12/26 and this is also a Pluto shadow date. 12/18 HC venus conjunct Jupiter, may cause the inversion up. Then 12/24 HC Venus conjunct Mars.
So, looks like a high energy period; not just for financial markets.
André
Thanks .. Andre….Nick
Thanks Andre
Joe
New post: https://worldcyclesinstitute.com/high-time-for-a-turn-down/
A new post: https://worldcyclesinstitute.com/the-game-has-changed/
This website is for educational purposes relating to Elliott Wave, natural cycles, and the Quantum Revolution (Great Awakening). I welcome questions or comments about any of these subjects. Due to a heavy schedule, I may not have the time to answer questions that relate to my area of expertise.
I reserve the right to remove any comment that is deemed negative, is unhelpful, or off-topic. Such comments may be removed.
Want to comment? You need to be logged in to comment. You can register here.