
It’s Almost Fall!
Well, that went …. slowly. The summer doldrums, that is. I’m expecting a really volatile fall, while the summer was, well … frustrating as heck!
In terms of the US market, I’m expecting a large C wave down starting this week to finish of the fourth wave (the final wave before a new all time high and top of this 500 year rally). Let’s give that a couple of weeks (the A wave came down in a couple of weeks). That would take us into the first week of September, when everybody’s back.
Then I’m looking for a final rally in a fifth and final wave to an all time new high. All the US indices will need to get to a new high before this market finally keels over for good.
We might be looking at that final wave taking about a month or so. In any event, I’m expecting a top this fall. The crash happens in the third wave, so we’ll need a couple of months to get to that point (we might not see the crash until January), but once the top is in, we’ll have a much better idea.
Time to start getting ready for the future. I’ve decided to wait to schedule my webinar, “Navigating the Crash 2” until the last week of August, and possibly again in the first week of September. It’s going to be about the steps you should be thinking about (outside of the market) to stay safe over at least the next 10 years.
I have more blog posts coming on that subject starting in a week or so.
This downturn is going to dwarf anything that took place in the 1930s.
 The Flat Sisters
Here are the flat sisters. They’re really hard to pin down and you never know if you can trust them to show up until they actually do.
They’re big, bold patterns and they’re well … a little weird.
You primarily find them in fourth waves. Both are 3-3-5 patterns (a three waver, a three waver and a final 5 waver in an ABC pattern).
Expanded flats are more “colourful” than regular flats because the B wave goes to a new high and then turns down and crashes in five waves.
The B wave of regular flats retrace at least 90% of the length of the A wave and then they, too, crash in five waves.
Catching them can be difficult. More on the specifics of the patterns below. As I explained last week, I think we’re going to see flats in ES and NQ (and their related cash indices). The alternate count would a zigzag (a five wave wave down in a C wave) and lower probability is an ending diagonal
Regular and Expanded Flats
The pattern tracing out in ES and the SP500 seems to me to be a regular flat. Here’s an description of the traits of a flat (from the Elliott Wave Principle):
“A flat correction usually retraces less of the proceeding impulse waves than does a zigzag. It tends to occur when the larger trend is strong, so it virtually always precedes or follows an extension. The more powerful the underlying trend, the briefer the flat tends to be. Within an impulse, the fourth way frequently sports of flat while the second wave rarely does.”
Regular Flat (below)
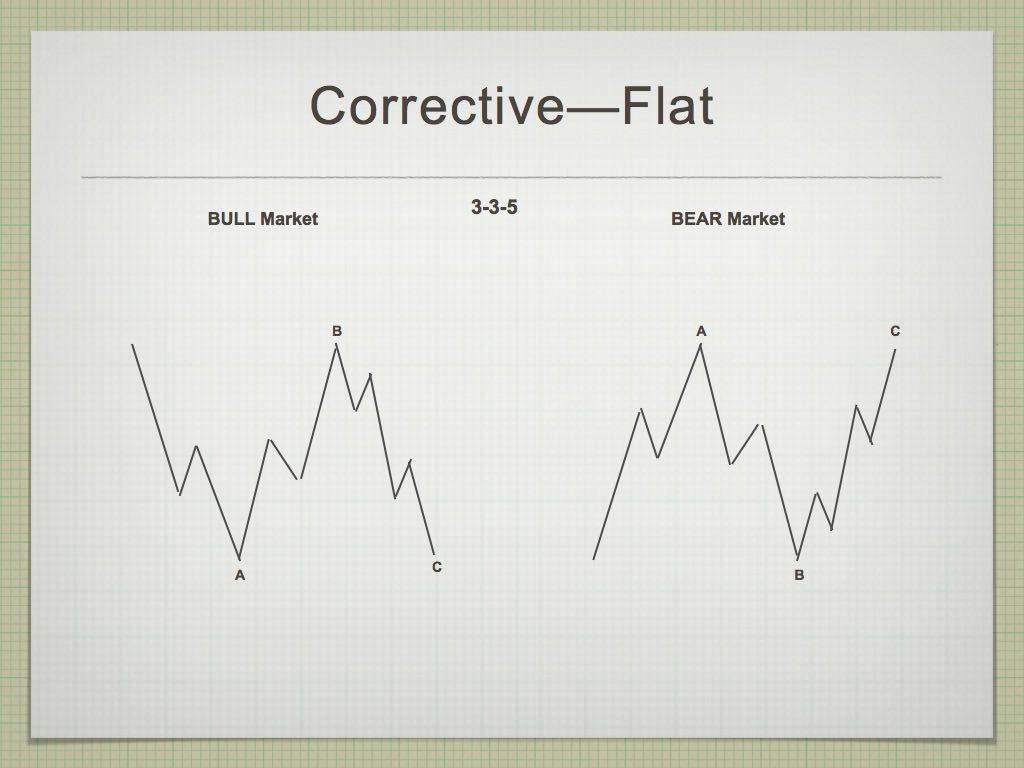 Above is a chart showing a very simple drawing of a regular flat. Think about the large fourth wave in the SP500 that we’ve been tracing out since January 29. The BULL Market wave on the left in this diagram relates to the probable pattern we have unfolding.
The first set of waves down from the 2872 area (at the end of January, 2018) was in three waves (a zigzag). This is the A wave of the flat.
The wave up from about 2530 is also in three waves. This is the B wave of the flat, and has traced out a very obvious ABC wave to 2863 in the SP500 (it’s not quite complete, but may be early this coming week).
In ES, my target now on the upside is 2864 (we could go higher, as the structure of this week’s rally is questionable). If this final 5th wave up goes to a new high early next week, it would most likely become an expanded flat.
In either case, wave C down will trace out five waves for a complete pattern (3-3-5).
Expanded Flat (below)
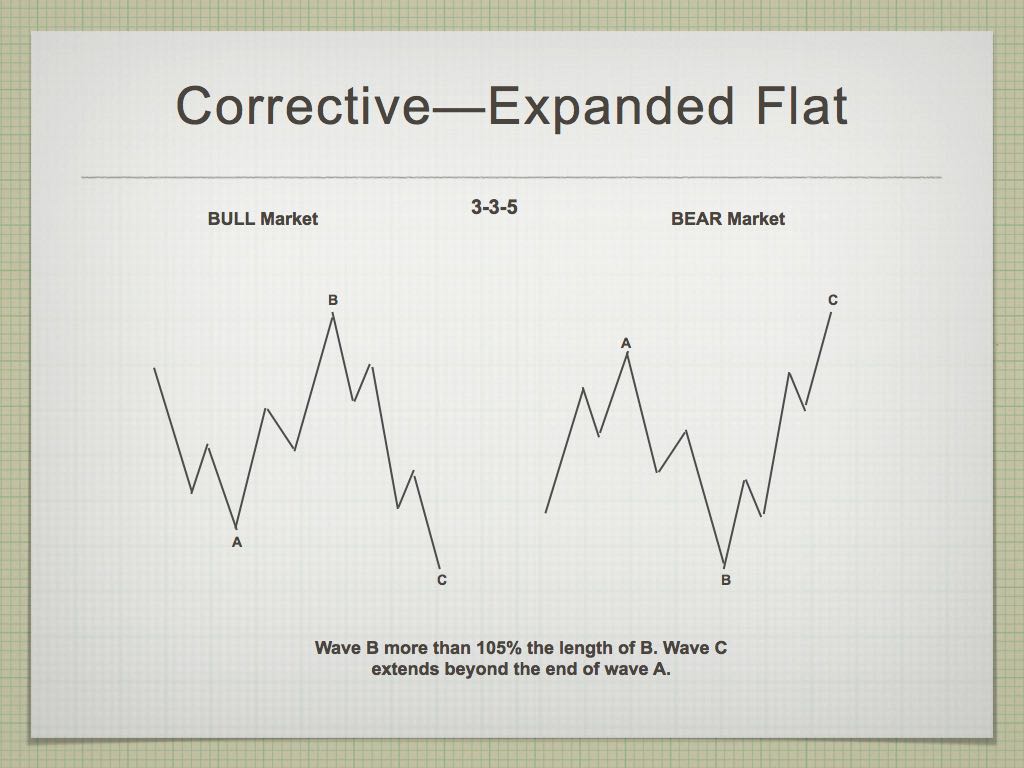 The only difference between a regular flat and an expanded flat is that in expanded flat, the B wave goes to a new high (the pertinent diagram is the one on the left, for a bull market). My preference for NQ and NDX is that we have an expanded flat, rather than an ending diagonal.
Summary: We seem to have a regular flat in progress in ES and an expanded flat setting up in NQ. Look for a rally into perhaps Monday or Tuesday and then a sudden turn down into the C wave. The C wave in both flat patterns will drop to a new fourth wave low.
The 5th wave down (of the C wave) doesn’t always trace out a complete 5 subwaves, so we need to be careful of a sudden turn at the bottom.
______________________________
Elliott Wave Basics
There are two types of Elliott wave patterns:
- Motive (or impulsive waves) which are “trend” waves.
- Corrective waves, which are “counter trend” waves.
Motive waves contain five distinct waves that move the market forward in a trend. Counter trend waves are in 3 waves and simply correct the trend.
All these patterns move at what we call multiple degrees of trend (in other words, the market is fractal, meaning there are smaller series of waves that move in the same patterns within the larger patterns). The keys to analyzing Elliott waves is being able to recognize the patterns and the “degree” of trend (or countertrend) that you’re working within.
Impulsive (motive) waves move in very distinct and reliable patterns of five waves. Subwaves of motive waves measure out to specific lengths (fibonacci ratios) very accurately. Motive waves are the easiest waves to trade. You find them in a trending market.
Waves 1, 3, and 5 of a motive wave pattern each contain 5 impulsive subwaves. Waves 2 and 4 are countertrend waves and move in 3 waves.
Countertrend waves move in 3 waves and always retrace to their start eventually. Counrtertrend (corrective waves) are typically in patterns — for example, a triangle, flat, or zigzag. Waves within those patterns can be difficult to predict, but the patterns themselves are very predictable.
Fibonacci ratios run all through the market. They determine the lengths of waves and provide entry and exit points. These measurements are really accurate in trending markets, but more difficult to identify in corrective markets (we’ve been in a corrective market in all the asset classes I cover since 2009).
To use Elliott wave analysis accurately, you must be able to recognize the difference between a trend wave (motive) and a countertrend wave (corrective). There’s very much more to proper Elliott wave analysis, but this gives you the basics.
____________________________
Registration for Commenting
Want to comment? You need to be logged in to comment. You can register here.
If you register, it protects your information. It also allows you to comment without filling in your information each time. Once you’re registered, simply go to the home page and click on the login link top right in order to log yourself in. Usually, you’ll be logged in for several days before needing to be logged in again.
______________________________
Problem receiving blog comment emails? Try whitelisting the address. More info.
______________________________
the real deal SM 2
The real deal …‘Educational, insightful and thorough market analysis for all levels of traders. It’s Elliott Wave at its best….Peter Temple is the real deal’ —SM |
A true expert in Elliott Wave FL 2
A true expert in Elliott Wave …You are a true expert in EW analysis. What you provide is not available anywhere and is priceless. Subscription on your services is the best thing I have ever done. Many thanks for your effort to make me a better investor. I now have more trust in my investment decisions. I hope you will continue the excellent work! —FL |
The best of them JL 2
The best of them …Last couple of years, I subscribed to several ‘market traders’. You are by far the best of them and the personal contact is awesome. Daily and daily updates are very well written! Besides your expertise in EW, I also like your cycles analysis. Best investment I ever made! —JL |
Couldn’t be happier … KK 2
Couldn’t be happier …The analysis and insight you provide is simply amazing! I’ve been trading the futures and equity markets for well over thirty years and usually average around 5% monthly. Since joining your Traders Gold Service two months ago, that number has better than doubled. I couldn’t be happier.—KK |
Get an upper hand … JC 2
Get an upper hand in trading …Seeing all the different currency pairs and the wave structures and hearing you explain why this has to do that on a nightly bases gives one a upper hand when trading. Elliott Wave applies to all stock and indices and can be applied to any candlestick chart. If someone ask what you want for Christmas – Tell them a membership to Peter’s “Traders Gold!”—JC |
Rise above the rest … SM 2
Rise above the rest …I have only ever met a few people who, in their chosen fields (astrology, medicine, music, martial arts, technical analysis), rise above all the rest and you are one of them…you have ‘the gift’…and that’s why I’m a Trader’s Gold member. —SM |
Tops in your field DZ 2
Tops in your field …You are tops in your field. Tried to follow Elliot Wave international for years. They were always behind the market. After discovering you, I perceive that you are an expert in reading the waves, which puts you way ahead of the rest of your peers. And you can read the Waves like you are reading tomorrow’s financial section. I pray you stay healthy. —DZ |
Have not had a losing week RW 2
Have not had a losing week …I have been with Peter almost a year. The only thing that matters is have I made money with his service. I think I have finally turned the corner using Peter’s EW. I have not had a losing week in the last 5 months. Thanks Peter, for your amazing amount of hard work. —RW |
The Market This Week
Here's the latest daily chart of ES (emini futures)
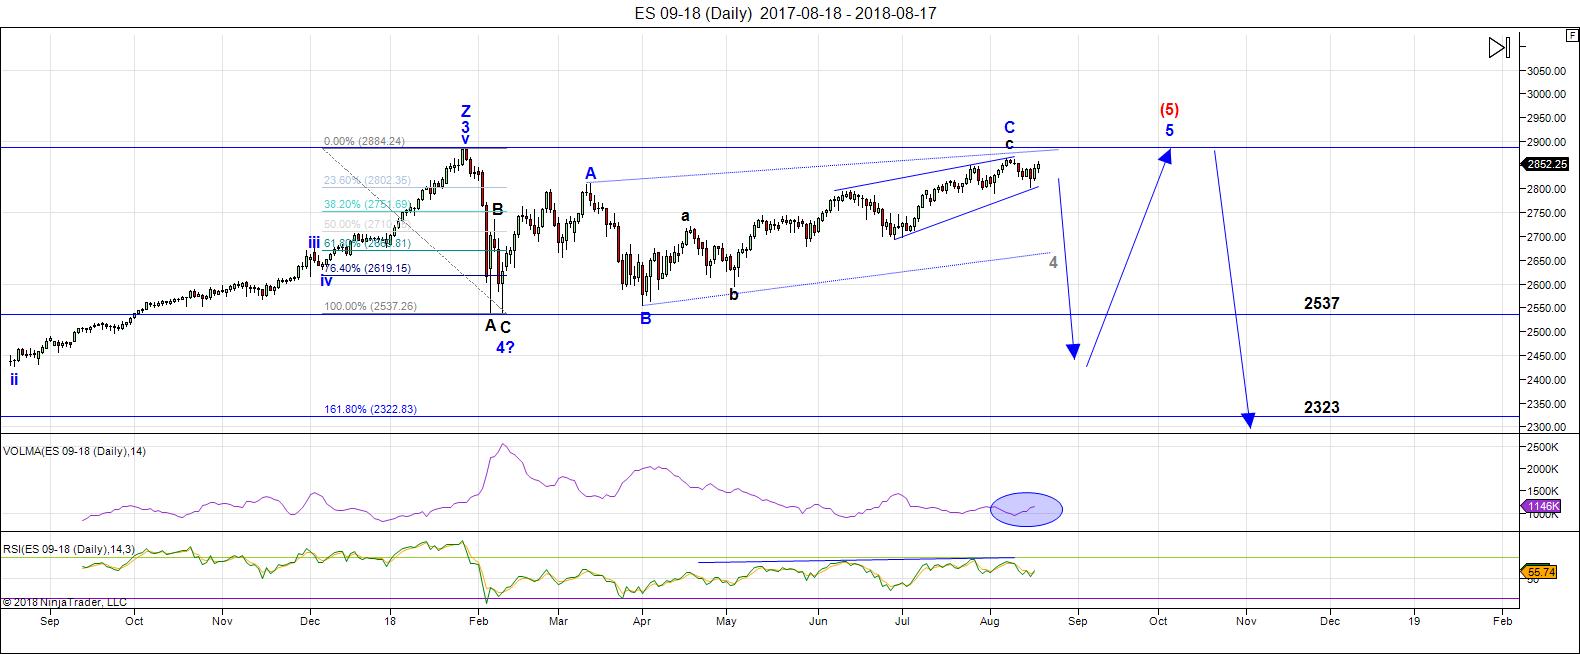
Above is the daily chart of ES (click to enlarge, as with any of my charts).
My preference is for this unfolding fourth wave pattern is that of a regular flat. You'll find the specifics above (the prediction is the same as that of the SP500).
We're still waiting for this complex third wave of the ending diagonal to top. Now we're almost at the top of that wave. A turn down into a large C wave is imminent.
The options and targets for the next wave down are as follows (and are roughly the same for the SP500):
- the C wave of a flat is typically 100 - 165% of the length of the A wave (so the target would be from 2537 - 2323)
- a simple C wave down the same length as the A wave (most likely in 5 waves) would target roughly 2537
- a C wave that is 1.618 extension of the A wave would target about 2323.
Summary: We're waiting for a top in a B wave, which will result in a C wave to a new low. Once the C wave (down) is complete, expect a final fifth wave to a new high. That fifth wave up to a new high will be the end of the 500 year bull market.
___________________________
Trader's Gold Subscribers get a comprehensive view of the market, including hourly (and even smaller timeframes, when appropriate) on a daily basis. They also receive updates through the comments area. I provide only the daily timeframe for the free blog, as a "snapshot" of where the market currently trades and the next move on a weekly basis.
______________________________________
Sign up for: The Chart Show
Next Date: Wednesday, August 29 at 5:00 pm EST (US market time)

The Chart Show is a one hour webinar in which Peter Temple provides the Elliott Wave analysis in real time for the US market, gold, silver, oil, major USD currency pairs, and more. You won't find a more accurate or comprehensive market prediction anywhere for this price.
Get caught up on the market from an Elliott Wave perspective. You’ll also get Andy Pancholi cycle turn dates for the SP500 for the balance of the current month. There’ll be a Q&A session during and at the end of the webinar and the possibility (depending on time) of taking requests.
All registrants will receive the video playback of the webinar, so even if you miss it, you’ll be sent the full video replay within about an hour of its conclusion.


Hi Peter, Thanks for the support/update. I have a decline from 20,21 August into 29th of August. That fits. Perhaps 31th. As far as I can Look (1 month) I don’t see any decline after 29th (perhaps arround 1-2 Sept.) So up we go to 5/6th Sept.
Watch http://www.prognoseus500.nl/ Now every day I mutate the site because of the possible hughe decline. But be carefull with your trade. I trade in december 2018.
Interesting how that works out.
Interesting September no doubt .
Cash Dow will probably poke above the 25,800 level
Resistance at 25916 up to 26052 .
Above there after Sept 9 and I have to admit defeat .
You have been doing a great job with these swings Peter .
Great update
Joe
Great insight as always Sir PETER. Each week we get a masters class!
I know EW shows expected moves up and down but is not so good on timing. I agree on your projections but not so sure on how quickly this could possibly unfold. Beauty is in the eye of the beholder..
In your post above you commented and I quote “We might be looking at that final wave taking about a month or so.”
Correct me if I’m wrong in my logic but I’m thinking we get this C wave down quickly like in Feb, but this B wave up is going on 6 months now and the 3rd wave was a good year. If SPX does in fact go down to 2300-2500ish then it would need a 350 to 500 point move to get back to a new high. Couldnt that take us deep into 2019? What am I missing?
Charles,
You have to think of patterns as separate elements. So a fourth wave has to have a certain amount of time to it to “look right.” Gann said something to the effect that time is more important than price. The final fifth will likely behave similarly to the third wave (because it’s a continuation of the trend). There are other factors, if you like. Summer doldrums affect the patterns, so you’d expect the summer months to be choppy and frustrating due to the low market participation.
I expect the fifth wave to take place when Wall Street it back, so volume will be up and we’ll have the usual ramp up at the beginning. So all these factors go into my thoughts on the forward motion of the market. At the same time, it’s difficult to gauge because the fourth wave patterns aren’t confirmed yet, and they have a lot to say about the length of the fifth wave.
Im out of town at the moment, so I can’t access my normal charts, so I can’t provide any examples at the moment.
SPX somtimes behaves like a commodity by displaying incredibly swift, manic fifth waves, sometimes as dramatic, or more so, than their third waves. We are currently seeing such ab example in Gold. Having said that, I also no longer expect a Fall third wave, and agree with Joe’s January timeline after a possible massive “Santa Clause” rally. Of course if a top is already in, a Fall crash would be right on schedule….
Cant wait to get long and recover a lot of the money i have wasted going short and getting stopped out repeatedly. Need to ride this epic bull market once at least maybe in its final leg.
Too many whipsaws to attempt to ride this market, whatever the immediate trend. If you are not scalping the moves, taking profits in hours, rather than days, you are likely to get stopped out.
This market has been a swing trader’s nightmare especially if you are trading the indices. The algos are becoming ever more sophisticated and are clearly fine tuned to run the stops of any trader trying to swing trade the moves. That approach has not been working for quite awhile frankly, and the problem will persist, even in a final wavenup.
It lends quite a bit of credence to Peter’s long-standing argument that what we have been dealing with are corrective waves, which simply cannot be traded like impulses.
Well – if we are indeed close to a historic top, we need conditions that leaves very few shorts going into the crash. Shorts are now accustomed to monetizing quickly which means they will likely have reduced their position before we hit wave 3 of 3 down. I am expecting the FED to stop hiking rates BEFORE the market top – which leaves me leaning towards Charles’ view that wave 5 may be long. Not a bad idea to ride that long once get through this period. A market rally post November elections can be big.
The unwind this time could be a bit different for a few reasons.
First there is the unprecedented amount of leverage now in the market, particularly in the tech sector.
In addition as many have observed, any serious initial decline is going to force selling in a lot of passive investing instruments, the number of which now far exceed that at the last market high in 2007. The size of those ETFs in many cases represent a large a share of market cap as actual shares being held by investors!
The cascade of selling that will be triggered by the initial impulse down is going to be unlike anything we have ever witnessed imho.
I think the break of specific price pivots are going to give us a very big clue as to when these forced exits are beginning and have those levels in the indices marked in bright red. I agree that the turn is once again like to come when the fewest are looking for it to materialize.
New ATH in SPY. SPX will certainly follow.
How? I have SPY all-time high @ 286.63, almost a dollar away from todays close.
Very strange discrepancy depending on data feed. Not sure why.
SPY officially hit an ATH. Many a people doubted me when I said SPY and SPX would hit a new high soon. To them bandits I drop my flag and one parting word “touché”. My target still 2875-80 for SPX.
Yep. Sure looks like we are in a fifth wave to the upside. A final top may be closer than many think!
Yes the SPX hit new ATH too! Collecting some good coin on my calls!
Hi Verne,
I put in the dates in the Expanded Flat ( http://www.prognoseus500.nl/ )
The red line indicator must confirm it. On daily base I update the site.
(Peter I used the picture of the Expanded Flat. I hope you do not mind)
Great call by John and Willem for a rally into Aug 21st. Given that I have no expertise in short term market calls, it is outright amazing to see people make these calls with greater than 60% accuracy.
Well, all I can say that in a bullmarket the lows are shallow and short lived, looking at the August 15 low, we are already up 70 points.But maybe we will drop till SP500 at 2800 again.
Today, I have my big turningpoint with a low on August 29 and 31, after that we will go up till September 11.
Nasdaq really has the look of an ED but that pattern is invalidated by the relative heights of wave one and three. A very interesting looking pattern. It has to be an impulse as that is all that is left. While not techincally an ED, it sure does look “wedgy”, and I suspect it will terminate the same way a typical ED does.
Steep negative divergences persist at all these new highs.
With spy & spx at ath, what does that do to the count?
Only two possibilities. Either some kind of expanded flat or we are in a new impulse up. I suspect it is the latter.
Reloaded long volatility trades. EVERYONE is absolutely convinced we are just finishing wave one of a new impulse up and are heading much higher after a shallow 2nd wave correction. Steep momentum divergences at these new highs suggest caution for long trades imho…
Futures now confirming today’s exquisitely laid bull trap. Traders chasing the ramp are going to get roasted!
Looks like Mr. Moon will have the last laugh…!
Now we might head into the 4th wave down. They sold right back into that rally. And futures look that way as well.
Yep. The volume was a dead give-away.
Need a break below 2790-2802 on ES to have confidence on the bearish call. If the market can do that, we will definitely have chatter of a “double top” in ES.
Sold my puts on the AEX this morning, we are already in the green..
Buying stampede into stocks or 800 pound roadblocks? – Chris Kimble | August 22, 2018
https://kimblechartingsolutions.com/2018/08/buying-stampede-stocks-800-pound-roadblocks/
noteworthy commentary and charts…
Yay! Thank you Mr Market! My calls from yesterday doubled! Buying EVERY dip. Like McD’s I’m loving it!!!
They are pulling out all the stops to prevent an exhaustion gap from Monday’s open. Steep negative divergences confirmed at recent highs.
Massive leveraged shorting of VIX to juice risk parity trade. These are not signs of a healthy bull market, they are signs of panic. All leverage eventually has to be unwound.
IMO we are now waiting on Dow and NYSE to make new new highs before next major leg down.
I forgot to day was VIX OpEX. Typical aggressive shorting of vol to blow up at, or close-to-the-money options. The spike down when they do this is typically much more pronounced so we continue to see steady accumulation of long vol positions. Interesting VIX divergence at these new ATHs in the indices.
DOW theory says that you need ATH non-conformation among major indices and DJT to confirm the onset of a bear market. The new ATH in DJT means a new DJI ATH will confirm the current bull market as alive and well. It seems to me that would also be confirmation that we need a fourth and final fifth wave up to go before we have a top. It is at that final wave up we could expect to see non confirmation. Clearly this also implies that, if we need a fourth and fifth wave up for a final top, either DJT or one or more of the major indices is now putting in a final top, and will be in a corrective wave when the others make new ATHs, which will issue in non-confirmation and the onset of a bear market, as outlined in DOW theory.
Triple dojis in the making. They pumped in billions to attempt to intimidate short positions and hammered VIX to juice the parity trade, yet they are going nowhere fast. Buckle up. They are very likely about to get hammered. Best of luck traders! 🙂
I’m thinking they keep hammering the vix lower for a good while. If we still need Dow and NYSE to top. Maybe we get a hammer down into Mid Sept?
Thinking of buying some VIX puts in anticipation of this continued rally
The cash Dow has now poked above the 25.800 level
Which keeps the potential large triangle ( my view for a long time )
On track . I’m not about to make any hey I’m right claims at this point though .
I see above several posts saying the spy or spx or both hit new all time highs recently .
I am not aware yet I will look .
The cash Dow though failed ( so far ) time wise I can’t really give the market past Sept 9 .
So if after Sept 9 I’m seeing new highs ( all time highs in the cash Dow ) I’m accepting
I’m wrong .
Bottom line: the cash Dow has met the minimum requirements for wave B of a further
Developing contracting triangle formation . If and I’ll say if the spx actually did print a new all time
High I will keep that in mind as maybe an expanded flat in the spx yet honestly I am not sure what
To make of the spx if a new all time high was printed . My bias though is bearish into January next year
But price is and has not been proving me correct at all .
Cash Dow has satisfied wave B of a potential large multi month contracting triangle .
Spx I do not claim to know at this juncture .
Come October we enter a technical ” Venus bull market ” cycle and come January we enter a mars Uranus
Bull cycle .
Because this market has held up fairly well during this bearish cycle I’m thinking ( just thinking )
The Dow will hold its Feb and April May lows . The down turn ( if it comes ) in wave C will be followed by
Waves D and E .
I’ll be moving my upside targets up on the cash Dow for the final high .
I have to admit this sounds ludicrous and or plain rediculous yet
32,000 up to 38,610 on the cash Dow does show up .
Yes I am bearish into Oct 12 as well as Jan 20 2019 yet I have been considering
This entire year of 2018 as a sideways wave 4 .
One thing we must consider is the larger move up from the low in the year 2009.
Whether you chose to call it a huge B wave or a wave 4 ( 2009 low ) the wave count
To date does leave a mixed message .
In my view the year 2000 top was the top of wave 3 and from the year 2000 to 2009
and I can include into the years 2011-2012 we had wave 4 of a very long term degree .
From the year 2000 to 2009 would have to have been an expanded flat wave 4
And if you called it from 2000-2011 or 2000-2012 then it was a very large wave 4 which
Would be a screwed up triangle formation .
The reason I bring up Nov 2012 is based on the work of the late George Lindsay .
Using his 12 years 3 months to 12 years 8 month time window from a major high
To a major low . NYSE peaked I believe Aug 2000.
12 years 3 months from Aug 2000 targeted Nov 2012 .
If you count the nasdaq and spx March 2000 top and count 12 years 8 months it targeted
Nov 2012 . Specifically those target dates surrounded the presidential election in 2012 .
The question that arises from this is not a mute point . When did this bull market really begin ?
Was it really the March 2009 low ?
I could ask when did the bill market begin 1974 or 1982 ?
Was it really the 1966 top or was it the 1969 top ?
We as humans tend to define print highs and lows as start points
Or end points . Elliott wave technicians use the term Orthodox high
Or Orthodox low . That is just an opinion though and over time it must
Be confirmed by price as well as the larger wave count that unfolds .
For example . How can it be that we had a wave 4 from 1966 to 1982
A span of 16 years which mind you waves 1 2 and 3 were from 1932
To 1966 Which was a span of 34 years .
So waves 1 through 3 lasted 34 years wave 4 lasted 16 years
Then we now have to accept we had waves 1 through 3 of wave 5
For a span of 18 years or 25 years if you wish if you claim wave 5
Ended in 2007 . It doesn’t add up .
Wave 3 is the longest and strongest wave .
1937 fits as a wave 2 low so roughly 29 years for wave 3 ( if you accept the year 1966 high as wave 3 )
I’m a big believer in Elliott wave theory so don’t take this wrong .
The wave count many have accepted as gospel though I cannot aggree with because
The wave counts do not fit the rules .
The rally from the 2002 low to the 2007 top was only 3 waves .
So and expanded flat wave 4 does fit .
There are also conflicts with the 1921 to 1929 wave count .
That said , it’s not Elliot wave theory I have an issue with it is the general Elliott wave count
That has been regurgitated from Robert prechters earlier work .
Honestly I feel Robert prechter is an excellent market timer yet a very stubborn Elliott wave technician
I do not know his views today but I do see some charts with labels that never change despite what the market
Has done which has proved those counts wrong .
Also the view that comoditues have ” extended 5th waves ” should really be questionable.
C waves can extend yet wave 5 should be weak .
Just because the market proves one wrong does not mean you just extend wave 5 to the sky .
It means you ask yourself why was I wrong and toss the entire chart in the trash and relabel it .
1 2 3 4 5 looks nice but sometimes it’s 1 2 I ii iii iv v 3 a b c d e 4 I complex II III simple 4 then 5
The long count is wrong on many Elliott wave charts .
Or ? It’s just a huge multi decade 3 wave move in which case just like most all commodities
We go all the way back down.
There is no Elliott wave rule that states you must have 5 waves . How ever 5 waves is indicative
Of a trend . A 3 wave move implies a complete reversal .
Look at us treasury bonds from the year 1980 to dates .
Joe,
I don’t understand where this rant has come from …lol. The wave up from 2002-2007 was in 5 waves (it had a small 5th wave, but waves at tops typically do). That’s clear. The DOW is not currently in a triangle of any kind, much less a contracting one. 1974 was the end (and bottom) of wave 4. Wave 5 doesn’t extend all that often, but it does. We had that happen earlier this week in ES.
Taking the current cycle wave up from 1933: Waves 1-3 were 33 years. Wave 4 was 8 years (1966-1974). That makes wave five 33 years (1974-2007). When wave 5 extends, it’s typically the same length as waves 1-3, so not sure what the issue is (you say it doesn’t add up, but I don’t understand what that means – add up to what?
I get perturbed when people throw out all these misnomers about Elliott Wave with no explanation or backup. So just clearing up some misconceptions here.
I’m with you Joe, imho 1982 was the start not 1974, 2017 was the start not 2009. We’ve only just begun.
In terms of EWT, I like the post event labelling, but its like a newspaper to me. I don’t see any predictive value as waves can extend or be relabelled. It is useful when a new high or low are formed, but the so is support and resistance. Fibs can be applied without EWT too. I like what you do Joe so keep it up.
There is no imminent crash imho.
ATB,
Kerry
Peter T has clearly and consistently stated that the market needs to go on to new highs after the next correction. That position in my view does not suggest that a crash is “imminent”. If I misunderstood the implication I will gladly stand corrected.
That is indeed correct.
Joe, could you repost that link to the chart of the DJI triangle? I only
vaguely remember what the proposed legs looked like but I do remember your comment about the 25,800.00 level. Thanks!
Bought back my shorts on the AEX this morning, I m still expecting the SP500 to drop until end of the month but next week will be the most important.
Well – If we don’t get something next week, we may have to wait a few more weeks. This is starting to feel like 2006 – 2% drops every month on way to new highs month after month.
Hi John, I stopped with the AEX.
all my indicators predict the movement of the S&P500. I think yours too.
So I trade the S&P500. De Giro beurs CME option ES (E-mini S&P500).
Just watch it for a while.
It is quite amusing how the market makers ambushed the BTF dippers this morning.
The signs were all there.
I previously mentioned how the market makers did not seem to price into options delta any kind of lunar cycle effect. Not only was no premium in option prices this morning, we saw the absolute insanity of VIX below 12!!
I did something today I almost never do, and that is use margin in my account to add to my long vol position. 200% long. These banksters are nuts!!!!
Already pulled a 50% pop on VIX 11.00 strike calls with margin boost and cashed out.
Rinse and repeat on any move back below 12.00 Free money people!
It looks to me like the market may be setting up for a move down to the 2800 area tomorrow for an interim bottom. I would not be surprised to see a swift completion to the move down and and a ramp higher next week. The steep momentum divergences at recent highs need to be resolved and that could happen with a swift hard fall that sets up for the next move higher. The A/D line and OBV has remained bullish so we probably not quite done with new ATHs
I bought some oct uvxy puts in anticipation of continued ramp up on markets and hammer down on volatility. Looking for 50-100% gain
Vix should go below 10 from here IMO
August 7 is still the top for the SP500, so I hope we will duplicate the last drop Aug 15.
But this one should have much more impact,what will trigger it?
Sorry I meant August 21.
I learned in the mid 90s..a market that refuses to go down is a bull market. This market reminds me a lot of mid 90s. Waiting on SPX 3000+ now. Probably a couple more years before we hit the 2000 crash. IMO
If you look under the hood. You will see ample reasons to be cautious.
I would not be shorting volatility under the circumstances…
The best time to short vol is the same day you see a VIX spike sporting a long wick.
Don’t think we could see another sub-10 vix? Seems every dip gets bought up and today vix was down even on a down day telling me not much expectation for a down market anytime soon.
The key thing to keep in mind is that the short vol/risk parity trade was busted back in February. I have a sneaking suspicion that the the carnage from that implosion is still not fully accounted for. It is possible that some debts were forgiven quietly as was the case when SNB unexpectedly broke the Franc/Euro peg. Of course vol is going to continue to spike up and down as there are those who continue to aggressively short it (banksters) in an effort to keep the risk parity trade alive and well. I suppose as long as your short trades have a built in limit loss you should be fine. The idea that that gap fill from last Feb is pointing to a lower low could be a dangerous assumption imho.
I wonder if Peter T’s wave 4 can manifest itself as shown in his ES chart above given the swiftness of the Jan/Feb decline it could well happen but as i am not an Elliot wave scholar like Peter and many here could wave 4 end higher than the Feb lows on the s&P or is it the case the feb lows MUST be tagged as a minimum?
Personally i think if peterTs wave four takes place the dow will indeed exceed the FEB lows but i cannot see the s&p ding the same given its current elevated levels.
Thanks in advance Peter T and anyone else who can answer whether or not the wave 4 in the ES must be exceeded from and elliot wave standpoint ?
I am not an EW expert but I think the key is that the C wave down will either equal the A wave of the Feb low or exceed it by some fib ratio, and that is the basis of the two potential targets Peter has identified. If that count is correct and we are on the cups of a C wave down, it will indeed at the very least tag the higher target.
Hi mdss,
The only way I can see the C wave not drop to a new low is if we trace out a running flat. The C wave would not go to a new low. However, running flats are really rare and the B wave would have to head up higher so that it’s longer than the A wave, which, at the present time, I don’t expect to happen.
Thanks Peter much appreciated
So you are expecting a huge decline that takes place in swift succession much like the jan/feb decline i.e. less than 8 trading days in total.
I think you are a alone in that thinking but as the saying goes “Eagles fly alone!”
Thanks again i am eager to see what transpires.
Well, the eight days is a bit tight. As this top keeps elevated the bottom moves with it time-wise.
Thanks peter that makes sense.
Peter t
I read your comment to my post .
Ill keep my reply short .
I will make a point of clarifying my post with data
Yet at this time I have 3 weeks to go before being able
To do so . To add to this imgr, which holds several but
Not all of my saved charts in a picture format is not
Working as I write this .
My ” rant ” was about my own thoughts as well as several
Typical Elliott wave charts on the web and was in no way
A post about Peter t or any of Peter t’s previous post in regards
To Elliot wave .
My point was to stir up thought of those who come here
And to get people to open a discussion about the larger picture
And to think about what is taking place today and how it fits together
With the past 88 years .
Lastly : it has taken me a very long time to toss out the idea of an
” extended 5th ”
To me it just doesn’t fit .
I’ll make sure to add my reasons and back up what I am saying in the future.
Keeping this short .
Enjoy your weekend everyone
Joe
Joe,
Well, I’ve seen quite a few extended fifths, most commonly in first waves. Look forward to the explanation. Have a great weekend.
It is not ckear to me whether the repeated dive of VIX below 12 is truly owing to the madness of crowds, or machine trading run amuck. I don’t really care. I continue to buy truckloads of 11 strike call options each time it happens. Filled at VIX 11.90 with virtually NO premium. Already up 15%. Talk about insanity!!!
Today is up till……………………..
Next Monday / Tuesday will make a lot clear. We make a deep LOW (or we go up into 5/6 September) watch http://www.prognoseus500.nl/
I bought the dip and worked out fantastic today. I thought it would have dipper lower but the bulls are unstoppable. My self-imposed shorting ban is working well so far. Zero losses but means taking profits quickly as the drop will be steep when it eventually arrives and wouldnt want to be caught out.
Told you, it works like a snake charmer..key note, S&P hit my project target in the 2875-80 range. Taking a good chunk of my calls off table as im long since 2600 spx and though i have a month or two to expiration..dont want to get greedy. Will move profits to short term buy on dips. Dow has 800 more points to a new high so I see SPX could flirt with 3,000 before next drop.
Yep! You called it.
Peter T you were right on the money about ES heading back up! 🙂
I am still accumulating long vol at these prices. Yikes!
Steep divergences at these new highs persist!
Gotta take into account that everything is moving in tandem, with the dollar at the heart of it. So, I’d expect a lot of divergence in various asset classes. It’s crazy, but it is what it is. As I say, “trade what you see, not what you think.” We can’t head down with a three wave start.
So if we are waiting on DOW and NYSE to top..we need 800 dow points..almost 3% and 600 NYSE points..almost 4.5%, that could mean 4% more for SPX IMO taking it to just about 3,000! Loading up the truck on some new long positions. Loving this market. Traders gold for sure!
Good luck! 🤗
Well, the August 21 turningpoint did not hold, I have an other important one this Sunday august 26.
So let’s wait and see.
Everyone, and I mean EVERYONE!, is uber bullish. What I see are persistent confirmed negative momentum divergences at these new highs, and VIX in an unbroken uptrend having filled the last downside gap.
Have a great week-end everyone!
Mr. Verne, Its difficult to not to be uber bullish when EVERY dip..big or small..gets eaten up like my tacos on taco tuesdays. Right now..dem Bears have as much follow through as a jar of molasses.
I follow price action. Until Peter Ts 2790 gets breached im staying long. No offense. I see the divergences and they give me some pause but price keeps grinding higher so i shall follow the leader with mr price.
None taken. I know you are a nimble trader so I have no doubt you will fare well. I also primarily am a scalper, but I still like to make even my short term trades in the context of the larger technical picture. The last time we saw momentum divergences this steep, in every single case we saw a substantial decline follow. Without exception. In fact the current divergences are steeper than in last January. Knowing that, my trading strategy dictates getting positioned for a 10X downside trade rather than scalping a 3 to 5% additional upside move. It is really all a matter of trading style, not right or wrong. 🙂
It looks like we have sucessive inversions at the last two lunar cycles. NDX appears to me to be a completed wedge.
Interesting read from Raymond merriman in this post .
He gives some insight to cycles and how he uses them.
Nothing wrong with learning something new from time to time .https://mmacycles.com/index.php?route=blog/article&category_id=1&article_id=213
Thanks Joe!
I have to say I read that Merriman post and was totally lost. I am not at all sure what the point was that he was making as it all seemed quite vague. He mentioned several planets being retrograde but seem all-together ambivalent about whether that had bullish or bearish portents. Just my own take on the read.
Also with the S&P now joining the ATH party, i bet we are waiting on the two US laggards..NYSE and DJI..to hit new highs so we get peter t’s “all 1 market”. That means the russells, s&p, nasdaqs etc. all keep climbing higher and higher until last 2 ponies show up at the event. Then we get a dramatic pullback. Thats why s&p getting to 3k is not out of question IMO.
Bear markets usually arrive after DOW Theory non-confirmation. Clearly this means that at the final highs there will be at least one important index diverging and thus the “All One Market” idea cannot apply at the final tops.
I agree otherwise with those targets. 😛
Good point Mr. Verne. I looked back at 1999 and 2000 to see if i could whip together a conclusion. Todays market reminds me of the 90s so i wanted to see if there was a good parallel.
Dow topped in Jan 2000 and dropped 16%..while NQ didnt top until Mar 2000. NQ rose almost 9% while Dow dropped..so there was a pretty dramatic divergence back then as you described. Dow confirmed a top was in while tech kept grinding higher.
After the Dows 16% drop it recovered most of loss then took almost a year to make a new low. Looks kinda similar to whats going on today. Tech fell off the cliff starting in mar 2000 but never made a new high like todays market so there is some difference between then and now but your point is well taken. Caution warranted yes, but i still think theres plenty of upside BEFORE we see a major decline.
IMO We most likely get a healthy correction sometime soon. Then another year or two of the bull market then the ferocious bear comes knocking at Mr Rogers door and he wont be a ‘friendly’ neighbor.
A new weekend post is live at: https://worldcyclesinstitute.com/mister-moon-the-market-and-you/
This website is for educational purposes relating to Elliott Wave, natural cycles, and the Quantum Revolution (Great Awakening). I welcome questions or comments about any of these subjects. Due to a heavy schedule, I may not have the time to answer questions that relate to my area of expertise.
I reserve the right to remove any comment that is deemed negative, is unhelpful, or off-topic. Such comments may be removed.
Want to comment? You need to be logged in to comment. You can register here.