
Multiple Major Turns
![]() I’m dubbing the impending turn as “The Turn of the Century.” It’s not the top of the market, but there are turns happening at the same time in the US Dollar (and related currencies), the US indices, and gold and silver.
I’m dubbing the impending turn as “The Turn of the Century.” It’s not the top of the market, but there are turns happening at the same time in the US Dollar (and related currencies), the US indices, and gold and silver.
It looks to me like they’re ALL going to change direction during the coming week (perhaps earlier rather than later).
For over two years now, I’ve been saying that we’re going to see all major asset classes gradually align in their movements to end up at a top all at the same time. That’s what you’re seeing. I refer to it as “All the Same Market,” a term that was coined by Robert Prechter quite a few years ago.
It’s one of the reasons this market has been so difficult to trade: Every asset class depends on the movements of all the others. In other words, the US Dollar (being the reserve currency) is in control, as everything pretty much relates to it in today’s financial world, and all asset classes have been slowly moving into alignment with its movement.
At the same time, all assets have to conform to Elliott wave rules in terms of how they move, which they’ve done, but it has meant some long periods of waiting (eg- USD currency pairs) as other asset classes move at a faster rate. It’s made for some very odd movements and, as a result, a very difficult market to trade.
That’s about to change as we trace out the remaining waves to the ultimate top.
Non-Confirmations
There are almost always non-confirmations at the top of a market. In other words, patterns in the various US indices don’t match, or different asset classes make major turns at different times.
I would expect nothing less at the top of a 500 year bull market. However, in the past few weeks, I haven’t paid a lot of attention to it, because until patterns are fully developed, there isn’t much need: It ends up being fairly speculative.
For example, both the SP500 and NYSE morphed out of perfectly good contracting triangles into something that looks like an ending diagonal … BUT. The “but” is there because there are problems with calling some of these patterns ending diagonals. They either don’t look quite right or measure improperly. However, some of the patterns have changed over time. However, we’re at the end of this B wave up in the US indices and virtually everything is aligned for a turn.
Now that we’re in the final 5th of 5th wave up in the so-called “third wave” of these patterns, it’s time to focus in more specifically on what we have here, because the length of the next move to the downside will be a result of the pattern we’re in.
Now, let’s Look at the NYSE …
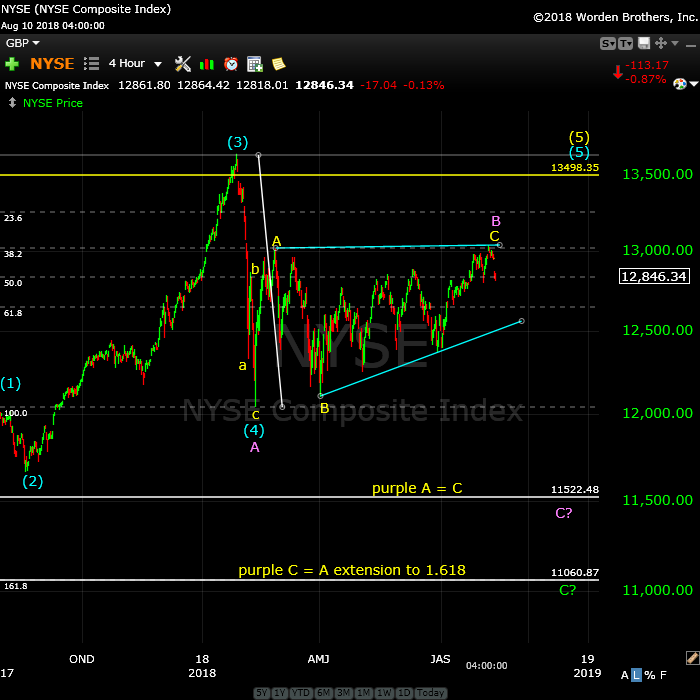 Above is the 4 hour chart of the NYSE. I always go to this chart to ensure I have the right count, because this is the largest market cap exchange in the world, as all the major indices you follow (Russels, OEX, DOW, SP500 and ES) all fall under its umbrella. This chart is my “truth-teller,” as it’s not directly traded and therefore is devoid of most of the “animal spirits.”
We’ve been following the changing shape of this index as it morphed from a perfect contracting triangle into what looks like it might be an ending diagonal, except that is can’t be. Here are the reasons why:
If this pattern is an ending diagonal, with the top of the third wave being the current high (13,039), the fifth wave of an ending diagonal must not be longer than this third). However, doing the measurements, a projected wave five (measured from the highest level of the fourth wave trendline) cannot possibly reach a new high. Therefore, the ending diagonal option is off the table.
That leaves only an ABC pattern, which means we’re expecting a C wave down. In that case, there are two most probable targets:
- 11,552, which would mean the C wave will equal the length of the A wave
- 11,060, which would mean the C wave will drop to a 1.618 extension of the A wave
The C wave could go lower, but that’s less likely. Because we have an A wave that is in three waves, the first option is preferable, imho. This will result in an overall ABC pattern, which requires a new high.
Bottom line: I expect a C wave down before another wave up to a slight new high to end the 500 year rally.
And in my opinion, this prognosis also affects the SP500 (and ES), which have patterns that look like ending diagonals, but for a number of reasons, these patterns are already on shaky ground.
As my Trader’s Gold subscribers know, my prognosis for the SP500 and futures have changed slightly. I don’t think we have an ending diagonal in ES. I’ve provided my preferences under the ES chart below.
The overall view of the market has not changed. The only thing that has is my projection to the downside for the next wave, which will likely turn down early this week.
_____________________________
Elliott Wave Basics
There are two types of Elliott wave patterns:
- Motive (or impulsive waves) which are “trend” waves.
- Corrective waves, which are “counter trend” waves.
Motive waves contain five distinct waves that move the market forward in a trend. Counter trend waves are in 3 waves and simply correct the trend.
All these patterns move at what we call multiple degrees of trend (in other words, the market is fractal, meaning there are smaller series of waves that move in the same patterns within the larger patterns). The keys to analyzing Elliott waves is being able to recognize the patterns and the “degree” of trend (or countertrend) that you’re working within.
Impulsive (motive) waves move in very distinct and reliable patterns of five waves. Subwaves of motive waves measure out to specific lengths (fibonacci ratios) very accurately. Motive waves are the easiest waves to trade. You find them in a trending market.
Waves 1, 3, and 5 of a motive wave pattern each contain 5 impulsive subwaves. Waves 2 and 4 are countertrend waves and move in 3 waves.
Countertrend waves move in 3 waves and always retrace to their start eventually. Counrtertrend (corrective waves) are typically in patterns — for example, a triangle, flat, or zigzag. Waves within those patterns can be difficult to predict, but the patterns themselves are very predictable.
Fibonacci ratios run all through the market. They determine the lengths of waves and provide entry and exit points. These measurements are really accurate in trending markets, but more difficult to identify in corrective markets (we’ve been in a corrective market in all the asset classes I cover since 2009).
To use Elliott wave analysis accurately, you must be able to recognize the difference between a trend wave (motive) and a countertrend wave (corrective). There’s very much more to proper Elliott wave analysis, but this gives you the basics.
____________________________
Registration for Commenting
Want to comment? You need to be logged in to comment. You can register here.
If you register, it protects your information. It also allows you to comment without filling in your information each time. Once you’re registered, simply go to the home page and click on the login link top right in order to log yourself in. Usually, you’ll be logged in for several days before needing to be logged in again.
______________________________
Problem receiving blog comment emails? Try whitelisting the address. More info.
______________________________
A true expert in Elliott Wave FL 2
A true expert in Elliott Wave …You are a true expert in EW analysis. What you provide is not available anywhere and is priceless. Subscription on your services is the best thing I have ever done. Many thanks for your effort to make me a better investor. I now have more trust in my investment decisions. I hope you will continue the excellent work! —FL |
Couldn’t be happier … KK 2
Couldn’t be happier …The analysis and insight you provide is simply amazing! I’ve been trading the futures and equity markets for well over thirty years and usually average around 5% monthly. Since joining your Traders Gold Service two months ago, that number has better than doubled. I couldn’t be happier.—KK |
the real deal SM 2
The real deal …‘Educational, insightful and thorough market analysis for all levels of traders. It’s Elliott Wave at its best….Peter Temple is the real deal’ —SM |
Tops in your field DZ 2
Tops in your field …You are tops in your field. Tried to follow Elliot Wave international for years. They were always behind the market. After discovering you, I perceive that you are an expert in reading the waves, which puts you way ahead of the rest of your peers. And you can read the Waves like you are reading tomorrow’s financial section. I pray you stay healthy. —DZ |
The best of them JL 2
The best of them …Last couple of years, I subscribed to several ‘market traders’. You are by far the best of them and the personal contact is awesome. Daily and daily updates are very well written! Besides your expertise in EW, I also like your cycles analysis. Best investment I ever made! —JL |
Rise above the rest … SM 2
Rise above the rest …I have only ever met a few people who, in their chosen fields (astrology, medicine, music, martial arts, technical analysis), rise above all the rest and you are one of them…you have ‘the gift’…and that’s why I’m a Trader’s Gold member. —SM |
Get an upper hand … JC 2
Get an upper hand in trading …Seeing all the different currency pairs and the wave structures and hearing you explain why this has to do that on a nightly bases gives one a upper hand when trading. Elliott Wave applies to all stock and indices and can be applied to any candlestick chart. If someone ask what you want for Christmas – Tell them a membership to Peter’s “Traders Gold!”—JC |
Have not had a losing week RW 2
Have not had a losing week …I have been with Peter almost a year. The only thing that matters is have I made money with his service. I think I have finally turned the corner using Peter’s EW. I have not had a losing week in the last 5 months. Thanks Peter, for your amazing amount of hard work. —RW |
The Market This Week
Here's the latest daily chart of ES (emini futures)
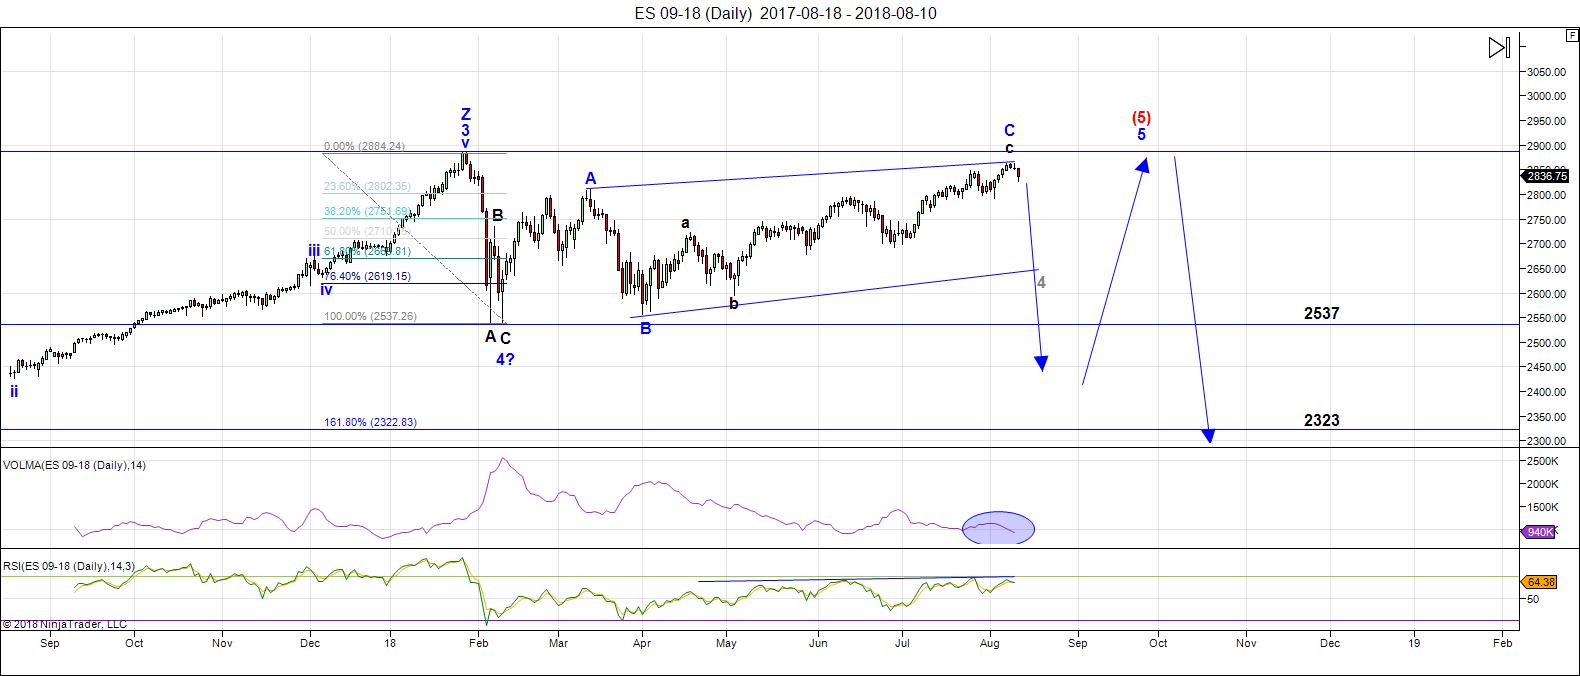
Above is the daily chart of ES (click to enlarge, as with any of my charts).
Although I'm still showing the ending diagonal trendlines, my preference is for this pattern being a regular flat.
This is due partly to the look of the current "third" or "B" wave up that we're currently at the top of. It hasn't quite topped (look for one more wave up at the beginning of the week) but once it does, it should drop to a new low to at least the 2537 area and probably lower.
My preferences (in order of probability) now for the unfolding pattern in the daily ES chart is:
- a regular flat (meaning a C wave down in 5 waves to a new low)
- a C wave as the end of an ABC fourth wave correction (similar to the projection of the NYSE provided above)
- an ending diagonal (this is now a very distant third option), which would lead to a wave down the the 2625 area
We're still waiting for this complex B wave to top. Last weekend, I predicted one more wave up to a final high and that still seems to be the case (after a couple of wave failures). The waves down are corrective. I do not expect a new all time high before we turn down in the expected C wave, as that would change the count and pattern completely.
Summary: We're waiting for a top in a B wave, which will result in a C wave to a new low. Once the c wave (down) is complete, expect a final fifth wave to a new high. That fifth wave up to a new high will be the end of the 500 year bull market.
___________________________
Trader's Gold Subscribers get a comprehensive view of the market, including hourly (and even smaller timeframes, when appropriate) on a daily basis. They also receive updates through the comments area. I provide only the daily timeframe for the free blog, as a "snapshot" of where the market currently trades and the next move on a weekly basis.
______________________________________
Sign up for: The Chart Show
Next Date: Wednesday, August 22 at 5:00 pm EST (US market time)

The Chart Show is a one hour webinar in which Peter Temple provides the Elliott Wave analysis in real time for the US market, gold, silver, oil, major USD currency pairs, and more. You won't find a more accurate or comprehensive market prediction anywhere for this price.
Get caught up on the market from an Elliott Wave perspective. You’ll also get Andy Pancholi cycle turn dates for the SP500 for the balance of the current month. There’ll be a Q&A session during and at the end of the webinar and the possibility (depending on time) of taking requests.
All registrants will receive the video playback of the webinar, so even if you miss it, you’ll be sent the full video replay within about an hour of its conclusion.


Thank you Sir PETER for your continued brilliance. Few analysts are as precise and matter of fact as you are. Muchos GRACIAS! One quick question on ES. There may be a head fake or two before the real move in my earnest opinion. What level will ES need to drop to for confirmation of the 4th wave?
Charles,
haha … you’re welcome. At this point, I’m calling for a C wave of the fourth wave (rather than a fourth of an ED), but it’s always the previous small fourth of one lesser degree that provides that clue, and that’s still around 2790.
Hey Holmes
It’s a compliment Peter
One thing I’d add to your excellent update .
Percent moves :
C % decline = A % decline .
Thank you Peter
Joe
Well, Joe, my subscribers get that information but I can’t share everything they get.
As far as interests rates go, they’re not going up; they’re turning down, despite what the Fed says.
Joe, in this circumstance, would that be around 7.5%?
Elliott wave theory is about probabilities ?
I tend to think so which is why I agree with Peter t
In today’s update .
I have an issue with the Dow failing to poke above the 25,800 level
And I hate option expiry weeks because they tend to skew the data
As positions get unwound . It is not a forgone conclusion that the spx
Breaks below the Feb lows even though the NYSE or cash Dow look like
They have a high probability of doing so. We are still in a mercury retrograde
Time period which tends to flip the market all over the place .
My bias for the ” mini crash” stands but ….There is no 100% guarentees ever !
The end of August ( 29-31 ) should be important yet I give this market until Sept 9
Even with my bearish bias.
I expect suprises to the downside
The us dollar will eventually ( sooner or later ) effect corporate profits .
I guess it becomes a similarity to the 2000-2001 time period when the
Strong dollar caused a similar effect .
Add in overseas loans based on the US dollar and the currency risk
And we have a case for the US dollar going much higher then most imagine
As those who try to hedge currency risk panic and buy the US dollar.
They could also buy USA assets ( stocks )
Governments also will have problems trying to finance their debts .
It’s not going to hurt the average person if interest rates run higher
To 5-8% yet it will balloon deficits. All governments eventually default
There are so many things to consider going forward that my head spins .
As Martin Armstrong says: everything is connected
Thanks Peter t for your time and effort
SPX was a mere 16 points from a new ATH. If the current move down is indeed corrective, it is hard for me to see how we avoid a new ATH with any new wave up to complete a B wave. I guess that would change the pattern to an expanded flat.
Moon in Virgo Waxing Crescent Moon
The moon is currently in Virgo
The moon is 1 day old
Distance: 57 earth radii
Ecliptic latitude: 3 degrees
Ecliptic longitude: 168 degrees
Peter
I finally had some time ( and phone reception ) to
Listen to your interview with Steve puetz.
Off the top of my head, that interview was done back
In mid 2014. I also noted he did not go into detail on
Some of his new work back then ( he wanted his work published first )
That interview was very good and I found myself in agreement with
His comments regaurding ” time Windows” vs ” specific time “,
I also agree with him about market turn early or late vs the theoretical
Cycle turn window Yet as he states there is no shift in general of the next
Cycle turn .
Ed
If you listen to that interview , that was what I was talking about when
I mentioned left translations vs right translations .
Very good interview overall and if possible I think it would be great
To hear a follow through interview in the future if it’s possible .
Lastly : I view cycles from low to low but not sure if puetz does .
Hence the 6.37 year cycle turning down in mid 2014 or the 3.5 year cycle
Turning down leaves me to wonder where that cycle low would be .
Do I look out half that distance ? 1.75 and 3.18 years or ?
Taking that in mind , mid 2014 plus 1.75 and 3.18 years I get a very rough
Early 2016 to mid 2017 cycle low which was a very good cycle turn call !
If I then add those half cycles again though there is still some time left before
The next ideal cycle high .
Adding the full cycle ( low to low ) 2016 plus 3.5 ( I’m being general ) or 6.37
Late 2019 to 2023 points to a cycle low .
I agree in general yet I’ll have to refine this because I’m seeing something a bit differently .
Anyways
Thank you Peter for the time ( I imagine editing video is more time consuming then most realize )
I was completely wrong about the dollar. It broke to the upside from what looked like some kind of triangle. Some analysts see an IHS pattern which if correct, means the index is headed to 100.
This has big imiplications for equities.
NOT AN ENDORSEMENT
Erik Townsend and Patrick Ceresna interview Martin Armstrong | Published July 27, 2018
https://www.youtube.com/watch?v=B-Hhvtc9qGA&feature=youtu.be&a=
“Is there room for the equity bull market to continue?
Outlook on the global bond markets
Is a monetary crisis on the horizon?
Outlook for the U.S. Dollar
How do the geopolitics playout in Europe?
Short bonds long equities?
Perspectives on China and their credit markets
Where is gold headed next?
U.S. politics and the midterm elections
What is next for Russia/U.S. relations”
Economic Confidence Model | August 8, 2018
https://www.armstrongeconomics.com/future-forecasts/ecm/ecm-the-cycle-inversion/
“The entire world economy NEVER peaks and bottoms together”
Thank you Peter T for all you do. Wisdom is an incredible gift and you use yours to help others. It is noticed.
Jeff T
Thanks, Jeff, you’re being too kind.
While trying to help people is the underlying motive, I’ve learned that herding is an extremely powerful force … sigh.
And that is why I’ve shown up online. I’m trying to contribute what little I know … always learning.
Short of time.
Today was the Low and now up to the (last) High on 21/22 august. Indicators shows the same. I have checked Bradley with my indicators 2a and 2b and they turn the same with High and Lows from 25 of july (perhaps before also?) So if that continues we have the turningpoints t/m 6 september. http://www.prognoseus500.nl/
Be carefull
Thanks Peter and everyone else for your inputs. Its very helpful. I do see some chance that we get a head-fake move to form a double top on ES (maybe by 8/16 or 8/17 to around 2875-2878 area), but I cannot assign a high probability to that outcome. From a probability standpoint, I would much rather be short right now than be long to play for that last potential move higher. I do agree that we need to break below 2790 to have confidence in the short trade.
Peter, thanks for the update over and over again.
Aug 7 was the top, for now i have a low Aug 14/15, after that we will rebound till Aug 21 should be a lower high with a mini crash into the full moon or end off the month.
August 8 was Phi turn date so the August 7 top was right on the money. The next Phi turn is due October 2nd.
Yep. Nothing I see about this move down suggests we have a low in place.
Willem’s assertion a bit of a mystery to me….
From what I can tell, we have one more wave down in a fifth wave to complete a possible C wave, OR a small one of a larger C. VIX already tagging upper B band so hard to tell how much more downside. It will be interesting to see how the lunar cycle plays out this month as we are two weeks away from the full moon anticipated low. Interesting times!
Hey Joe,
Puetz’s work is not that useful in timing bottoms, as he himself admits. Essentially these cycles play out in an idealised fashion when emotions are running high – that is, when speculation and borrowing are rampant, and these tend to disappear at the bottom. Puetz work is based on harmonics of 3; each cycle is 1/3 or 3 times greater in length than its neighbouring cycle.
Dan
Verne, interesting how you reference a VIX tag of upper B Band today as a possible limit to downside market potential. Normally, that would be true, and it might be again, but for a couple of days now I have been noting an analogy, so far, between market action after Jan 26 high and after August 7 high. The Jan high saw three days trading at the high while this August 7 saw only 2. But the gap down is where the analog begins. They were both very similar in terms of magnitude on SPX. Friday, Aug 10 gap corresponds to Tuesday, Jan 30 gap. In both cases, the following day (today in the analog) saw a very slightly higher high than the preceding gap-down day, 1.51 SPX points higher in Jan and 1.20 SPX points higher today. On the following day (tomorrow, August 14 in the analogy), the futures opened the daytime trading session 8.75 points lower but held right around the previous day’s (today in the analogue) low. It was the next day (Wednesday of this week) when the collapse began! SPX was down 2.1% on a closing basis with the futures down 2.32%. But here is why I bring up the analogue now. The VIX Index was playing with the upper B Band as that happened in Jan, perhaps implying at the time that downside stock potential was limited, just as it is happening here. In January, of course, the VIX went from around the 14 level to 50 (!) within three trading days. Is that going to happen here? Only if the analogue continues 🙂 VIX past 2 days is right around 13-14 just as in Jan!
Very interesting Peter G. I also noticed that VIX hugged the upper B band for four days in June as well (22-28) so the current move certainly does not forestall additional downside. VXX also displayed sharp positive divergence at recent lows and I do not think a target of 39-40 is out of the question. I will be watching that analogy with great interest. It would align perfectly with the possible full moon low.
Sorry, June 25- 28
Not sure if many of you are watching crypto. Ethereum has fallen out of bed and BTC is testing some serious lows.
Luri – whats your chart say now.
Vernes post
August 8 was Phi turn date so the August 7 top was right on the money. The next Phi turn is due October 2nd.
↩ ∞
I find that interesting since I’m seeing Oct 12 ..
Dan’s post
Puetz’s work is not that useful in timing bottoms, as he himself admits. Essentially these cycles play out in an idealised fashion when emotions are running high – that is, when speculation and borrowing are rampant, and these tend to disappear at the bottom. Puetz work is based on harmonics of 3; each cycle is 1/3 or 3 times greater in length than its neighbouring cycle.
Thank you for your input Dan .
Peter G post
I’d paste it but it’s a bit long .
Thanks Peter g for your input as well .
I can add that we are in a few odd cycles that are similar
to January Feb .
In regards to puetz I’d like to finish with this .
If you look back at the 1929 collapse , the puetz cycle did not work
Yet if you look up the mercury retrograde cycle back then
You may discover something .
Sticking with the big picture and holding to my bearish bias
Into January . Mid Oct though ( Oct 12 ) might end up as a low of
Some sort .
I’m loosing track of all the sub cycles being out here in the ocean
Not to mention lack of decent data , indicators etc….
The mini crash window opened and the market turned down
No way I’m going to fight my own research .
I have posted this time period all year .
I just stick to my work .
We had an inside day in the cash indices today while ES notched a lower low.
I think we are going to see strong support at 2800 so I am now strongly leaning toward a final wave up later this week and possibly an unusual back to back instance of a full moon witnessing a turn at the high rather than at a low. I know this is contrary to what most folk are expecting but price trumps all. In my book this will be confirmed if we see VIX put in a new high with a strong bearish reversal candle this week. From an EW perspective, I think it would be completion of a fourth wave followed by a final fifth wave to new ATH before we get a deeper corrective fourth wave of larger degree. Looking for a new low and reversal around 2800 tomorrow.
This week is an option expiry week .
Those who sell put options consitantly on the stock index’s
May get nervous and add more fuel to this bearish cycle .
I’m speculating obviously yet option expiries can get crazy at times .
Verne
Look at Peters chart above and make a note of his fib retrace levels
On that chart. 2802 might end up as critical
Peter G,
We have a confirmed Hindenburg Omen per Robert McHugh on the NYSE. Do you know if we got HO on the Nasdaq? On the Nasdaq we had 103 new highs vs 96 new lows yesterday per the WSJ.
I am not sure if the McClellan Oscillator was negative yesterday. My software package does include that indicator. My recollection is that you had mentioned on this site in the past that having the HO happen in both the NYSE and NASDAQ should get your attention.
Yes, on the Nasdaq question, Ed, and yes the McClellan Oscillator was negative at yesterday’s close (Ratio Adjusted -11.8). My prior post was back in June 2017 and it referenced findings by Jason Goepfert (sentimenttrader.com) whose research showed there was added significance when both NY and Nasdaq showed Hindenburgs on the same day. Indeed, that happened yesterday…
“The Nasdaq Triggers Another Breadth Warning’ – Jesse Felder | August 15, 2018
https://thefelderreport.com/2018/08/15/the-nasdaq-triggers-another-breadth-warning/
The track record of HOs has of late been spotty at best. We had a plethora of them last year and the windows all expired with not a single significant decline so I now pay less attention to them and focus on price. In an era of CB support of markets, this is not at all surprising.
I agree with other who have pointed out the 2792 – 2802 area as significant. In line with that thought, I have reduced my shorts by 25% right here. Given the global picture (in terms of where the counts are in Europe and China), I am still leaning towards a break of 2790 in the next 8-10 days. But not taking some money off on the short side has been painful.
So today is a turn date, I sold my puts on the AEX and bought some calls, it’s tricky with mercury retograde.
But if we go higher now, I will buy back puts bigtime on Aug 21.
As expected, the 2800 pivot appears to be holding. I took profits on my short trades and 90% of my long vol positions this morning. They were spectacualar trades and I am glad I ignored the bankster feint yesterday that no doubt shook out a lot of weak hands on the short side. I heard a few gullible individuals talking about a big reversal with great A/D numbers…blah!blah!blah! Rank amateurs! 🙂
Once again the failure to decisively take out 2800 on a strong impulse down tells me we are going higher. I am looking for a slightly lower high in VIX with a confirmed reversal tomorrow.
Of course, the banksters know everyone is watching this pivot. I would not put in past them to ambush a few eager beavers with another vicious spike down before the turn. I think we get a high next full moon.
Looking like the late JULY high on spx is now resistance .
A failure to break above that swing high is key going forward.
Staying bearish yet respecting the bounce today from spx 2803
Under normal conditions I’d take the late JULY swing high date
And count time from that bar as well as the next bar and count
Forward to the next higher swing high on Aug 7 . Then count that
Same time forward to look for a low . Since I don’t have decent data
I’ll be rough and use calendar days . July 27 to Aug 7 was 11 calendar days .
Adding 11 calendar days to Aug 7 is Aug 18 which is Saturday .
That would be considered a top to top to bottom count.
option expiry in the mix I may be making a mistake staying bearish
Yet I’m sticking to my bearish stance .
Aug 19 mercury goes direct .
Thinking out loud so to speak. Mental stop on a break above the late JULY swing high
Need to configure the .554 and .618 retrace levels . Consider the potential fear with
Naked put option shorts .
On Option expiry weeks Thursday and Fridays market actions tend to be oposites
Hence and up Thursday implies a down Friday or vice versa .
Risky but going to hold to my bearish stance
If this market breaks to the downside volatility is going to absolutely explode I sold all my puts but held onto a few of my UVXY calls…just in case. I have August 24 expiration so no need to rush to book profits…
I have to ask myself just how much research do these people actually do ?
I do not agree with this article yet I’d say you should read it just so you realize
There is a ton of bs suedo bull market half speak that needs to be unwound
https://www.marketwatch.com/story/dows-200-point-tumble-puts-it-at-risk-of-the-longest-stint-in-correction-territory-in-nearly-60-years-2018-08-15?siteid=yhoof2&yptr=yahoo
Fractured markets are almost always a sign of trouble ahead.
As of this evening we have stark divergences in the futures and cash markets of the DOW and S&P 500. Both markets in the DOW have now taken out their August 2nd lows but not so for S&P. We saw this same divergence as regards the Feb lows and here it is once more. Of course those lows have remained intact for many months now so the question is will DJI follow, or lead?
Verne
I track the cash Dow much more than the spx .
My thoughts are most everyone watches the Dow around the world .
People who don’t even follow the market will say ” the Dow did this or that ”
I tend to think it leads more than lags . It my opinion though so take it that.
Your point is well taken , if this decline continues and the cash Dow does break
Below it’s Feb or April May lows I’m not so sure at the point the spx will .
My bias has and continues to be that we are in a larger wave 4 . It’s pattern
I’m not convinced on at this point .
Example Dow failed to poke above 25,800 it’s Feb high yet the spx did poke above
Both it’s Feb and March high .
In the Dow that failure tells me it can’t be a triangle ( a large triangle )
The spx though by failing to make a new all time high can be considered a large
Triangle formation with only waves A and B in place . This places us in a C wave
On both of these index’s .
Like I said though I’m not convinced at this point yet it’s what I’m thinking .
The April May low on the spx ( if my memory us correct ) should be broken
Yet the Feb low would hold .
The Dow is a different story .
A flat or a triangle , to me it’s still a 4 th wave but has more swings left in it
to complete .
Further thought
Keep in mind I’m not looking at a chart
The rally up from the April May low on both the Dow
And the spx.
It’s going to show 3 waves in it . Finding that B wave is a target .
I forget if there us a June low . Anyways none of this changes my mind .
At some point the wave count and the overall pattern will show itself
To me we have been in wave 4 since January
Peter T
Thanks for the great weekly post as usual, thought provoking as always.
Have not commented for a few months as i expected some chop and to say that occurred is a mild understatement.
Have to say for me tomorrow (16th August) is a big day as i think we could really see some heavy selling which could last for a number of days(1-6 days)
This i think fits with Peters ES “C” wave down into August.
I think if it occurs it only just pokes its feet blow the Feb lows but a new low for the year never the less IMO.
The DJI is what i would watch closely because should the S&P behave as peter is illustrating i would have to think the down Challenges the 22k level, there is some serious support there so that would be the prefect spring board for a big move up for all markets.
All just my humble opinion.
P.S as i write this the dow futures are up over 100 points already!!
Good luck to all and thanks again Peter T
You’re welcome, mdss. Thanks for the input after so long … lol.
Apologies i meant to say Peter T’s wave “4” down not “C” wave down
I hope that makes sense.
I think Peter T is expecting a “B” wave high to complete a third wave according to this week’s post, unless I mistead it.
Correction. Peter T actually said we need to complete a third OR b wave, which makes more sense of course. My mistake.
This is another sign of the topping process .
This building is still in the permitting stage and won’t
Be the world’s tallest but it would be the tallest in ausralia .
https://amp.theguardian.com/cities/2018/aug/15/plans-for-australias-tallest-building-unveiled-but-developer-faces-planning-battle
It will probably never be completed. 🙂
This mornings gap up will be painful to say the least
Yet ….. It’s a hedge for me.
Looking like the market opens near the bottom of the gap .
If the market fails to break down after Sept 9 I’ll toss my hands up
And accept defeat .
This ramp is as phony as a three dollar bill. You are looking at a classic bear market rally based on nothing but hopium.
I will be looking at VIX to trigger a short of this cash dump. Glad I took profits yesterday.
Good call by John and Verne on the date and level for ES turn/support. Around 2840-2845 on ES is still a sale over the next couple of days in expectation of a decline into end of the month – basically 1 is done and selling the top of 2 for a move lower in wave 3. John has a more precise date around 21st. He has been on the money – so let’s see if this one plays out. I do not understand turn dates well – so I will stick to Elliot rules and sell ES in my target zone to go back to my full short position.
You’ve got nerves of steel Vivek. No matter how convinced I was of the main trend, I doubt I could withstand a 400 point counter-trend ramp as we are seeing today…and I don’t easily get rattled. I suspect we could be seeing a bit of a short squeeze.
Volume and VIX strongly hinting we are looking at a dead cat bounce. I expect the next move down to obliterate 2800. The full moon may yet have the last laugh! 🙂
While I am not quite ready to short the indices, I am more than ready to start scaling back into long vol positions. I still have some UVXY calls expiring next Friday and today I start loading up on VIX 12 strikes calls with September expiration. I think the next significant event will be in the volatility sphere. Yesterday’s decline did not even come close to resolving the steep positive divergences seen at recent lows. I think anybody chasing this relief rally is gonna get body slammed.
Ok Verne – I bought some VIX calls as well. Have not tried it before. Lets see how it goes.
It may take a day or two but I think we see a gap higher eventually. I also sold calls today after yesterday’s shadow in anticipation of this relief rally. I suspect the coming full moon will exhert some influence. We shall see…!
Short king Dollar via bear call spreads. Hopefully not too early! 🙂
Lol! I am not the only one! VIX ALREADY on the move.
This is going to be REAL interesting…!
So the turn came on the 15th, do not know how high we will go, but I will go full short on Aug 20/21. till……… the full moon howllllll or Aug 29.
Like taking candy from a baby..buying EVERY dip. Bears have zero follow through. Hit a double on my calls today exit at 2850. Waiting on 2875-80 on spx or break below peters 2790. I’ll buy all dips in between.
Yep. Scalping both the dips and rips is the way to go.
Cash Dow and spx came back to their late JULY highs .
This being my mental stop. Stupid me to hold
If the typical option expiry holds true then today’s up
Implies tomorrow down . Very nice 1000 point move in the Dow
Since yesterday .
Not liking this .
.a poke above 25,800 is possible yet holding my bearish bias
Through the weekend
Charles
Nice trade
It is starting to look like we are in some sort of triangle with a possible D wave completion yesterday. If this is correct it raises some interesting scenarios. Triangle E wave reversals tend to be sharp and present one of the most explosive trading oportunities. They are also commpn in fourth wave positions, heralding the imminent end of a trend. The huge question is how high the thrust will go, and how long will it last? It could conceivably end in a day or two. The difference is of course whether we see a high or low around the 26. A protracted move out of the triangle argues for a high. A brief move means we could see a waterfall decline next week to co-incide with a 26 low. Either way, we have some great trade set-ups just ahead. Hope everyone has a great weekend.
If you joined Vivek and me on the VIX trade, a long (upper) wick today could signal a swift conclusion to the next zig zag down for a possible E wave and conclusion to the triangle. If we see a full, fat green candle there is going to be hell to pay come Monday morning! 🙂
Happy Trading!
I did a series of UVXY Oct calls. Hoping the next major leg down begins before then
:). But still buying shorter term SPX calls on dips… Until 2790 broken.
While US Indices have held close to the highs, rest of the world is in a lot more pain. Most of Asia and parts of Europe are already trading down significantly – Those markets had the reaction from Solar and lunar eclipses close to each other starting from the last full moon. Japan is at a critical juncture and can break sharply lower in the coming weeks. Interesting fact : September full moon and Federal reserve meeting are right next to each other. I would expect an important turn 3rd week of September.
Puts on Musk sold to close. https://worldcyclesinstitute.com/the-predictability-of-stephen-puetz/#comment-31701
D wave of possible triangle moving a bit higher. Will actually give a better look to B-D trendline…
Yes I’m expecting new highs for SPX @ 2875-80. Looking good so far!
Only about 22 points away. Yee haw. Giddy up..the bulls is off and running!
Thank you Mr Market, another dip…another double on SPY calls. In at 0.55 on dip and sold at 1.10 on recovery. Wash rinse repeat!
You’re on a roll!
Adding to my long vol, lol!
Bulls make money, bears make money. Pigs get slaughtered !!
So true.. why I like scalping. Take the easy double and move on. Could’ve made a triple today but stuck to my rules.
Nicely done Charles! Spoken like a true trader!
Indeed! B-D trend-line looks absolutely perfect. We should get a brief move down for E on Monday than off to the races next week for what will very likely be a full moon high. Have a great week-end all.
See ya in the trenches! 🙂
Charles, which strike price and expiration date did you set for this trade? Definitely a question from a nube.
Thanks
Jeff T
A new weekend post is live at: https://worldcyclesinstitute.com/september-should-be-interesting/
This website is for educational purposes relating to Elliott Wave, natural cycles, and the Quantum Revolution (Great Awakening). I welcome questions or comments about any of these subjects. Due to a heavy schedule, I may not have the time to answer questions that relate to my area of expertise.
I reserve the right to remove any comment that is deemed negative, is unhelpful, or off-topic. Such comments may be removed.
Want to comment? You need to be logged in to comment. You can register here.