
 My poor shoe that I’m expecting to drop (based on last week’s post here) is getting a little worn. But I’m still holding onto it! Yes, I’m one of those guys that likes to wander around the house in comfortable old clothes that sometimes have holes in them!
This week, we got what looked like the first wave of the C wave of a flat to the downside in ES. It was a fake-out move, because it proved to be a double zigzag that looked like 5 waves, but was not.
There were also clues in NQ and the SP500, that we weren’t quite there yet. Plus, a regular flat needs to retrace at least 90% of the A wave.
So, I’m still looking for a regular flat in ES/SP500 and an expanded flat in NQ/NDX. Note that NQ is at a new high, which registers as a possible expanded flat set-up.
Regular and Expanded Flats
The pattern tracing out in ES and the SP500 seems to me to be a regular flat. Here’s an description of the traits of a flat (from the Elliott Wave Principle):
“A flat correction usually retraces less of the proceeding impulse waves than does a zigzag. It tends to occur when the larger trend is strong, so it virtually always precedes or follows an extension. The more powerful the underlying trend, the briefer the flat tends to be. Within an impulse, the fourth way frequently sports of flat while the second wave rarely does.”
Regular Flat (below)
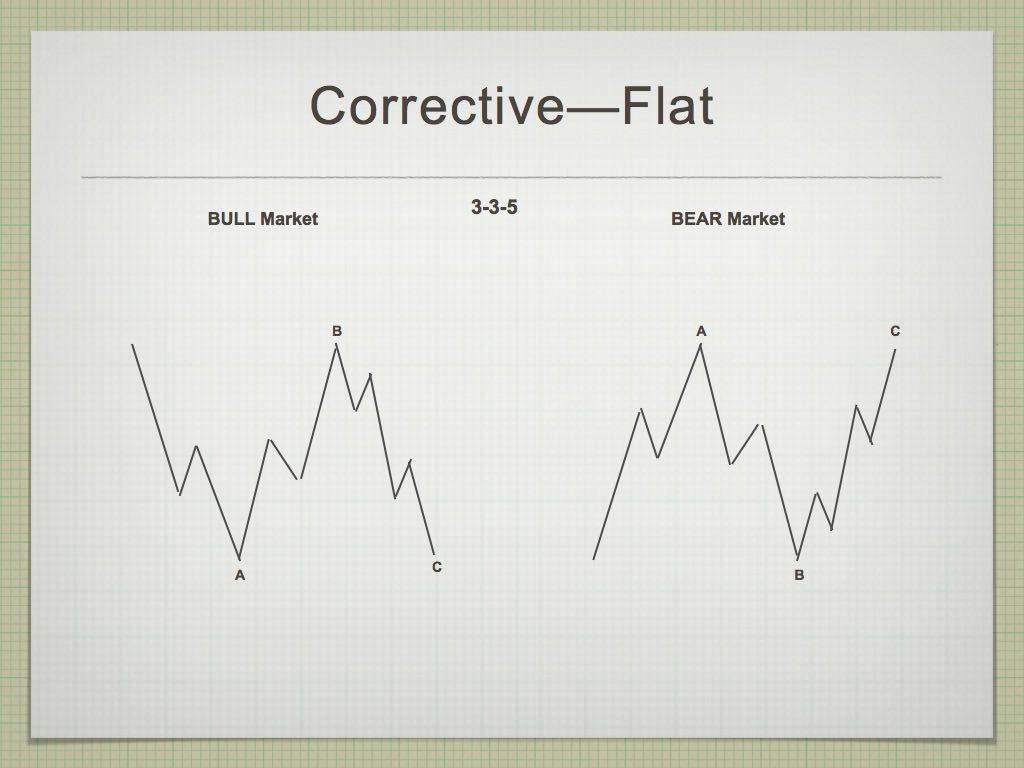 Above is a chart showing a very simple drawing of a regular flat. Think about the large fourth wave in ES that we’ve been tracing out since January 29. The BULL Market wave on the left in this diagram relates to the probable pattern we have unfolding.
The first set of waves down from the 2875 area was in three waves (a zigzag). This is the A wave of the flat.
The wave up from about 2530 is also in three waves. This is the B wave of the flat, and it’s not quite complete. My target now on the upside should be above 2838 in ES and a similar number in the SP500. A turn down into Wave C that traces out five waves will complete the pattern (3-3-5).
Expanded Flat (below)
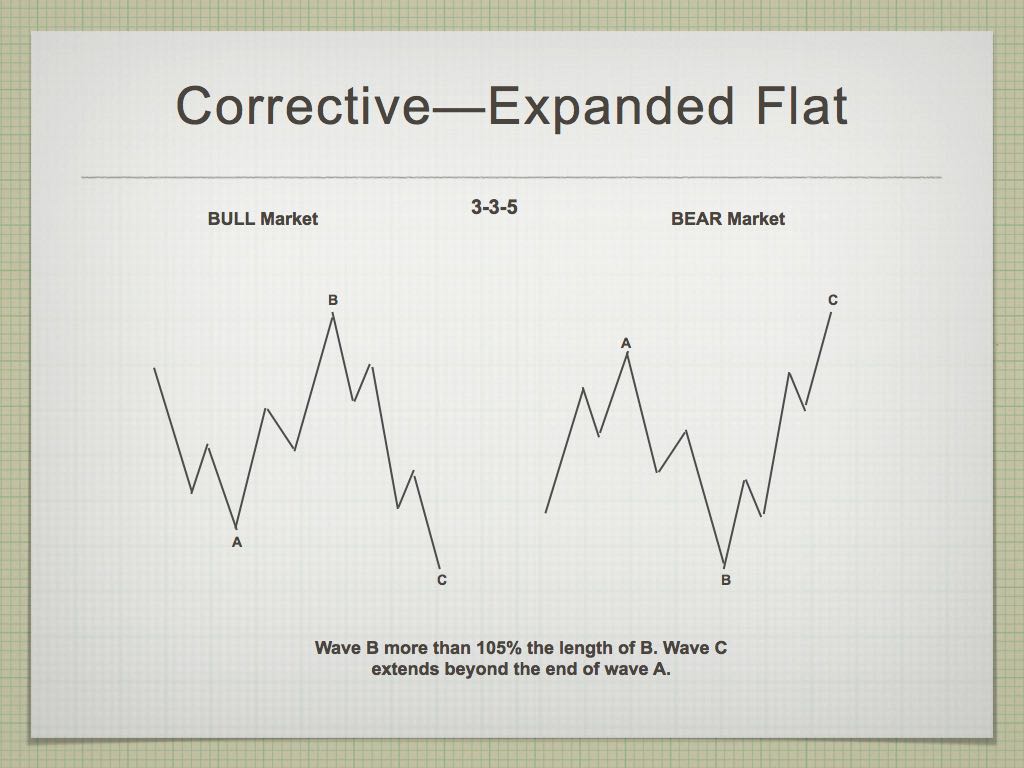 The only difference between a regular flat and an expanded flat is that in expanded flat, the B wave goes to a new high (the pertinent diagram is the one on the left, for a bull market)
Summary: We seem to have a regular flat in progress in ES and an expanded flat setting up in NQ. Look for a rally into perhaps Monday or Tuesday and then a sudden turn down into the C wave. The C wave in both flat patterns will drop to a new fourth wave low.
Registration for Commenting
Want to comment? You need to be logged in to comment. You can register here.
If you register, it protects your information. It also allows you to comment without filling in your information each time. Once you’re registered, simply go to the home page and click on the login link top right in order to log yourself in. Usually, you’ll be logged in for several days before needing to be logged in again.
______________________________
Problem receiving blog comment emails? Try whitelisting the address. More info.
______________________________
Tops in your field DZ 2
Tops in your field …You are tops in your field. Tried to follow Elliot Wave international for years. They were always behind the market. After discovering you, I perceive that you are an expert in reading the waves, which puts you way ahead of the rest of your peers. And you can read the Waves like you are reading tomorrow’s financial section. I pray you stay healthy. —DZ |
Couldn’t be happier … KK 2
Couldn’t be happier …The analysis and insight you provide is simply amazing! I’ve been trading the futures and equity markets for well over thirty years and usually average around 5% monthly. Since joining your Traders Gold Service two months ago, that number has better than doubled. I couldn’t be happier.—KK |
A true expert in Elliott Wave FL 2
A true expert in Elliott Wave …You are a true expert in EW analysis. What you provide is not available anywhere and is priceless. Subscription on your services is the best thing I have ever done. Many thanks for your effort to make me a better investor. I now have more trust in my investment decisions. I hope you will continue the excellent work! —FL |
Rise above the rest … SM 2
Rise above the rest …I have only ever met a few people who, in their chosen fields (astrology, medicine, music, martial arts, technical analysis), rise above all the rest and you are one of them…you have ‘the gift’…and that’s why I’m a Trader’s Gold member. —SM |
the real deal SM 2
The real deal …‘Educational, insightful and thorough market analysis for all levels of traders. It’s Elliott Wave at its best….Peter Temple is the real deal’ —SM |
The best of them JL 2
The best of them …Last couple of years, I subscribed to several ‘market traders’. You are by far the best of them and the personal contact is awesome. Daily and daily updates are very well written! Besides your expertise in EW, I also like your cycles analysis. Best investment I ever made! —JL |
Get an upper hand … JC 2
Get an upper hand in trading …Seeing all the different currency pairs and the wave structures and hearing you explain why this has to do that on a nightly bases gives one a upper hand when trading. Elliott Wave applies to all stock and indices and can be applied to any candlestick chart. If someone ask what you want for Christmas – Tell them a membership to Peter’s “Traders Gold!”—JC |
Have not had a losing week RW 2
Have not had a losing week …I have been with Peter almost a year. The only thing that matters is have I made money with his service. I think I have finally turned the corner using Peter’s EW. I have not had a losing week in the last 5 months. Thanks Peter, for your amazing amount of hard work. —RW |
The Market This Week
Here's the latest daily chart of ES (emini futures)
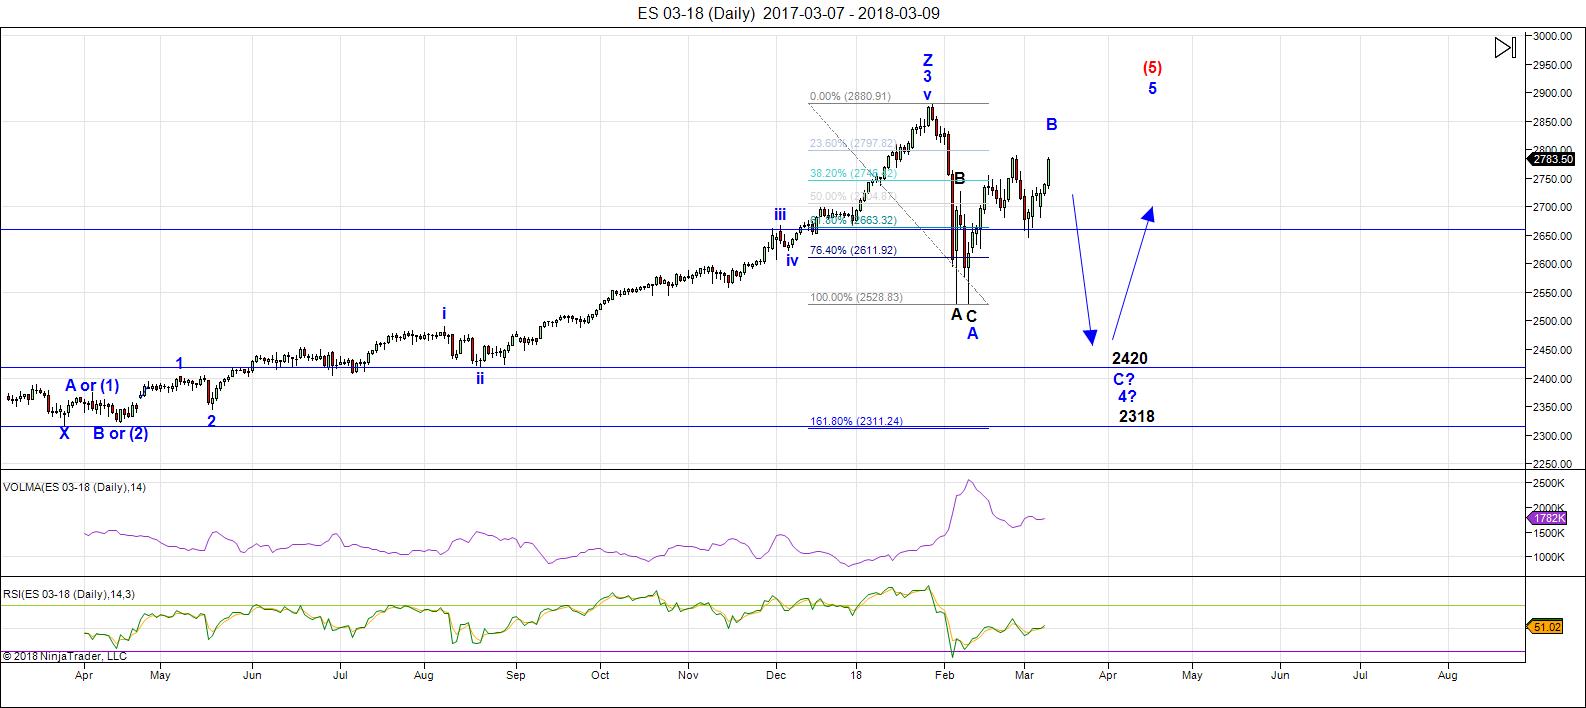
Above is the daily chart of ES (click to enlarge, as with any of my charts).
Things were moving very slowly all week long as we built what appeared to be a second wave of the C wave of a flat. However, on Friday, the count changed: The apparent five waver down (the first wave of the C wave of the flat) turned out to be in three waves — a fake-out.
There's another lesson here in that a flat has to retrace 90% of the A wave down (in this instance). It has only retraced to slightly under 80%.
So now, we're headed higher to meet the 90% retrace requirement. For ES and the SP500, that means the turn should happen above 2838 (but ES should not go to a new high). The flat is still the best option for both ES and NQ.
Expect a turn down this coming week into the C wave to a new low. I'll go with a rough target of 2420 on the downside, although the C wave down can end anywhere after at least tracing out a wave similar in length to that of the first ABC wave down. It needs to reach a new wave 4 low.
___________________________
Trader's Gold Subscribers get a comprehensive view of the market, including hourly (and even smaller timeframes, when appropriate) on a daily basis. They also receive updates through the comments area. I provide only the daily timeframe for the free blog, as a "snapshot" of where the market currently trades and the next move on a weekly basis.
______________________________________
Sign up for: The Chart Show
Next Date: Wednesday, March 21 at 5:00 pm EST (US market time)

The Chart Show is a one hour webinar in which Peter Temple provides the Elliott Wave analysis in real time for the US market, gold, silver, oil, major USD currency pairs, and more. You won't find a more accurate or comprehensive market prediction anywhere for this price.
Get caught up on the market from an Elliott Wave perspective. You’ll also get Andy Pancholi cycle turn dates for the SP500 for the balance of the current month. There’ll be a Q&A session during and at the end of the webinar and the possibility (depending on time) of taking requests.
All registrants will receive the video playback of the webinar, so even if you miss it, you’ll be sent the full video replay within about an hour of its conclusion. For more information and to sign up, click here.


Peter T,
Great analysis if I do say so myself! Throw in a “pinch” of Joe Longwill’s analysis and perhaps we get a Wave C 2x Wave A. Appreciate your dedication!
This post is for educational purposes only .
Trading using planets is an art and based on observations
Venus and mercury and moving closer together and after
They conjunct mercury will go retrograde .
Venus is going to become an evening star and move further
And further away from the sun .
The link to what I borrowed below for further reading
Should you follow .
http://m.nakedeyeplanets.com/venus.htm#2018mar
On March 12th Venus makes a brief exit from the zodiac, entering the constellation of Cetus, the Whale at 14 hours UT, cutting diagonally across its North-western corner. The planet reaches 15° East of the Sun on the same day.
Venus re-enters Pisces at 16 hours UT on March 14th, after some 50 hours in the company of the Whale. Mercury, now magnitude -0.5, is positioned nearly 4° North-east of planet at this time. The two planets attain a maximum separation of 4°.1 on March 15th, the same day on which Mercury reaches its greatest elongation from the Sun (18° East). Mercury’s apparent motion is now slowing as it approaches its Eastern stationary point, allowing Venus to catch up with it over the next few days. At 01 hours UT on March 18th the pair again meet in conjunction, Venus swiftly passing 3°.9 to the South of Mercury in central Southern Pisces. Being only two weeks since the pair last lined up, this conjunction is also only visible at latitudes North of Southern Tropics. At about 2115 UT that same day, Mercury, Venus and the crescent Moon line up, visible low down in twilight from the central Northern Atlantic Ocean. Mercury reaches its Eastern stationary point, 5° to the North-west of Venus, on March 23rd. Mercury’s elongation rapidly reduces over the next few days and the planet becomes lost from view in the dusk twilight by month’s end.
On March 23rd Venus passes 0.°6 South of the double star Revati (Greek lower-case letter ‘zeta’ Psc or Zeta Piscium,, mag. +5.2)
Same link as above and another twist to this 9 year rally
Now in the ‘tail’ region of the Fishes, Venus passes just 4′.5 (0°.075) South of Uranus (mag. +5.9) shortly after midnight UT on March 29th in a difficult-to-view planetary conjunction which is only visible between latitudes 38° North and 10° South. As they pass each other in the sky, Venus lies at a distance from Earth which is only one-twelfth of that to Uranus and its apparent motion is 22 times faster than that of the gas giant. Uranus is now at the end of its 2017-18 apparition and will move into Aries in late April, having spent some nine years in Pisces.
Coincidentally I’ll add this from Raymond merrimans latest post
https://mmacycles.com/index.php?route=blog/article&category_id=1&article_id=189
The final Jupiter transit in the March 1-13 time band ends on Tuesday, with the Sun making a waxing trine to Jupiter. As discussed in Thursday’s meeting with subscribers, this is one of 22 planetary signatures that have a 75% or greater historical correlation to 4% or greater reversals in stock prices within four trading days, as published in The Ultimate Book on Stock Market Timing Volume 3: Geocosmic Correlations to Trading Cycles. Usually, it is a high. From the low of Friday, March 2, at 24,217, the DJIA has already achieved the 4% rally level within four trading days (4% would be a move up to 25,185, and it closed up 435 points on Friday, to 25,335). Let’s see if it tops out within four trading days afterwards, which is in effect into next Friday, March 17.
As if to underline the volatility of stock indices right now, two more of these 22 geocosmic volatility signatures will be present before this end of this month. On March 23, Venus will form its waxing square to Pluto, followed by the Venus/Uranus conjunction of March 28. If you have been hoping for some steadiness in the stock market or the national political scene, March is not likely to be the month that will accommodate that wish. But if you like volatility and conflict, as does Mr. Trump, March is the month for you, especially since transiting Uranus continues to plow through the last degrees of Aries, conjunct the NYSE Saturn, while at the same time in opposition to the NYSE Jupiter/Neptune conjunction (23-27 Aries-Libra). This volatility may recede after mid-April when the last new moon in Aries will occur near Uranus in Aries, before the 84-year Uranus cycle moves into Taurus on May 15. That will open a new chapter in this “Great Reset” era that we have the honor of experiencing.
MS,
I do not know if this decline will lead to a crash, but the tidle waves are working well in emotional markets like now. so this wave cycle is in play from March 10 till March 18 (Monday 19).
Thanks John for replying.
To be honest if you consider the 2015 initial decline was circa 4.6% then a retrace as we have seen now and then a total decline that was around 14% that fts with Joe’s great analysis which he highlighted in the last post in that the second decline is 2.2 to 3.2 times wave A(first wave down)
If this is the case the first decline is roughly 11% this would mean the second decline will be between 22 – 33%
This is something no one is seeing at all IMO it also seems highly unlikely given current events but then as you said the 87 crash started after 28 trading days(retrace point after initial decline). The markets in 87 then dropped for 12 trading days to the lows.
Also consider 1929 it was widely similar in that around 28-29 days it retraced after the first decline then in some 22 trading days it bottomed and crashed hard.
So whilst this is indeed a very big ask its surely something to note and be aware of.
Thanks again John and Joe lots of food for thought
Hi Peter and m s
look at http://www.prognoseus500.nl/ for the dates.
m s it can be wright. I don’t use Elliot or other logic with lines. 🙂
I am learning from this site.
So I can confirm Peter and m s. But it must start today
Hi Willem nice to hear from you
I highlighted in my post about joes good analysis re: lengths of waves i.e 2.2 oe3.2 x length of A
Are you stating that by the 2nd of April we could be at circa 20.5k on the dow as thats what 2.2 times A on the dow would be?
I look forward to hearing from you
take care
Hi m s,
I have taken the drawing from the website. The decline of yesterday was too small. We descend to the 14th and then we turn up to the 15th. (16th?)
The 19th starts low and in the course of the day we get another big increase. It seems like that. I will update it tonight.
Around 2 April, the CHINA indicator predicts a Lowest LOW. Reliability 90%
How deep I cannot tell and keep +/- 2 tradings day
https://worldcyclesinstitute.com/options-at-the-top-2/comment-page-1/#comment-28215
should have stuck with my original expectation for March 9-12…currently expecting a low March 26-29…
Norm Winski | March 13, 2018
March 29 AC (after close)
https://www.youtube.com/watch?v=frMJ3P8ppGk&feature=youtu.be
Thanks for sharing Rotrot.
Hi Rotrot,
What do you mean with:
March 29 AC (after close)?
A little confused…… ” For ES and the SP500, that means the turn should happen above 2838 (but ES should not go to a new high). The flat is still the best option for both ES and NQ.
Expect a turn down this coming week into the C wave to a new low. I’ll go with a rough target of 2420 on the downside”
So does that mean we 1st go above 2838 and THEN we go BELOW 2420 ALL in one week ??? OR are you saying that we go to 2838 AND THEN we go lower with a target – whenever that may be of a lower low – i.e. to around 2420 ?
As i speak we are in the high 2700s (as high as 2800) …
A regular flat should retrace 90% of the A wave down … that’s the 2838 level in SPX. Whether it makes it, I don’t know, but I’ve been leaving comments all morning regarding what ES appears to be doing.
It looks at though (as per my most recent comment) that we’re back to the bottom of wave 4 and looking for wave 5 up to the target. I don’t know about the timing. But as per my diagrams of the flat, if that’s indeed what we have here, once we hit the upside target, we’ll get a wave down to a new low.
Thanks for clarifying – btw looking forward to part 2 of the crash video, realise you must be busy.
Just i know things are volatile but didnt think they were gonna be THAT volatile!
This is the largest flat I’ve even seen, and they’re volatile to begin with. Yes, this market is taking far too much of my time right now. It’s just a bit crazy and tough to stay on top of.
willem buddy, be aware that it took 10-12 trading days to form the feb low and should the decline have started yesterday that would mean a low the week of the 26th which rotrot had indeed highlighted
If this selling is really aggressive i would have to say your 2nd April may indeed be a slightly higher low but for now who knows one thing is for sure i dont want to cling on to thinking we decline for more than 10-12 days as 1987 and 1929 declined from the retrace point for 12-13days.
Thanks willem for the update
So far, the tides are working well, if everything keeps on track we will have a panic on Thursday/Friday.
John your tides are indeed working well!
The only thing to be aware is what i said regarding the 10-12 days declines, how will that work with the your tidal works? Can they invert etc or is that not possible
Thanks in advance for clarity
Of course it can invert so my excit short will be March 15/16 when we fall deep.
Thanks for the clarity John!
I will wait and see what transpires into next week we either sit around the low from febuary or this market rips the bulls face off and trades very low to sub 22k on the dow, regardless i think the 10-12 trading days must be respected .
Thanks again for replying
https://www.zerohedge.com/news/2018-03-13/massive-x-class-solar-storm-slam-earth-tomorrow-could-knockout-satellites-power
S&P500: following my indicators we have made the LOW this morning. O.K. we can check the Low again, but I don’t think so. But next week we go sky high till now the 22th makes a HIGH. Use this only for confirmation. I can be wrong! (a day:-))
(in a hurry tomorrow more)
Joe Longwill,
Not sure if you have gotten your feet back on the ground yet! However, you have said in one of your post from last that March 17th was a focus but April 4th was more important and an ideal swing low. Is that still your thinking? Does that presence of numerous bearish cycles now that we are at your March 17th date suggest that after the month of March you do not want to see any new highs?
Hope you have the time and inclination to treat us to a weekend post!
So far so good. Next week- Monday opening perhaps a little lower and then we go sky high! That is not me, but my indicators are predicting this. 21 or 23 the high or maybe the weekend. http://www.prognoseus500.nl/. Be carefull and use this as confirmation for youre analises.
A new weekend post is live at: https://worldcyclesinstitute.com/unexpected-turbulence-dead-ahead/
This website is for educational purposes relating to Elliott Wave, natural cycles, and the Quantum Revolution (Great Awakening). I welcome questions or comments about any of these subjects. Due to a heavy schedule, I may not have the time to answer questions that relate to my area of expertise.
I reserve the right to remove any comment that is deemed negative, is unhelpful, or off-topic. Such comments may be removed.
Want to comment? You need to be logged in to comment. You can register here.