
 The Eve of Destruction — 1965
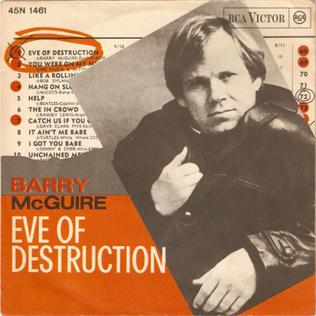
Barry McGuire sang “The Eve of Destruction” from hand written notes (in a single “take”) in a recording studio rehearsal in 1965. It was not supposed to be the final soundtrack for that song. It was written by P.F. Sloan, who wrote hit songs for Johnny Rivers (“Secret Agent Man”) and Herman’s Hermits (“A Must to Avoid”) among others. This was one of my favourites in the ’60s.
Well, the record got leaked (something that’s a little more common today) and Barry got a 7am call the next Monday morning from a radio station urging him to listen in. That same week, that single went to number 1 on the Billboard Top 100 chart. It knocked the Beatles’ “Help” from its long-held spot at the top of the charts.
Yeah, my blood’s so mad, feels like coagulatin’,
I’m sittin’ here, just contemplatin’,
I can’t twist the truth, it knows no regulation,
Handful of Senators don’t pass legislation,
And marches alone can’t bring integration,
When human respect is disintegratin’,
This whole crazy world is just too frustratin’,
And you tell me over and over and over again my friend,
Ah, you don’t believe we’re on the eve of destruction.
1965 was nearing the top of the third wave in the US indices. The top of that wave also coincided with a solar maximum, which helped to bring about the original Woodstock, which I was at (I still have my tickets, as there was nobody there to take them — the gates were wide open and it ended up being a free, three-day concert. Originally, the tickets cost $6.00 per day).
Alexander Chizhevsky wrote about the tops of solar maximums causing the “excitability factor” in humans. Solar maximums always elevates the human psyche. We saw the destruction of the World Trade Center on spoke in a subsequent solar maximum — right at the top, in 2001.
Last year, we saw the top of another third wave (of the final fifth wave). Fifth waves in bull markets mark a much less optimistic society, and since the NYSE and related indices are in a corrective B wave, in this instance, optimism is waning even more than usual; the “herd” is becoming relatively more pessimistic than ever before.
In fact, the feeling amongst the general public should be on the verge of turning decidedly negative. When we reach the top of the fifth wave, more than 50% of the population will be negative, resulting in a dramatic international stock market drop in historic fashion — one that will be talked about for centuries to come.
So, it’s no wonder the song lyrics tend to ring true today. However, we’re turning to a time where the anger will turn inward. In other words, the third wave is an expansionary wave and we saw lots of expansionary wars instigated by the empire of day, the United States. The turning of the fifth wave will result in civil wars around the world.
I would forget the WWIII scenario; history says it won’t happen within the next hundred years at least, as the financial system collapses, and the climate turns colder and dryer. Thoughts will turn to self-preservation.
You can see the times reflected in our music. The top of the third wave was a golden age, with some of the greatest music produced since the 1800s. The music in the 80s and 90s turned downright angry and music today just seems “lost.” Very little of it is memorable.
The huge drop in a C wave that I’m expecting will reflect a very dark time ahead. I always think of stock market as a mathematical representation of the mood of the herd, or population.
We’re about to see a lot of negative events over the next few months as we complete this final C wave of the Fourth Wave from Hell. But then, as the fifth final fifth wave heads back up, we’ll get a glimmer of hope, but it won’t last.
“May you live in interesting times” is a Chinese proverb that in 1966 Robert F, Kennedy used in a speech in 1966, which of course, was near the top of that third wave. He was making the point that it was a time of danger and uncertainty, but one of the most creative times in history. It may not be as much the latter, as the former.
Know the Past. See the Future.
_________________________
The SP500 – The Bigger Picture
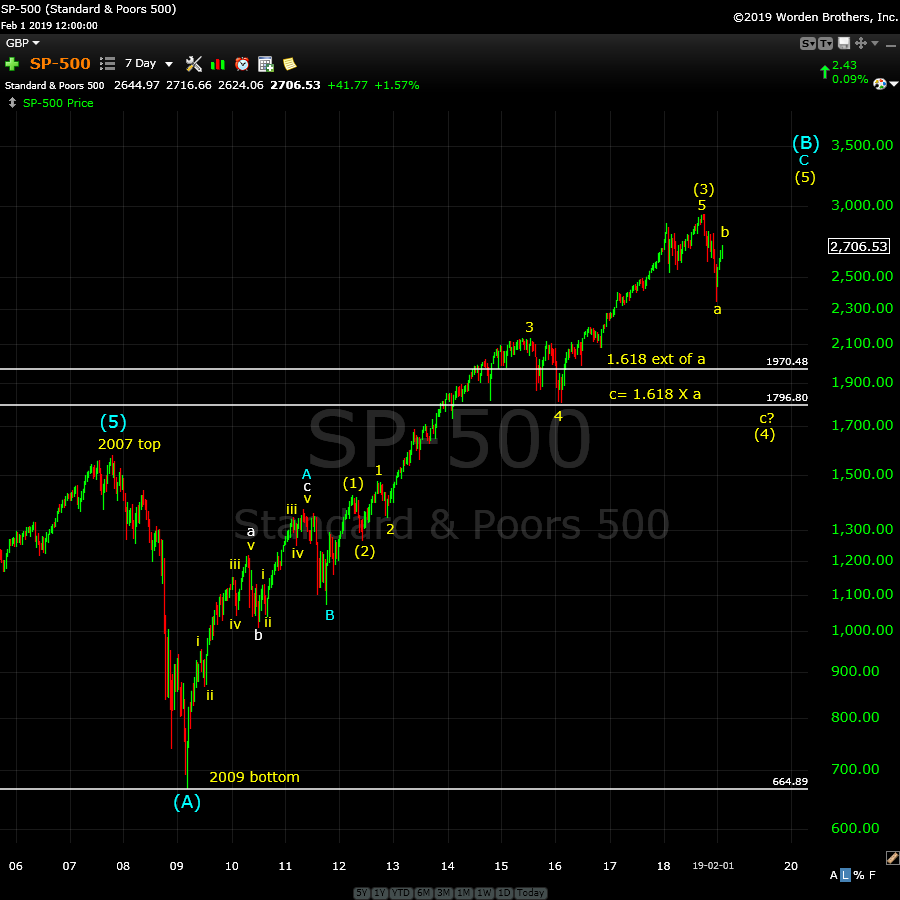
Above is the seven day chart of the SP500. As we’ve reached the top of this extraordinary B wave in the US indices, it’s time to step back and look at the bigger picture and where this wave down is likely to go.
If you know anything about Elliott Wave, you know that final waves ending a trend requires five waves (motive, or as a diagonal) . Now, you might counter with, “but what about truncations.” I’d reply, “Well, just find me one example of a truncation anywhere in the history of any index in any market.” My experience tells me that would be a problem, as I’ve written about here many times before. They don’t exist, unless someone can come up with a valid example (as the ones in “The Elliott Wave Principle” book, are invalid).
You would also know then, that a bull market fourth wave of a fifth wave reverts back to the area of the previous fourth wave (of one lesser degree of trend) and is required to retrace at least 38% of the entire fifth wave up. We haven’t even gotten close to fulfilling that requirement.
In the chart above of the entire corrective wave up from 2009 (a B wave, something that has never been seen before at the top of a market), the 38% retrace level is at ~2093. We need to at least reach that level, imho. The previous fourth wave of one lesser degree sits at 1800 points.
I’ve moved the January 29, 2019 third wave top to the all-time high because it gives both the third wave up and the fourth wave down “the right look,” which is an extremely important aspect of the Elliott Wave Principle. However, this is probably not correct, because the “mother index,” the NYSE very definitely has its third wave top at that January 29 date. On the other hand, there are often non-confirmations of this type at major tops.
In any event, the large fourth wave down now in progress has traced out an ‘a’ wave down, and sprung back to create a three-wave ‘b’ wave to the 62% retrace level from the all time high. You do not get a B wave of this nature without a much stronger C wave in the opposite direction.
Using fibonacci measurements, there are two most probably targets for the C wave down: 1970 (the 1.618 extension of the a wave down) and 1796 (where the C wave is equal to 1.618 X A). This latter target is my preferred resting place.
My timeline target for the bottom of this C wave down is mid to late May. That will most likely move the final top of this 500 year rally into 2020, as we need a final fifth wave up to a minimal new high.
_______________________
Elliott Wave Basics
Here is a page dedicated to a relatively basic description of the Elliott Wave Principle. You’ll also find a link to the book by Bob Prechter and A. J. Frost.
____________________________
Registration for Commenting
Want to comment? You need to be logged in to comment. You can register here.
If you register, it protects your information. It also allows you to comment without filling in your information each time. Once you’re registered, simply go to the home page and click on the login link top right in order to log yourself in. Usually, you’ll be logged in for several days before needing to be logged in again.
______________________________
Problem receiving blog comment emails? Try whitelisting the address. More info.
______________________________
Rise above the rest … SM 2
Rise above the rest …I have only ever met a few people who, in their chosen fields (astrology, medicine, music, martial arts, technical analysis), rise above all the rest and you are one of them…you have ‘the gift’…and that’s why I’m a Trader’s Gold member. —SM |
The best of them JL 2
The best of them …Last couple of years, I subscribed to several ‘market traders’. You are by far the best of them and the personal contact is awesome. Daily and daily updates are very well written! Besides your expertise in EW, I also like your cycles analysis. Best investment I ever made! —JL |
the real deal SM 2
The real deal …‘Educational, insightful and thorough market analysis for all levels of traders. It’s Elliott Wave at its best….Peter Temple is the real deal’ —SM |
Tops in your field DZ 2
Tops in your field …You are tops in your field. Tried to follow Elliot Wave international for years. They were always behind the market. After discovering you, I perceive that you are an expert in reading the waves, which puts you way ahead of the rest of your peers. And you can read the Waves like you are reading tomorrow’s financial section. I pray you stay healthy. —DZ |
A true expert in Elliott Wave FL 2
A true expert in Elliott Wave …You are a true expert in EW analysis. What you provide is not available anywhere and is priceless. Subscription on your services is the best thing I have ever done. Many thanks for your effort to make me a better investor. I now have more trust in my investment decisions. I hope you will continue the excellent work! —FL |
Couldn’t be happier … KK 2
Couldn’t be happier …The analysis and insight you provide is simply amazing! I’ve been trading the futures and equity markets for well over thirty years and usually average around 5% monthly. Since joining your Traders Gold Service two months ago, that number has better than doubled. I couldn’t be happier.—KK |
Get an upper hand … JC 2
Get an upper hand in trading …Seeing all the different currency pairs and the wave structures and hearing you explain why this has to do that on a nightly bases gives one a upper hand when trading. Elliott Wave applies to all stock and indices and can be applied to any candlestick chart. If someone ask what you want for Christmas – Tell them a membership to Peter’s “Traders Gold!”—JC |
Have not had a losing week RW 2
Have not had a losing week …I have been with Peter almost a year. The only thing that matters is have I made money with his service. I think I have finally turned the corner using Peter’s EW. I have not had a losing week in the last 5 months. Thanks Peter, for your amazing amount of hard work. —RW |
US Market Snapshot (based on end-of-week wave structure)
Here's the latest daily chart of ES (emini futures)
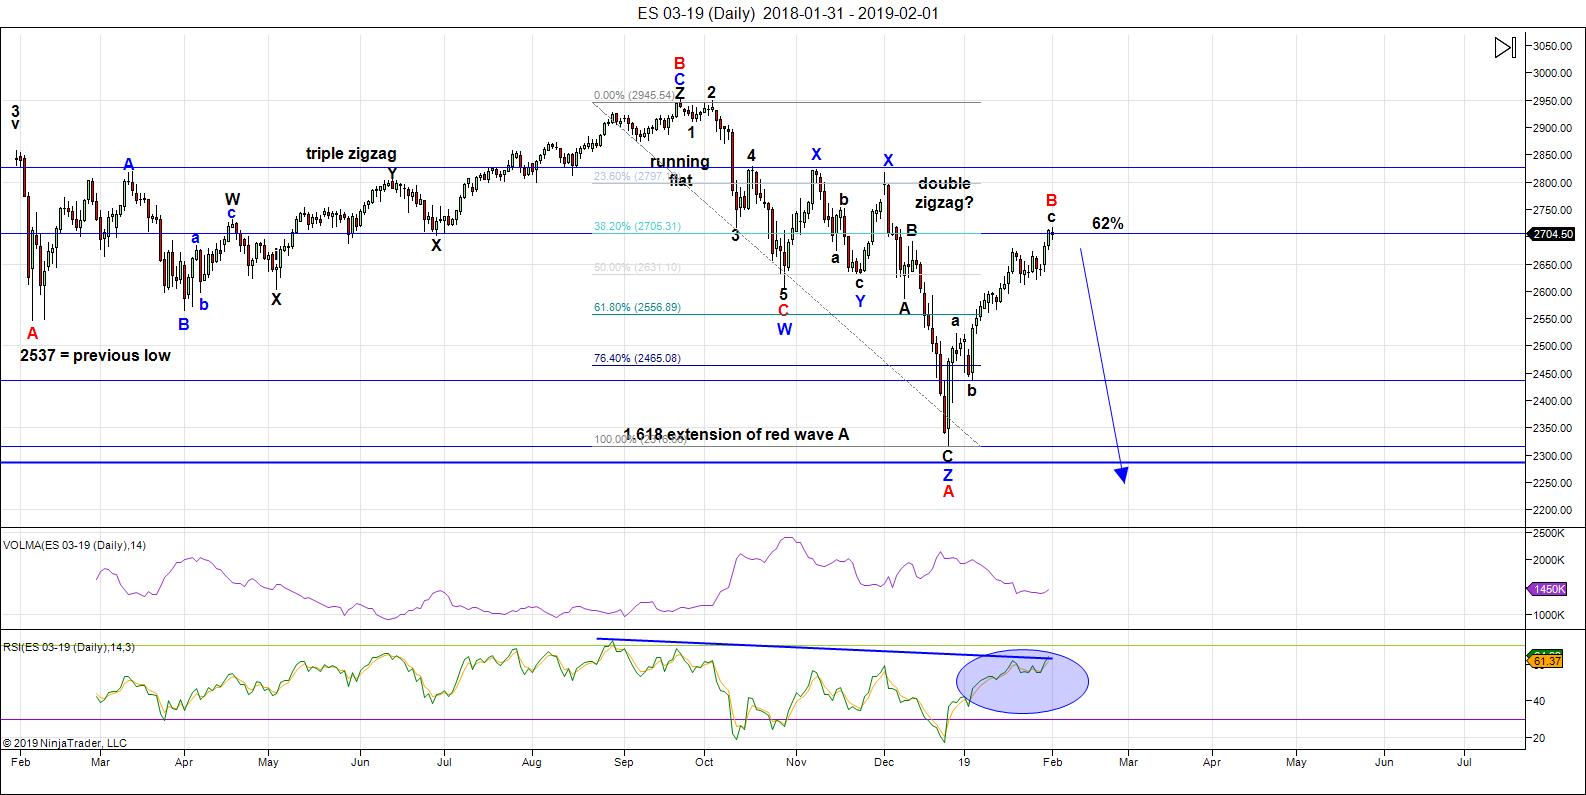
Above is the daily chart of ES (click to enlarge, as with any of my charts).
The height of this B wave has confirmed that the way I count it has to change; it's now a B wave, having risen to exceed the 62% retraced level from the all time high. That means we have a large C wave to the downside just waiting to get started.
NQ (Nasdaq futures) have not quite hit the 62% retrace level; however, they're extremely close, only 20 points at the close on Friday. It doesn't need much impetus to bridge that gap.
In effect, this slightly changed count confirms the patterns in place so far: We have a large running diagonal scrawling across the top, followed by a double zigzag, to complete the A wave of the fourth wave. The B wave up is virtually in place, so expect a very large C wave down to a new low.
I've provided some insight into the bigger picture above so I'm not going to become redundant here.
On short time scale, ES the week before last completed a running triangle in a fourth wave position, which signals one more wave up to complete the countertrend move. We've been in that wave since the beginning of the past week. At the top, we'll look for a turn to the downside.
I expect this wave down to last at least a couple of months and most likely longer. The pattern is yet to be determined.
Summary: My preference is for a dramatic drop in a C wave to a new low that could start as early as Monday. The culmination of this drop should mark the bottom of large fourth wave in progress since January 29, 2018 - over a full year of Hell.
Once we've completed the fourth wave down, we'll have a long climb to a final new high in a fifth wave.
___________________________
Trader's Gold Subscribers get a comprehensive view of the market, including hourly (and even smaller timeframes, when appropriate) on a daily basis. They also receive updates through the comments area. I provide only the daily timeframe for the free blog, as a "snapshot" of where the market currently trades and the next move on a weekly basis.
______________________________________
Sign up for: The Chart Show
Next Date: Wednesday, February 13 at 5:00 pm EST (US market time)

The Chart Show is a one hour webinar in which Peter Temple provides the Elliott Wave analysis in real time for the US market, gold, silver, oil, major USD currency pairs, and more. You won't find a more accurate or comprehensive market prediction anywhere for this price.
Get caught up on the market from an Elliott Wave perspective. There’ll be a Q&A session during and at the end of the webinar and the possibility (depending on time) of taking requests.
For more information and to sign up, click here.
| "I think you are the only Elliot Wave technician on the planet who knows what he's doing.” |
| m.d. (professional trader) |
All registrants will receive the video playback of the webinar, so even if you miss it, you’ll be sent the full video replay within about an hour of its conclusion.


A new twist to crypto risks
Is your money safe ?? Very doubtful
https://www.quadrigacx.com
Here is the headline :
http://news-us.dailyadvent.com/news/detail/385a95ae47449fb119fe35e2bb06b9d5_us?client=mini&like_count=11&features=43
Peter T
I am thinking my Tuesday down hard day might be a gap up on the open Monday and a reversal down on Monday.
I have been looking at that head and shoulders top formation for a while now .
No doubt the Dec lows are important
Thanks for the update
Hi Joe, Whats you basis for UP in the morning and then down, We have state of the union of 5th that might keep the market afloat
Thanks Peter T for the post. Will be interesting to see how it plays out against FED going easy on monetary policy. Very challenging to get any meaningful downside.
12/31/2018 connects with the torque high 2000 (12/31/1999)
Gann’s deathzone gives 2/18-2/25, Watch this timezone.
Monday will bring a high, A 4 day inversion window shifts the high into 2/8.
Cheers,
André
Andre,
What is the meaning and source of your determining the “4 day inversion window” that you mention?
Many thanks
Little background.
Planetary velocity brings kinetic energy. Mars velocity peaks 1/31 – 2/1. Velocity is not an exact timer but does work in the background.
So we lost another force to keep the market up. Mars velocity is down into mid 2020. Don’t underestimate the force from this,
Jupiter lattitude – a multimonth cycle – shows a low 2/3-2/4.
Something is brewing; another crack in the wall.
The wheel of 24 shows a high 2/3 on the dow 2000 high.
A new moon has a double impact.
Gravity is strong (high tides); bearish.
The new moon shields the earth from solar winds (electricity) ; bullish.
In 1929, 2007 and 2015 the highs came with the new moon. 2/4 new moon.
Gann’s annual 1929 forecast gives a high 2/4. Apple gives the high 2/4. Lumber gives the high 2/4.
From Ray Tomes’ site:
When we observe the real universe there are a set of different structures that are at distance ratios of around 10^4.5 as the theory predicts. These structures are:
Hubble scale, Galaxies, Stars, Planets, Moons, X, Y, Z, Atoms, Nucleons, (quarks?)
The real number is 10^4.556302501. As this number is big we use degrees. This indicator gives a low 2/4 on 1932. So monday has to be a low. Hence a high monday morning. Sensitive degrees on the moon give 4:00 in Wallstreet time.
Andre
Do you do any long wave type stuff ?
I’m working on my own long wave and while
It’s in its infancy I’ve discovered a tie to 1808 to the year
2032 . My main work though is figuring out the sunspot cycle .
So that tie may not be stock market related .
My issue with ratios or time spans with planets is that it’s
not a linear calculation . Planet retrogrades can change the aspects
Time wise ( it’s not an exact timeline even though it can be close )
My long wave I’m going to run now that I have my own theory to run on
Includes 7 planets at the moment .
Jupiter Saturn Uranus mars and Venus mercury and sun
It’s a bit of long wave with a touch of short wave .
The moon is very short and to some degree so is mercury .
There is a combination of all of them that takes decades to line up.
That line up is coming but not here yet.
My focus going forward will be more sunspot and weather related
And long wave .
Thanks for your inputs
Joe
Next weekend I’ll focus on the longer term.
My focus is Gann but Gann used astrology, so that could be part of it.
Hi Andre
I follow this long term energy chart. Just for the basic weekly trend. I use other energy charts for shorter daily movements. I’ve attached the chart in the link below.
https://ibb.co/2KD6bqf
Thanks tom.
Remember I mentioned the 4 day inversion window into 2/8? Your chart seems to confirm this. Nice!
About gravity,
Some analysts use a tidal station as a proxy for gravity; the idea being that (strong) gravity is bearish.
I built a model based on Newton’s law and the actual mass and distance of Sun and Moon. Now we have theoretical and zero lag gravity. (tidal sations alwas have lag as water takes time to move up river).
But here’s the thing; tides are not caused by gravity but by the change in gravity. We call that the tidal field.
Will include my own tidal field calculations in my analysis. Currently the tidal field is bearish into 2/5. This is just one force so the market may deviate from this, but the beginning and end of tidal cycles cannot be ignored.
As we come into solar minimum it’s worth understanding the correlation
Add 4.4 years to the 2014 year solar maximum and ????? I guess we will see soon enough
https://www.socionomics.net/2011/09/article-the-sunspot-cycle-and-stocks/
http://www.solen.info/solar/images/cycle24.png
http://time-price-research-astrofin.blogspot.com/2017/02/the-effect-of-sunspot-activity-on-stock.html?m=1
Thanks for posting this, Joe.
There are plenty of studdies yet I’ll stop
With this one http://www.321gold.com/editorials/mcclellan/mcclellan111118.html
Your welcome Peter
I’m begining to think watching the after hours sessions
Is going to be helpful on individual stocks
Seagate reported decent numbers and had a spike up
And then dropped some 10 % after the close .
Tomorrow should be an interesting day as will be Wednesday .
There used to be a newsletter called trendfunds
They merged with someone and the name changed .
They focused on trading options going into earnings reports .
The general trade was to buy calls around 10 days before the earning report date.
You sold those calls just before the news.
Those parameters also going into the end of the quarter .
Since find managers have to what stocks they hold, they tend to sell their losers
And buy what ever stocks have done well for the quarter ( hence window dressing )
The winners tend to keep rising and the losers tend to keep falling going into the end
Of the quarter .
This trading style worked very well in the 90’s yet I can’t say how well it has worked
Over the past few years .
Anyways it’s worth keeping an eye on up coming earnings reports .
“Saddle up pilgrim!” We got some straddlin’ and stranglin’ to do this week!
Feb 13s,
2/6 will be a high.
Gann’s mass pressure gives the high 2/6, NDQ gives the high 2/6. 2/6 is a Gann natural change in trend (32nd harmonic). 2/6 is a shadow date on 2000.
The tidal field is bullish into 2/13.
I’ve given up on shorting this. Waiting for the next plunge to just buy and wait for the FED to pump things back up. The bear market will probably have multiple 76% retraces so its going to be a messy zigzag to the bottom over probably a very very long period.
The next few weeks for me are difficult to call.
My gut says we are seeing an inversion taking place
In this later stage of this cycle which is coming to its end .
It’s telling me to sit back and let the market tell me whether
Or not an actual inversion has actually occurred.
Mondays early price action as well as Tuesday did not go as expected.
Something has changed and while I have a few ideas they are not concrete
At this juncture .
I’ll be waiting until early March before making any timing based remarks .
I’m looking at specifically the trend from March 5 to March 15 as well as
The overall trend from March 5 to April 4 ish .
There are a few shorter term swings in that time period yet I’m keeping my
Views to myself .
Feb 13-19 th if an inversion is the right assessment would be lows of sorts
As would be mid March .
Overall we are probably in the early stages of a consolidation ( sideways range bound movement )
Lasting several months .
If the spx punches through the 200 dma many will take that as a bullish signal but I think it’s
Premature at this point to think that .
For me, I’m expecting something more confusing and at the moment I’m just going to expect
A whole lot of nothing ( sideways )
I’m noting that this advance is losing momentum
I do not have the same access to market data as I have when I’m home .
Bottom line : now that the market is washing out the bears little by little
And giving the bulls some confirmation that a bottom is in place
I see a wave count of 1 2 3 4 I II III which needs a IV V to complete
But I’m questioning that as a 5 wave move .
It can be 1 2 3 I Ii III IV V 3 then a 4 and 5 for a more valid 5.
This leg then is part of an extended wave 3 from Jan 22 .
Like I began , the next few weeks for me are difficult to call and
Regardless of the 2 wave counts noted , this market is in the later
Stages of this wave count and short term timing is changing .
I cannot be much use until I see how this market trades for about the next
Month to 2 months .
Good luck everyone
patience..which at times I feel I am running out of ..lol
Peter T
I got into a rather lengthy discussion with our union rep yesterday .
We discussed our pension along with a few other things which then
Got a bit political .
Towards the end of the discussion He says to me something like
So we go into a revolution and we both agreed .
But….. When I asked him to simply look at what was going on in France or
The EU the reply was . We are kit France , we are the United states .
I have heard that reply a few times lately and I’ve heard it enough to think
That the mind set here from our younger ish age 30 ish generation really
Believes the USA is exempt from common sense economics .
This younger group really has no grasp on history nor any real grasp
On what’s coming .
Everyone is or has been taught it’s only man made global warming .
The sky is green so to speak . They all got decent grade point averages
And are ” educated ”
How do we explain to them they were taught a lie ?
My oh my the shock and denial that we will have to deal with .
Well said Joe
Bob
Not likely. As tradets we really need to look at market ptice action rather than fanciful “predictions”, no disrepect.
The market is again clearly in sone kind of triangle. The break from it will almost certainly be higher.
Amazing to see folk doing and saying the same thing interminably and expecting different outcomes.
I could me missing something.
While I personally think the next wave up will be the last, I would be a fool to predict that it will based on what has happened after several recent triangle patterns.
Verne
Admitting something changed is not being fanciful .
I look at specific time frames more so than short term
Wave counts . The intra day swings I don’t pay as much attention to .
A failed bullish triangle is typically a bearish sign .
I’m standing by my own work and letting the market tell me
What it’s intentions are.
The daily chart to me is more important and the weekly chart
Has not shown anything at this point to go on .
I need to see more development in both the daily and the weekly
Before attempting to call this .
The poke above the 200 dma is a bullish sign but is also a resistance point
Today’s bullback on the open keeps the market ( index ) below it .
The 200 dma slope is more important then it’s price level .
A 1 % change in that slope is something I’ll begin paying more attention to.
Downward slope not a good thing .
Nothing else for me to say untill mid March .
I’m not an intra day trader .
Added to longs on Dec 26 open and have to admit this rally is a bit long in the tooth .
Now I need to see a short term wave IV then a V and I am not convinced we get that .
The Jan 22 lows were the start of some type of extention .
A retrace back to the Jan 22 low now with out a IV then V
Will turn me bearish .
I’ll let the market tell me what it’s plan is before being fanciful .
It’s all good mind you
I’m just admitting I’m not sure what comes next .
The wave count now is more important to me as I wait for
This time gap to play out .
Points well taken Joe.
I was certainly wrong about the directional break from the triangle.
I know Peter does not believe in truncation but it does look like a failed fifth wave in some indices. My comment about fanciful predictions just reflect my frustration about statements about what the market is going to do with no analytical basis whatsoever; whether a proposed wave count, or some lunar influence or whatever other methodology.
In my case I cited the triangle formation and at least offered a basis for my opinion, granted it turned out to be incorrect.
As to the current market, it looks to me like we have five down followed by and expanded flat for an upward correction. If correct, the C wave of the flat should complete with subsequent resumption of the downward trend. I do not have very strong convictions due to the reclaim of the 2700 pivot but the upward move does look corrective to me.
I certainly did not mean to case any aspersions on any one’s opinion.
It may be that my expectation that posters would offer cogent reasons for the opinions they offer is misplaced. After all, I think we are all here to try and learn a thing or two from one another’s contributions.
Not a failed fifth. This entire wave up from Dec. 26 is a corrective pattern, so truncations don’t apply (they don’t actually exist — someone just has to find a valid one somewhere in the past hundred years or so to prove they do, but I’ve never seen or heard of one that I can’t otherwise easily explain with a regular pattern). In corrective ABC waves, you don’t actually need a fully formed fifth wave, but it appears we’re getting one in ES/NQ/SP500. The problem with corrective waves is that you never really know.
We were at the top of the third wave of the fifth on Tuesday night and ended up getting a corrective fourth of the fifth (Wed/Thurs), which dropped to the typical 38% retrace level, and now we have the fifth of the fifth in progress. There was indeed a triangle-looking thingy but it didn’t fully form. It had two points on the upper trendline, two on the lower. Triangles need 3 touches on one side, two on the other.
I’ll be posting a bit on timing tomorrow.
I agree the move is corrective so the fifth would be of a C wave. I noticed that in the assumed C wave up some indices made new recent highs before breaking uptrend channels and some did not. If you right, the we can expect a new round of index highs next week. We shall see! 🙂
Well, this is indeed a tough one to analyze, but looking at the Russell 2000, which is quite obviously three waves down, tilts the direction to the upside.
A similar story playing out. Countries outside the US are looking much weaker early on. DAX has decisively broken down through the trend line while SPX is still staying close to it. This time around, I had placed a bigger part of my shorts outside of US. Slowly moving those shorts to the US now as some of the sell signals are triggering.
I tend to agree with Peter in regards to failed 5 th waves .
There are several things I look at in Elliott wave terms
That many including Peter t may not agree with for that matter.
To wrap this up though
A lot of discussion has gone on here about the puetz cycle
And I made light of how I studdied it and compared it to market history .
I then made a point of noting short term swings such as the gap down
Or gap up scenerio which I’m thinking was a Monday . Based on that gap down
And bounce day I said we should continue higher into Feb 4 new moon and that
Tuesday should be a hard down day yet Wednesday I wasn’t sure of and that
From Wednesday on I couldn’t call it .
Well we did not get that down hard Tuesday and
The market ran up not down .
I then said something changed and my gut says I think we are seeing an inversion
And if so then Feb 13-19 th would be a low of sorts .
Just to clarify is all .
Everything played out perfect going into Feb 4
The stall on Tuesday was the change .
This recent big drop is so far at least showing the inversion
I was suspect of .
Now come Feb 13 we have the mars Uranus conjunction
There is some history of that being a low . It’s not as accurate
As the call for a Jan 4 low using that same planet pair but there is
Some history to it . Next we have the 6 weeks after the solar eclipse
Full moon . The entire time period from Feb 13 to Feb 19
Is full of time clusters and I must include the entire time span
Yet by calling that time period a low I actually view it as bullish .
But then comes March 5 when mercury will go retrograde
and we therfor enter a new set of parameters and while one cycle
Ends another begins ..
I know my timing methods are to some off the wall but I will say
I have studdied others work and looked at market history to gauge
The accuracy of these methods .
Not every time will these work but the ones that are the most
Consistant I focus on to a T. If something changes from the typical
I look for a reversal of trend .
If and I’ll say if the typical set up appears inverted I then look for
The market to do the opposite yet with in the same time frames .
Accasionally though you get what we just got .
Now I must wait for the rest to play out . Then watch for
The next setup going into March 5 then see how the market
Moves into March 15 then decide if I want to trade the potential
Move from March 15 to April 5 . If I take that trade I hold
From date to date then I exit if I’m using options or futures .
It’s all using technical analysis and a huge focus on timing and
Using Elliott wave counts that are not always considered by most
In advance . Like how does one say look for an expanded flat low
Before it happens ? How does anyone say hey I need to see a wave iv then v
But I’m not so sure we will get that ?
I have very high respect for Elliott wave theory yet I have spent many years
Researching timing . When it’s working it’s awesome when it’s not working
It can be so incredibly bad that I look like a fool for even bringing it up .
When it’s right it’s 85 % right . When its wrong for stretches at a time
It’s just terribly wrong . Yet then it’s starts working again so I’ll never lose
Faith in what I’m doing .
Until March I’m waiting and I explained why .
I also explained this entire cycle before it actually happened .
It’s snowing in the Columbia river tonight . Fun fun
Enjoy your weekend 🙂
About the longe term.
We have different tools. One being the wheel of 24; supposed to be the universal clock. 1388 is 0 degrees in the sqr of 9 in the 19th cycle. 19 is the root of 361 so very vibrational.
1388 times 24 on 1932 gives 9/21/2023. This should be low.
Mid 2020 is also sensitive. 7/30/2020 HC Pluto is conjunct the HC north node of Saturn. This is a very rare event (pluto orbit 248 years, so every 124 years it hits a node. We are fortunate to see this.
Mars velocity is bearish into mid 2020 and the tidal field is down from august 2018 into mid 2020.
I expect a high q3 when Venus velocity joins mars. After a low mid 2020 I expect a high mid november 2020.
Monday will be a high. 2/11 is 40 root 5 years from 1929.
Will explain about torque tomorrow. For now; your baltic dry index gives a high 2/11 using torque and the composite garret cycle.Tomorrow some more.
Andre
Thank you : )
A new weekend post is live at: https://worldcyclesinstitute.com/the-pressure-is-mounting/
This website is for educational purposes relating to Elliott Wave, natural cycles, and the Quantum Revolution (Great Awakening). I welcome questions or comments about any of these subjects. Due to a heavy schedule, I may not have the time to answer questions that relate to my area of expertise.
I reserve the right to remove any comment that is deemed negative, is unhelpful, or off-topic. Such comments may be removed.
Want to comment? You need to be logged in to comment. You can register here.