

The End of the Road
I can see it from here, but it’s still a little ways off in the distance. Reaching it will be like dropping off a cliff in some respects. The world will never be the same.
Relax. We’re not there yet. In fact, we have a few weeks left to go. Cast your gaze to January. Because …
For a couple of years now, it’s been obvious to me that the US Dollar was “running the show.” It just made sense to me that being in corrective fourth wave since the beginning of 2017 would eventually lead to the top of the US market when the US Dollar bottomed. We’re not quite there yet, but it looks like we will be sometime in January (perhaps earlier than later).
This week, I expect all the asset classes to turn into their final wave to the top. All the assets I cover daily (ES, NQ, major US cash indices, USD currency pairs, gold, silver, and oil) should turn together.
This will lead to the trend-ending parade by virtually everything to the final top (bottom for the US Dollar). The US Dollar turning back up in deflationary. If you’ve read any of my posts on this topic, you know that we’ll eventually end up in spiralling deflation. This is what has happened in every financial collapse in history.
In the meantime, as I said last weekend, it looks like Santa is coming to town for the usual seasonal rally. I expect a final rally to last through the holidays, and at least into the very early part of 2018, if not a little longer.
If that’s the case, I would expect to see the crash sometime in March (it always happens in wave three, so we’ll get a fair amount of warning).
Ending Diagonals
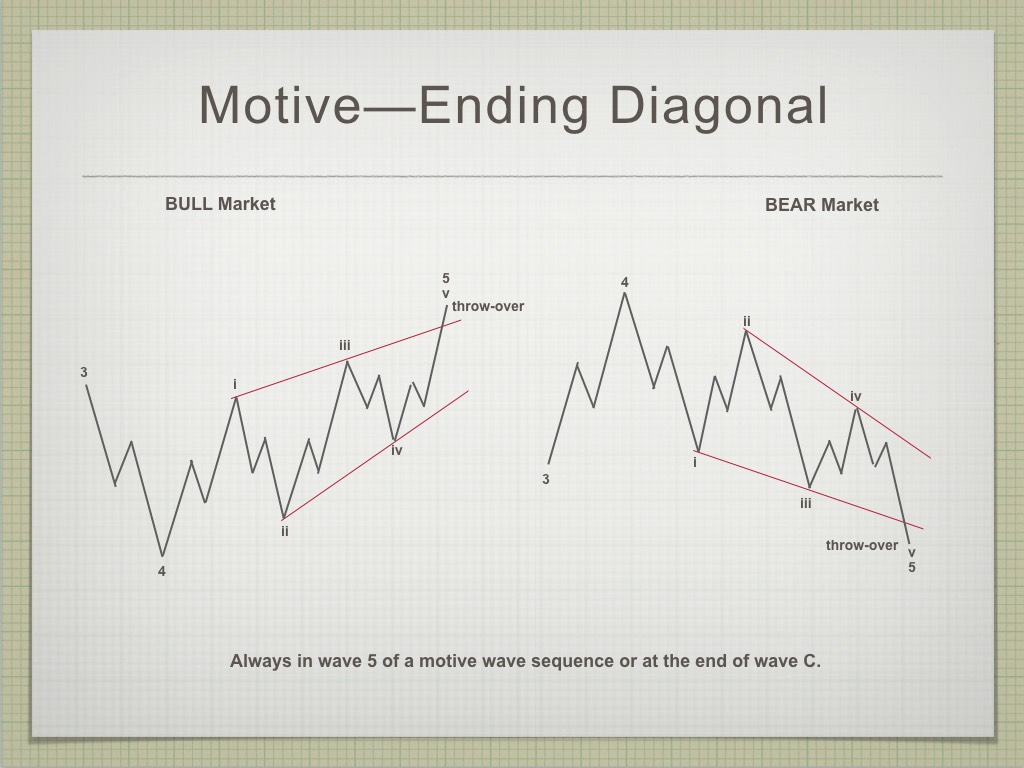
Above is a diagram of the structure of an ending diagonal. There are a number of rules for the formation and they cannot be broken:
- A diagonal triangle always subdivides into five waves.
- An ending diagonal always appears as wave 5 of an impulse or wave C of a zigzag or flat.
- All waves must subdivide into zigzags (5-3-5 wave combinations)
- Wave 2 never goes beyond the start of wave 1.
- Wave 3 always goes beyond the end of wave 1.
- Wave 4 never moves beyond the start of wave 3.
- Wave 4 always ends within the price territory of wave 1.
- Going forward in time, a line connecting the ends of waves 2 and 4 converges towards (in the contracting variety) or diverges from (in the expanding variety) a line connecting the ends of waves 1 and 3.
- Wave 3 is always shorter than wave 1, wave 4 is always shorter than wave 2, and wave 5 is always shorter than wave 3.
My concern this week about wave three of the ending diagonal was because it was breaking the zigzag rule. Zigzags are three wave moves and until we got the new high on Friday, wave three was in five waves.
“The market always does the most predictable thing in the most unpredictable manner.”
We still have a wave four zigzag to go, along with a final zigzag to a new high. I expect the end of the wave 5 zigzag to conclude as the US Dollar bottoms, gold bottoms, and oil tops.
Let’s see what happens.
Where I Disagree with Bob Prechter on Ending Diagonals
In the Elliott Wave Principle (the book), Robert Prechter classifies ending diagonals as a motive wave. I classify them as corrective waves, because they appear both at the end of corrective C waves, as well as wave 5 of an impulsive structure. The pattern in certainly corrective, in that all the waves overlap.
In my way of thinking, the very nature of an ending diagonal is corrective. The overlapping waves signal that the market is simply too wear to complete an impulsive pattern and reverts to an overlapping pattern, which plays out until it tops. They typically have a dramatic reversal that retraces to the previous fourth wave.
In that case, ES would turn and head back to 2610 for a small first wave down. Since I expect ES will top at about 2700, that’s a 100 point move for the first wave.
Ralph Nelson Elliott, who discovered the wave principle and literally wrote the book on it, also classified ending diagonals as triangles, and included them under the heading of corrective waves. He also noted that they form at the ends of third waves (rarely), as well as fifths, which seems to be the case, as we’ve seen over the past few months.
There are other issues with the information in the Elliott Wave Principle, information that is incorrect, a follow-up post that I’m currently working on.
________________________
Problem receiving blog comment emails? Try whitelisting the address. More info.
______________________________
Couldn’t be happier … KK 2
Couldn’t be happier …The analysis and insight you provide is simply amazing! I’ve been trading the futures and equity markets for well over thirty years and usually average around 5% monthly. Since joining your Traders Gold Service two months ago, that number has better than doubled. I couldn’t be happier.—KK |
Rise above the rest … SM 2
Rise above the rest …I have only ever met a few people who, in their chosen fields (astrology, medicine, music, martial arts, technical analysis), rise above all the rest and you are one of them…you have ‘the gift’…and that’s why I’m a Trader’s Gold member. —SM |
Tops in your field DZ 2
Tops in your field …You are tops in your field. Tried to follow Elliot Wave international for years. They were always behind the market. After discovering you, I perceive that you are an expert in reading the waves, which puts you way ahead of the rest of your peers. And you can read the Waves like you are reading tomorrow’s financial section. I pray you stay healthy. —DZ |
the real deal SM 2
The real deal …‘Educational, insightful and thorough market analysis for all levels of traders. It’s Elliott Wave at its best….Peter Temple is the real deal’ —SM |
Get an upper hand … JC 2
Get an upper hand in trading …Seeing all the different currency pairs and the wave structures and hearing you explain why this has to do that on a nightly bases gives one a upper hand when trading. Elliott Wave applies to all stock and indices and can be applied to any candlestick chart. If someone ask what you want for Christmas – Tell them a membership to Peter’s “Traders Gold!”—JC |
The best of them JL 2
The best of them …Last couple of years, I subscribed to several ‘market traders’. You are by far the best of them and the personal contact is awesome. Daily and daily updates are very well written! Besides your expertise in EW, I also like your cycles analysis. Best investment I ever made! —JL |
Have not had a losing week RW 2
Have not had a losing week …I have been with Peter almost a year. The only thing that matters is have I made money with his service. I think I have finally turned the corner using Peter’s EW. I have not had a losing week in the last 5 months. Thanks Peter, for your amazing amount of hard work. —RW |
A true expert in Elliott Wave FL 2
A true expert in Elliott Wave …You are a true expert in EW analysis. What you provide is not available anywhere and is priceless. Subscription on your services is the best thing I have ever done. Many thanks for your effort to make me a better investor. I now have more trust in my investment decisions. I hope you will continue the excellent work! —FL |
The Market This Week
Here's the latest daily chart of ES (emini futures)
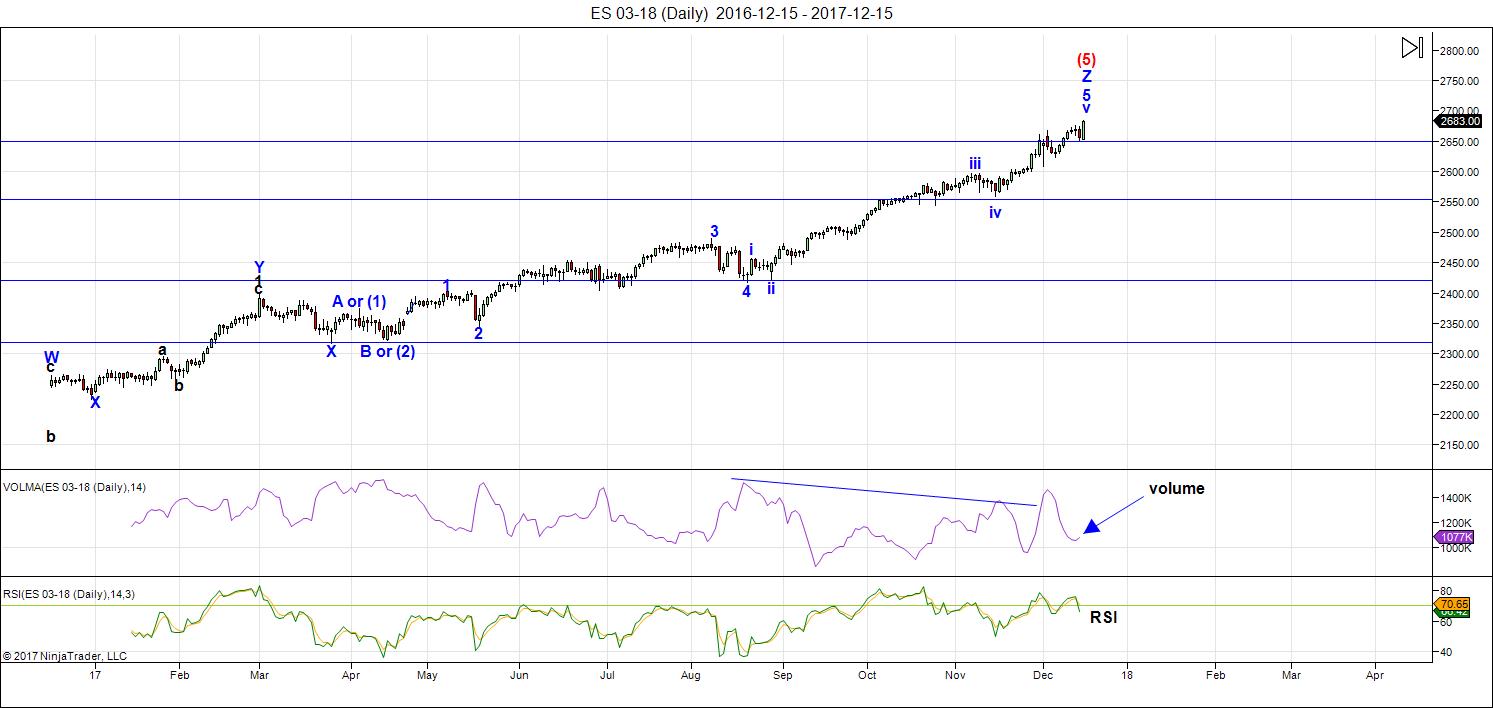
Above is the daily chart of ES (click to enlarge, as with any of my charts).
There have been no material changes to my prognosis. We are at the high. I expect this final wave to breach the previous high for the final time.
We're now down to hourly charts for all the action. It's been a day trading environment for the past few months.
Volume: With the most recent wave up at the top of this market, you can see that volume has contracted rather drastically as expected. This, of course, is a very bearish warning.
Summary: The count is full for the US market in general, except for small subwaves that form the balance of a motive set of waves in SPX and some other major US indices. I put us in a final ending diagonal in ES.
_______________________
Here's the latest 60 MIN chart of ES (emini futures):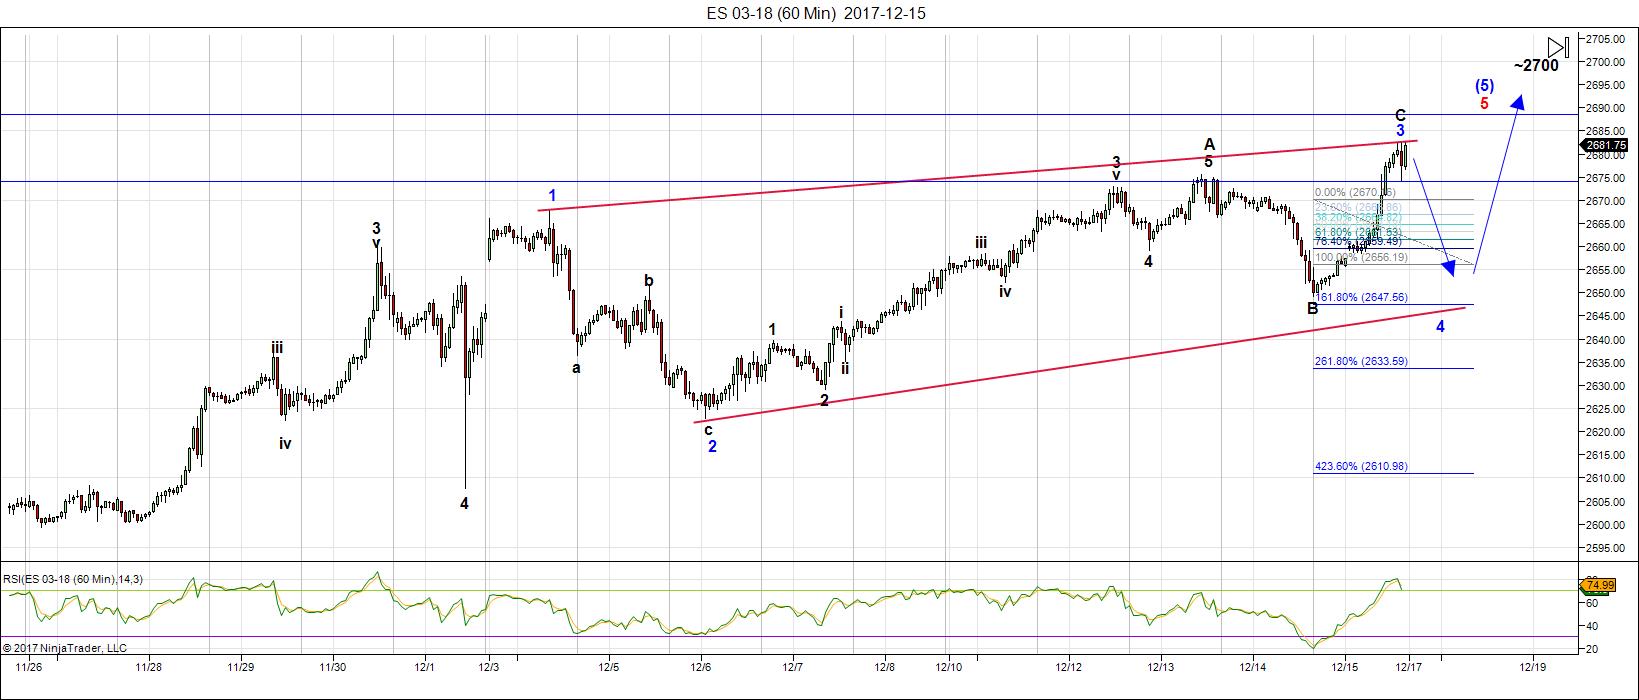
Above is the 60 minute chart of ES (click to enlarge). Please watch the video to get the full story on what's happening short term.
Last weekend, we knew we were dealing with a triangle of some type. Early in the week, with the rally to a new high, the contracting triangle option ceased to be an option; the ending diagonal became the pattern of choice.
In the Trader's Gold service, all this week I've voiced concerns about the third wave of the ending diagonal, because it was clearly in five waves. All subwaves of an ending triangle need to be in three waves. Well, on Friday, ES/SPX solved that issue by going to a new high. Now we have the required ABC wave up to complete the third wave of the ending diagonal.
The next move is down to the 2645 area, followed by a final wave up to the 2700 area. Fifth waves of ending diagonals cannot be longer than the third wave, so with a potential bottom for the fourth wave at approx. 2645, the maximum high for the rally will be about 2700.
Short term: The wave count is now virtually complete. It appears that we're tracing out a final ending diagonal in ES, which is a final pattern before a trend change.
___________________________
Trader's Gold Subscribers get a comprehensive view of the market, including hourly (and even smaller timeframes, when appropriate) on a daily basis. They also receive updates through the comments area. I provide only the daily timeframe for the free blog, as a "snapshot" of where the market currently trades and the next move on a weekly basis.
______________________________________
Sign up for: The Chart Show
Next Date: Thursday, December 28 at 1:00 pm EST (US market time)
NOTE: No Chart Show on December 21—cancelled.

The Chart Show is a one hour webinar in which Peter Temple provides the Elliott Wave analysis in real time for the US market, gold, silver, oil, major USD currency pairs, and more. You won't find a more accurate or comprehensive market prediction anywhere for this price.
Get caught up on the market from an Elliott Wave perspective. You’ll also get Andy Pancholi cycle turn dates for the SP500 for the balance of the current month. There’ll be a Q&A session during and at the end of the webinar and the possibility (depending on time) of taking requests.
All registrants will receive the video playback of the webinar, so even if you miss it, you’ll be sent the full video replay within about an hour of its conclusion. For more information and to sign up, click here.


EW king! ???
Peet, AEX up to 563-+ still my feeling so we make also a higher high. What say you my friend?
I hope all is well! Don’t forget to check out the url (movie) I sent you per e-mail. I wonder what you think about it…
Cheers,
W
Yup. One more to go for both AEX and DAX.
https://invst.ly/644zz skinny ED pattern
https://invst.ly/6450d magnified chart of area of concern
peter,
with the greatest of respect, i question the 5 wave count you have for the wA of w3 of the ED………….. where you marked w1 of wA , this w1 fails to be a w1……there is obvious overlap that occurs within this w1 of the ES, which invalidates 5 wave count….. I gave you the general pattern above, and put a circle around the area i respectfully question……. then below is a magnification of the circled area……..showing that any way you count it – there is definite overlap occurring within w1 making it something else …………………
………………….and of course….thank you as always.
my apologies…. i gave you the incomplete chart of the “magnified” area…….
here is the complete one…………..https://invst.ly/6454n
Taking a look at $$cpi:$usd since 1972 seems to be on a verge of reflation not deflation
ES has a very evident ascending trend line beginning from the 15th of November that has served as support 6 times: Nov 20, Dec 1,6,7 and 14.
So, it could be well the ED with A on the 4th Dec, B – the 6th, C – the 13th, D – the 14th and F – in overthrow now.
Sorry, the last wave is E, not F
I think a rip to 2800 on the cards into the new year and a top in Jan possibly. I remain long and enjoying the easy profits greatly.
Lol
Sometimes people just can’t resist stroking their ego while spitting in the face of others. This site is dedicated to CYCLE ANALYSIS and therefore determining higher probability changes in price direction. Many people spend many hours investigating and analyzing ideas proposed by others on this board. It simply amazes me when the bulltards come on here with their…”I’ve been long and I’m a winner attitude”. I guess all the research that people do on cycles is just a waste of time, huh?
So much of opinion is often constrained by a person’s time-frame context. Most thoughtful posters with a big picture perspective are not in the slightest bothered by smug rantings from people less interested in making a meaningful contribution, than they are in casting aspersions. I wonder how many of them are trading 7 figure accoumts?! 🙂
The torque high on SNP was 11/24. So even when prices are up, it takes more volume to push up prices. This is like rowing against the current. It can be done but sooner or later you’ll get exhausted. Garret timing on 11/24 gives 12/22. This will be a high. Garret timing on the 2015 torque high gives 12/29. This will be a more signifcant high.
Numerology gives a cycle from 12/29 (high) till 1/20 (low).
In 2000, the torque high came 11/26/99. DJ made the high 1/14/2000 (49 days) and SNP 3/24 (119 days).
The 11/24 high came 939 days after the 2000 high. And 939 is a midpoint in the sqr of 9.
49 days from 11/24 is 1/12/18. This is the date vix gives a low. This makes 1/15 very vibrational. 119 days after 11/24 gives 3/23/18. This is likely the start of cycle down into the vibrational 7/8/18 low. 3/23 is also garret timing on the 2015 high.
My jupiter/Saturn cycle givees 12/22 and 2/22/18. The midpoint between the dates above is 2/20. This will bring a low. After that up into 3/23 for a retrace and a w3 down into may 1-2,
The cycle structure should look like this:
12/22 high
1/2/18 low
1/5/18 high
1/10/18 low
1/15/18 high
1/20/18 low
1/31/18 high
2/11/18 low
2/15/18 high
and 2/20-22 low.
This brings 9 cycles. This is very common for extended waves (4+5). The run up into 3/23 should have 3 cycles. Will work on this for the next few days.
From 12/22 down into 2/22 is 40 days. (actually from 12/24). Up into 3/23 is 30 days. Down into 5/4 is 40 days. Up 30 days bring a high 6/1. Down again 40 days brings 7/10, the midpoint between my vibrational 7/8/18 and 10K PI from 1932 (7/12.)
3 times 40 plus 2 times 30 is 180 days/ degrees. This is one cycle.
This skinny Ending Diagonal in the ES has now officially executed all “my” own required elements to be considered complete.
The last and FINAL element is a “hard” price reversal.
There is a chance that this hard price reversal is directly at hand, and should be considered and recognized as ‘potential’………. in which case – “God be with you all my friends……………”
https://invst.ly/64b5z
Difficult to see this move as part of any ED third wave, and it is certainly not a fourth…
verne,
if we zoom in on friday’s end of day…..and overnight action…we see this…
so this wave is a zigzag, and an overthrow, of an ED………. https://invst.ly/64dmw
we shall see..
Process of elimination leaves a fifth wave. If it is an ED it must be a ZZ.
I have to concur…confirmation will come with a face-ripping reversal. If not, I am concededly clueless…. 🙂
Well, we’ll see if you’re right. The final wave up in ES is in 5 waves, but NQ is at my projected top. If it’s complete, it has a ver odd structure for an ending diagonal.
We’ve come to the point here where we can read “The price is going up, but the cycle is very down” – amazing. The only guy that was warning others about the psychological madness that’s going on here was banned (pretty funny, and telling…). Every Sunday a top call, invalidate by Monday morning. For months. Guys, seek help, I’m serious.
Come on Nicholas. The melt-up was clearly predicted (and traded!) by some of us, so please do be fair. I will remain on record calling this a terminal wave with a 2730 target. Nobody’s infallible, but that’s the way I see it at the moment. 🙂
nick, old boy
…………..”the kitchen is a HOT place”………………………!
As someone has observed, up the escalator, down the elevator.
When the crowd becomes indifferent to a proper asessment of risk, you know the hour is late…
I beg to disagree that “Dave not from Vancouver” was the only one posting bullish calls. Perhaps because you only read Dave’s post?
In the weekend I gave you the vibrational 20/8/2023 date. Using the sqr9 to look back from that date we can see 1/11 is at 0 degrees. This is a very sginificant date and confirmed by the VIX 1/12. 1/11 should be a high but as usual we will see an inversion. so 1/11 high become 1/5 high 1/10-11 low and 1/15 high.
One cycle further we get 7/7/18 at 0 degrees. This is the date I gave above, A complete cycle is 6 times 360 as a box has 6 sides in a 3 dimentional world.
6 cycles from 11/1/18 we find 8/10/20, This is a very significant low. And it means that in the cycle down into 2023 the first leg (a?/1?) runs into 8/10/2020.
After that we will be up into 2021-2022 before we are down again into 2023.
Watch 1/11/18; very strong date. And 40 days from my 2/12 date.
This analysis confrirms that we are down from 1/11-ish into early july, in a 1 of 1/a.
$indu – https://pbs.twimg.com/media/DRViIsRXUAI3MsA.jpg
That chart has a very obvious problem presented as an ED, and that is no wave 4 overlap of wave one. It is indeed a bearish rising wedge…
The larger degree ED is I suppose still viable, but the movement above the upper boundary seems more than a typical overthrow imho…
$spx – no labels, only lines – https://pbs.twimg.com/media/DRVodrzWsAE-VyN.jpg
that’s not your chart…however, I know who crafted the chart!
rot,
yes, it is a chart from Anthony Allyn………………….. and show me where i professed ownership of “any” cash charts…………………….
you can clearly tell from the url which charts are mine, and which are anthony’s and which are shanky’s, and which are daneric’s ……………………… and i have given attribution in the past to their charts…..
https://twitter.com/3Xtraders/status/942774571819831298
https://twitter.com/spiralcal/status/943154747158290433
Tks. So that’s what was going on the other day. I wasn’t paying attention. Why I’m adamant about not posting other people’s info without permission.
https://worldcyclesinstitute.com/the-hopium-epidemic/comment-page-1/#comment-21389
– “…major ‘trending periods’…”
– “the initial period runs from September 13, 2017, through December 15, 2017”
– the next trending period is months away…that might be the one the majority of posters here are anticipating 🙂
– pivot days…Monday, December 18, is a PD-1…so is Thursday, December 21…PD-1, SPX accelerations…terminations…changes-in-trend…think POWER
Man alive!! What is it with all the infantile SNIPING??!!
People are trying to help, for God’s sake!!!
I am taking a break… 🙁
verne,
agreed, perhaps a forward indicator of social mood which has already changed.
here is “MY” last chart …………. the chart of the skinny ED. It has met all my “cheat sheet” criteria, and remained the shortest wave. Any move higher, will invalidate………………………all the best……………………good bye.
https://invst.ly/64ffj
week after week, posters at this website ‘allegedly read’ Peter Temple’s weekly blog post, then post comments and charts subtly conveying what is wrong with Peter’s take on the financial markets…sad but true!
Grows a thick skin … lol.
you are a good man…thanks for all you share!
I have seen Peet on skype, thick it is hè Peet? ??
Cheers my friend,
W
5 cm and counting. Easier than constructing a bomb shelter.
Peter,
Any changes in your thought, we have a new moon today probably thats dragging prices higher. Do you still think we visit 2650 area before 2700 or you are thinking something else.
Bill,
Nothing I can see so far has negated my count, so I’m still sticking with it … until something happens to change it. What I have labelled in ES as the third of the fifth is longer than I’d like, but I need to see where this wave down goes …
Wow.. So glad for that spike down late Friday to let me cover my SPX shorts going into the weekend.
I am watching for tax reform to pass and as soon as they announce it I will be looking to short, might even nibble just before a small position.
Everyone and their mother is saying the market will blast once it happens. Classic buy the rumor sell the news. I will be watching for the spike up then violent reversal. If the market tanks first – I will then cover my small position and give it 30 mins or so.
I thought we were in the 5th of the 5th of the 5th with top no bigger than ES 2670?
ES is now 2695 and we still have more to go?
And all the comments on here act like it’s normal? With no questions?
Either I am missing or misinterpreting something or I flat out don’t understand EW and Fib tools.
What I do know is, the bar keeps getting raised every time at a new ATH.
That’s impossible to trade, unless I am a total dummy and don’t understand.
Sorry Peter, I like your work but there is no explanation on new highs. Just that we have more to go.
Charles,
We’ve been talking about a triangle for three weeks now. A triangle is a final pattern (a continuation pattern), no matter what kind it is. They always lead to new highs. But you can’t predict a top tick until the triangle is formed. Same with an ending diagonal, which has a limit on the length of its final wave. But you can’t project the top of the final wave of an ending diagonal until the fourth wave is in place. That’s no secret and I’ve explained it each time I’ve complained about an ending diagonal forming, which has been way too often, imho. Last week time-wise, I projected the New Year for the final high.
Some people here think the fourth wave is in place. I do not, as I’ve stated.
So nothing has really changed in weeks. Yes, we’re in the fifth of the fifth of the fifth. Once the final subwave is in place and currencies (the US Dollar in particular) have played out their final wave (which I’ve also stated over and over again), the US market will turn down. I put a diagram of the pattern in the blog post, to make it as clear as possible. I can’t think how to make it much clearer.
Many people here seem to think that ES exists in a world of its own, but the market is defined by what the US Dollar does, as I also keep saying (and have done separate videos on).
I sometimes provide “what-ifs” targets but until the final pattern (which I’ve shown on the screen) plays out (and the scenario above plays out with currencies, or the US Dollar at least gets closer to its target, you can’t determine the final tick) in ES.
Thank You Peter, I know it takes much time to put this information together and it is greatly appreciated. Thanks so much for the explanation.
Regards,
Charles
Peter is correct, the 4th wave had not even begun, probably won’t until 2018.
Tks.
Hi Peter, I really enjoy and appreciate your BIG LONG TERM vision, but at the same time I dare not take your view for the SHORT term vision. I have been seeing the TOP call for so Long. I am not sure if you give more precise short term view to your subscribers though. People wold have lost so much money if they short market few weeks ago
I’m not sure what you’re referring to. I haven’t called a top. The free blog gets a snapshot of one asset out of the ten I cover with a video every night. For my Trader’s Gold service, there are nightly videos and timeframes are, of course, much smaller.
When I call a top, the EW methodology requires an impulsive first wave down to a previous fourth wave, a second wave bounce in three waves to at least a 62% retrace and a turn to a new low. That’s a top. I may have called tops to wave patterns, but certainly not the the market. As I’ve been saying, currencies still have a ways to go.
Trying to “pick tops” to trade is a very unwise idea.
Thanks for replying. Maybe I misunderstood. English is not my Mother tongue…..and Ew is not my expertise too. I see so many TOP, FINAL, LAST in your article title…….although the article inside is MAY TOP, SHOULD TOP. Anyway, I still love to read your article!!!
A bit of pain for me these past several days .
I’m short on spec account and still long on individual stocks.
I am looking into a potential error I most likely made yet need to double check
My work vs a magazine I have been looking at ( astronomy, Jan 2018 edition )
If I’m wrong , here is part of the error .
The Venus bear cycle begins when we see a superior conjunction with Venus and the sun
As well as an inferior conjunction with mercury and the sun . They don’t always hit on the same day
Yet ideally you would see the sun Venus and mercury all conjunct together but that is not usual, they are
Normally days apart .
The magazine shows Venus superior conjunct the sun on Jan 9 2018 so my mid Dec date I must question .
To add to this I will bring up from the previous thread my comments to Peter g about Steve puetz.
My question was: where does the market stand 20-25 trading days before the solar eclipse ?
I then explained why I thought Jan15-18 th is going to matter .( I am admitting I screwed up getting short here
So don’t think I’m back peddling )
Feb 15 is the solar eclipse ( if my memory is correct ) now count 20 to 25 trade days .
Not considering holidays , it Jan 11 th to Jan 18 th . Including the Venus conjunct
I can back up to Jan 9 2018.
Bottom line : my turns have worked yet not to any degrees I’d call a success .
I relied on my memory vs double checking my work. That alone was a huge mistake .
There are a few other dates which go past that January window yet honestly any further
Highs past March 17 th puts a serious question mark in my work .
That Jan window to me is more or less my time window that is most important .
Jan 9 to Jan 18 th matters to me big time .
Holding short yet accepting I most likely made a mistake and I’ll deal with it
Before it becomes to painful .
Mercury goes direct Dec 23, and for now , like right now, I have no opinion .
Hi all!
I will share my turndates (for AEX = Europe) one more time. A few weeks ago I did the same (but am more sure now about dates being a top or a bottom) so here we go again:
27-28 dec HIGH
14-18 jan LOW
Capital letters because I see them as an important top and bottom (cycle low 144 cd).
I trade the AEX (Dutch stock exchange) with weekly options using a signalsystem which I was granted by Gods wisdom since I am not smart enough and needed some help! I am expecting 563-565 per end of december turndate, my best guess…
Good luck all, may God bless you and keep you!
Cheers,
W
Luri,
Referring back to the chart you posted of the monthly S&P for the last 30 years…
The anchors for the trend line seemed to be the 1987 low…the 2002 low…the
2015 high. The underbelly of that trend line is now being challenged…What is that precise price level?
I think you said it was someone else’s chart (ha) but is possible to identify that level. My charting software does not allow me to do that. I appreciate your efforts to post helpful information and charts.
Joe, I don’t trust many of the market software packages that do log charts. I use Tradestation and its semi-log chart capabilities are horrible. For that reason, I calculate semi-log trendlines mathematically. The answer to your question is that the December 2017 value for the semi log chart October 1987 through October 2002 lows is 2768.33. That moves up to 2787.89 in Jan 2018. Those numbers are “fer sure” accurate…
I think I may have even better news for you, Joe. In looking more closely at the October ’87-October ’02 trendline on a log chart, it appeared that the March ’03 bottom went slightly below it. I checked with the math calculations and indeed it did. That means the two most external lows from 1987 were October ’87 and March ’03. Those are the lines that should be used for the calculation. Here are the answers using the March 2003 S&P low for the 2nd anchor of the log trendline. December 2017=2718.81, January 2018=2737.88. That would mean that yesterday’s high of 2694.44 was only 0.9% away from the bottom side of the 1987-2003 bottoms trendline on a semi-log chart!!
Peter G,
Thanks for doing the calculations! Very much appreciated!
My apologies, Ed and Joe, I responded below as if I were responding to Joe. It should have been a response to you, Ed. Nevertheless, the numbers remain the same!! 🙂
May I see your papers please !
First time I’ve heard of this yet it passed in 2005.
https://www.google.com/amp/s/www.elitedaily.com/p/do-you-need-a-passport-for-domestic-us-flights-surprisingly-yes-for-these-states-only-2929946/amp
10 times 64 weeks from 5/20/15 brings 8/25/2027; exactly 40 years after the 1987 high. The 1987-2007 range also points to 2027. And it is cardinal in the 9 month square of nine on 1932.
This date may look distant but we can use the square of nine to count back using -1.
And now we see 1/14/18 is at 0 degrees or conjunct this vibrational date. And 1/14 is 2 PI years from the 2011 low. And DJ made the high 1/14/2000.
I said it before; the real trend is already down. But 1/15 (1/14 is a Sunday) is a magnet.
From 1/15 we will be down into the vibrational 7/8/18 low.
First real low in this cycle is 2/22 before we are up into late march for a second – lower – top. Then down into the strong 5/2 low.
And this will all happen within the vibrational cycle that is down into august 2023.
Will 2027 be a low? we’ll see. But it will be a very vibrational date. Carolan predicts a 2036 high in his book. That is 90 degrees from the 2027 date in the 9 month on 1932. 100 years from 1932 points to 2032. In that case 2027 will be a high with 2032 low and 2036 high. Lots of time before that to do some more analysis.
Key : watch 1/14/18. This will bring a high and a very significant one. And then down into 2/22.
Found more strong dates. Will give them soon.
Very strong numerological timing 12/23-26. In 2015 the high came 12/29; same this year.
But January is pivotal.
André
Hi Peter
Interesting read on global cooling .
https://www.armstrongeconomics.com/world-news/climate/the-sun-is-cooling-faster-than-anyone-suspected/
A new take on an old post from months ago that I read somewhere else. But, thanks for sharing this!
Just grabbed 1000 shares of UVXY @ $9.85
1:00pm EST we should hear the tax bill has passed.
I believe this is a sell the news event.
Stop/Loss $9.35 target $11:85
https://worldcyclesinstitute.com/the-final-route-to-the-top/#comment-25521
After todays action in the AEX, it seems to me that 27/28 december has to be a low. I can’t rhyme it with a high at this point (breaking the upmoving bottom trendline plus closing gaps).
Also after finetuning a bit, 17/18 januari is the more exact date for the cycle low.
Cheers,
W
https://worldcyclesinstitute.com/the-final-route-to-the-top/comment-page-1/#comment-25496
PD-1 (SPX accelerations…terminations…changes-in-trend…think POWER)
PD-2 (SPX highs and lows…the following trading day likely closes with a change in polarity)
PD-3 (SPX minor highs and lows…the following trading day likely closes with a change in polarity)
12/28/2017 PD-2; PD-3; Berg Astro Indicator Day (level 7)
To soon to call this but it’s looking to me
Like utilities/interest rates have been taking
A hit since early Dec ( mars Uranus Dec 1 opposition )
Additionally I’m seeing many stocks making lower highs
Despite the index’s making higher highs .
This present weakness though I’m skeptical ( on index’s )
Mercury turns direct Dec 23 and mars Uranus turns
( should be a minor cycle low Dec 25 )
Jan 2 -3 I’m hoping to have a more clear picture .
Jan 9-18 th ideally is a swing high yet that could also be
An all-time high and possibly the peak .
The wave count I’m not sure of ( I don’t have much data to go on )
The wave count in my opinion should match the timing and
At the moment I am blind .
Selling out of eix though was a good thing a few months back.
Gold stocks ( hui ) coming into an interesting juncture yet
Again I’ll say I have limited data to go on .
It’s looking like leadership stocks are or have stalled .
Amazon , I’m hearing rumors that the deal with whole foods
Is not working out so well. ( quality of food in question )
Nothing to trade on just something to be aware of.
The Dow had its monthly closing high in Dec 1999 despite
The print high in Jan 2000. The spx and nasdaq peaked in March
2000 yet the nya had its print high in Sept 2000 , the spx back
Then made its closing high in Aug 2000. How long this market
Hold up from here I’m not sure yet the divergences should
At least continue which should lead to a drop.
Staying short at the moment yet not going to add to this
With out any confirmations .
There is no proof that a top is in place
From Andre’s post above .
We agree 🙂 it is a magnet
But 1/15 (1/14 is a Sunday) is a magnet.
This article about the Bering sea is 20 years old .
Just bringing it up because the same thing is happening
Again . In Jan 2000, ( a couple years after the bloom roughly )
The ice edge moved all the way to unimak pass which
Had not happened since around 1973-1974 .
Whether or not this proves to be some sort of 20 year cycle
I do not know but I find the correlation very interesting .
In early 2000 it led to a commodity boom .
We also had a commodity boom from the early 1970’s into
1980.
Odd correlation perhaps ?
https://earthobservatory.nasa.gov/Features/Coccoliths/
Expecting yesterday to be the swing low and head up into Dec. 26.
I agree Liz, after that down till Jan 5.
Good luck.
Hi Dan,
Can you explaine januari 2017 in combination with the wave four.
The ending diagional – Bear Market – We peak at the moment. (wave four)
Is there any relation with time? If 3= januari 2017 and 4 is now, wath wil be the indiction of the date of I,II,III,IV and V=5 be?
Willem
Sweet Lake City
Holland
Saturn into Capricorn & Conjunct Sun yesterday = end of a 353 year cycle starting in 1664. Where is that Greenland Ice Core temperature chart so I can correlate the data? It’s gonna get cold.
https://astrologyforganntraders.wordpress.com/2017/12/22/solstice-21st-december-2017/
Thanks for the link. Olga is certainly one of the best. A lot of my own research correlates with hers. Her earthquake indicator seems to peak on days I have as well. She has 12/22, but I also have 12/26 & 12/29, specific to Sumatra (with Japan as a second guess). I have 1/13, she has 1/14. Narrowing down location. The planets fall on the 3/11/2011 Pentagram, but it is a few degrees off from original position. She also 1/8, I think.
I have an serious alignment in March for NYSE, have to go through her stuff and see if she has it in there.
I derive my data from 144° harmonics & past occurrences of the alignments in the same locations, not sure how she does it, but if we used separate methods and came to the same conclusions, that would be pretty amazing.
I wanted Peter’s chart to see what the temp trend & change was 353 years ago. I know he had it in a previous post somewhere.
Anyone,
Any thoughts on this Bitcoin sell off? Any extrapolations to the stock markets around the world?
Arch Crawford thought that December 2-4th could be a top in Bitcoin. That is looking pretty good.
Joe, you have mentioned Arch Crawford and Merriman a couple of times in posts you made!
Go to last weeks thread. I had the top date for Bitcoin at 12/18, then modified it (not sure if I updated it there) to in between 12/17 & 12/18 based on the Mars Uranus cycle. It’s been moving in 15° Mars/Uranus bursts up, then 3° pullbacks, then couple it together for a 36° movement. Two 36° movements = 72° which goes from one point of the pentagram to another.
IF (and that’s a big if) the cycle remains the same a 3° pullback from the top puts the next pivot point on Christmas Eve. The end of the next burst would then be around 1/29/2018, and we have a heliocentric Mars Uranus opposition at that time.
Should mention, if it doesn’t pivot up on 12/24, then 15° M/U from the top takes us to 1/20/2018, where I’d expect a 3° turn up, ending on the same 1/29/2018 date. I’m not trading it, just watching & testing theories. So far, the tops have been correct over 80% of the time. Nailing the pivot lows has been off. Unfortunately, we don’t have 84 years of data to back-test this. End of January will give me a better idea if the cycle is valid.
if you are so inclined, send me a DM in the ‘ WCI forum’ with your email address
Trying to figure out how. Can’t find you as a member there.
I can send it, if you like.
Phillippe Allerotrot
You should have it.
Pete
Any chance of sending out what you think of the Bitcoin chart. Looks like a road map of what will happen to the whole market
Red Dog,
Great minds. I was looking at a chart today. I may be able to do something this weekend. The issue I have is that I’d like to be able to measure the waves fibonacci-style and I don’t have a way to do that … so far.
Yeah, it’s starting to parallel the market. We look to be in a fourth wave of some type.
Peter, you can use tradingview.
https://imgur.com/sj2fpzl
Cool. Tks. That looks like a very scary fourth wave. One more wave to go, then.
this tweet was brought to my attention…not an endorsement…
https://twitter.com/robertreidmd/status/944208162630000641
Notice he said 2017. Perhaps the difference is the year 2017, the year of the Fire Rooster. On Feb. 16, when the year switches to the Year of the Earth Dog, perhaps things will take a turn, slowly or fast doesn’t matter. Equities, fake currencies floating near the sun will crash back down to earth to more realistic valuations. The tango dance worked for a few times after BTC December 2013 high, until people realized the music has stopped playing. In the midst of a silent, near-empty party room, HODL crypto fans calm the panicked bag holders claiming it’s going to $1M one day. The bag holders, uplifted, walk out the room with a renewed sense of hope. They preach the crypto gospel to ducklings freshly hatched. The ducklings, tempted by the idea of easy money, buy in and a new cycle begins. . Lather, rinse, repeat…
Until a few finally say this emperor wears no clothes after all. The bubble bursts.
Mini crash cycle showing up in bitcoin , it runs into Jan 2-3
Also mercury retro turns direct Dec 23 and mars Uranus
Calls for a low Dec 25 then up into Jan 2 .
Just pointing out the cycle is working just not so obvious
When looking at the dow .
Jan 9-11 next cycle high yet I have to give it Jan 9-18th
Nice to see at least a stall in the dow .
Holding short still yet ……… Still no proof a top is in
Have a great Christmas everyone!
Thanks, Tom, and thanks for all your comments and charts! Happy holidays!
A new blog post is live at: https://worldcyclesinstitute.com/options-at-the-top/
This website is for educational purposes relating to Elliott Wave, natural cycles, and the Quantum Revolution (Great Awakening). I welcome questions or comments about any of these subjects. Due to a heavy schedule, I may not have the time to answer questions that relate to my area of expertise.
I reserve the right to remove any comment that is deemed negative, is unhelpful, or off-topic. Such comments may be removed.
Want to comment? You need to be logged in to comment. You can register here.