
 The End of a B Wave Era
The Last Waltz was a concert held on November,1976 in San Francisco that resulted in a movie by the same name, produced by Martin Scorsese, released in 1978.
It was the Band’s final concert and marked the end of an era – the Golden Age of music of the ’60s and ’70s. It was at the bottom of a fourth wave (the bullish third wave had topped in the early 70s (the top spike in the solar maximum of the time (1969) coincided with the original Woodstock Festival which I attended in August of that year.
The picture shows the group at their height: Richard Manuel, Garth Hudson, Levon Helm, Robbie Robertson and Rick Danko. The Band was a Canadian-American group and came together under Ronnie Hawkins in Toronto Ontario, in the late ’50/early 60s. I saw Hawkins live, but it was not until the early 70s, well after the Band had left him and were extremely popular on their own.
We’re in another third/fourth wave combination right now. The NYSE is in a fourth wave, while the SP500 is at the top of the third wave — a major non-confirmation that’s a very bearish situation. The Last Waltz reference to the current market is the fact that we’re in the final wave of this 5 month long B wave.
This week, I made no bones about the fact that the waves down mid-week were corrective. I had been expecting a turn, but once we got it, NQ had still not made it to a new high. If you were in the Chart Show on Wednesday, you got the entire lowdown.
So … while the waves down looked corrective, NQ sealed the deal, because the structure there was definitely corrective.
We’re still waiting for a top and while this is the final wave up (it’s a small 5th wave in the SP500), the waves up are all corrective. As well, the corrective structure of the pattern in ES requires a zigzag, so we may not get a new high and turn right way.
I called for a turn late Friday (which we got) and a continuation down over the entirety of next week. I’m also expecting a wave down, very much as depicted here, but was hoping for an earlier resolution to the upside. In either case, this is a good indication of what to expect (it’s the timing I’m not sure of). The wave down depicted here is clearly corrective, as it the final one to the top.
The market is moving as one. DAX has retraced 62% and is sitting, waiting for a turn.
Gold and silver are turning up — not sure how they will correlate with the expected high in the US indices.
WTI Oil looks to be in a corrective wave down and if so, would require a new high. If this is the case, it would likely take more than a day or two to get there.
Currency pairs (including the dollar) are in a corrective retrace.
It’s the Last Waltz for the B wave in the US indices, folks. I’m expecting a fabulous short opportunity within a week or so at the outside..
_______________________________
Elliott Wave Basics
Here is a page dedicated to a relatively basic description of the Elliott Wave Principle. You’ll also find a link to the book by Bob Prechter and A. J. Frost.
____________________________
Registration for Commenting
Want to comment? You need to be logged in to comment. You can register here.
If you register, it protects your information. It also allows you to comment without filling in your information each time. Once you’re registered, simply go to the home page and click on the login link top right in order to log yourself in. Usually, you’ll be logged in for several days before needing to be logged in again.
______________________________
Problem receiving blog comment emails? Try whitelisting the address. More info.
______________________________
Couldn’t be happier … KK 2
Couldn’t be happier …The analysis and insight you provide is simply amazing! I’ve been trading the futures and equity markets for well over thirty years and usually average around 5% monthly. Since joining your Traders Gold Service two months ago, that number has better than doubled. I couldn’t be happier.—KK |
Get an upper hand … JC 2
Get an upper hand in trading …Seeing all the different currency pairs and the wave structures and hearing you explain why this has to do that on a nightly bases gives one a upper hand when trading. Elliott Wave applies to all stock and indices and can be applied to any candlestick chart. If someone ask what you want for Christmas – Tell them a membership to Peter’s “Traders Gold!”—JC |
the real deal SM 2
The real deal …‘Educational, insightful and thorough market analysis for all levels of traders. It’s Elliott Wave at its best….Peter Temple is the real deal’ —SM |
Rise above the rest … SM 2
Rise above the rest …I have only ever met a few people who, in their chosen fields (astrology, medicine, music, martial arts, technical analysis), rise above all the rest and you are one of them…you have ‘the gift’…and that’s why I’m a Trader’s Gold member. —SM |
Have not had a losing week RW 2
Have not had a losing week …I have been with Peter almost a year. The only thing that matters is have I made money with his service. I think I have finally turned the corner using Peter’s EW. I have not had a losing week in the last 5 months. Thanks Peter, for your amazing amount of hard work. —RW |
Tops in your field DZ 2
Tops in your field …You are tops in your field. Tried to follow Elliot Wave international for years. They were always behind the market. After discovering you, I perceive that you are an expert in reading the waves, which puts you way ahead of the rest of your peers. And you can read the Waves like you are reading tomorrow’s financial section. I pray you stay healthy. —DZ |
The best of them JL 2
The best of them …Last couple of years, I subscribed to several ‘market traders’. You are by far the best of them and the personal contact is awesome. Daily and daily updates are very well written! Besides your expertise in EW, I also like your cycles analysis. Best investment I ever made! —JL |
A true expert in Elliott Wave FL 2
A true expert in Elliott Wave …You are a true expert in EW analysis. What you provide is not available anywhere and is priceless. Subscription on your services is the best thing I have ever done. Many thanks for your effort to make me a better investor. I now have more trust in my investment decisions. I hope you will continue the excellent work! —FL |
US Market Snapshot (based on end-of-week wave structure)
This chart is posted to provide a prediction of future market direction. DO NOT trade based upon the information presented here (certainly NOT from a daily chart).
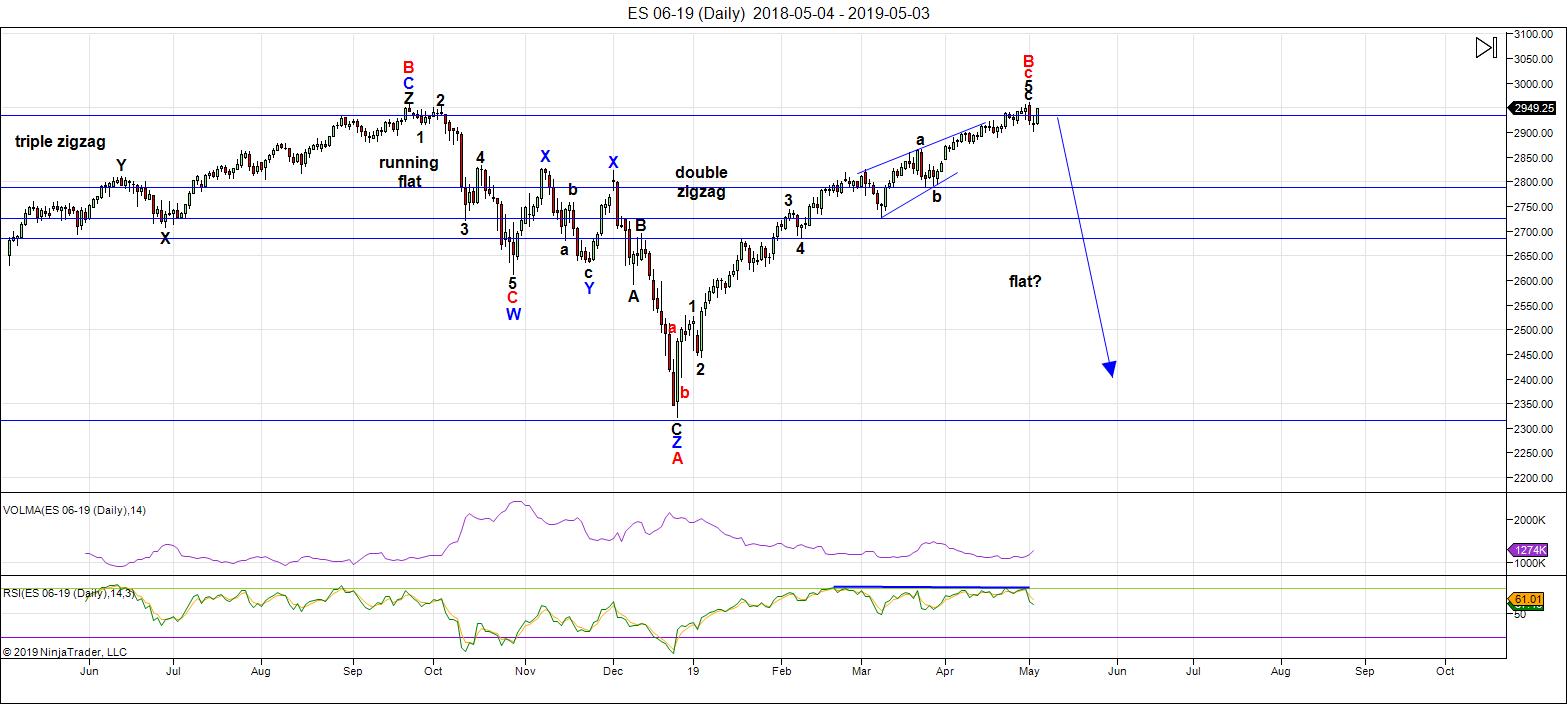
Above is the daily chart of ES (click to enlarge, as with any of my charts).
We've been sitting at the top now for about a month. As my Trader's Gold folks know, we've been in an expanding triangle for three weeks (this is an ending pattern).
If you were in Wednesday's Chart Show, you know that I called the weakness on Wednesday a corrective wave, which requires another high. Almost all the other assets I cover on a daily basis are hovering near inflection points.
We're at a new high for ES and this technically keeps us at the top of the third wave; however, NYSE is in a fourth wave, so this is a major non-confirmation and is extremely bearish.
As I've been saying over and over like a broken record, all major asset classes are moving as one. That requires them all to reach new B wave highs before they can turn down together. It's been like herding cats and has taken much longer than expected.
IWM (Russell 2000) reached the new high that I have been calling for and sits this weekend at the top of the expanding triangle I identified weeks ago. All these indices are showing signs of exhaustion, with gaps that are being left unfilled.
The next major move is to the downside.
The wave up from Dec. 26 is clearly corrective and, as a result, must fully retrace to the downside. This is supported by the US Dollar Index, the major USD currency pairs, WTI Oil, along with DAX, TSX, and other international exchanges.
Summary: My preference is for a dramatic drop in a 4th wave to a new low. The culmination of this drop should mark the bottom of a large fourth wave in progress in the NYSE since January 29, 2018 - over a full year of Hell. It may be a dramatic drop that is quite fast; in any case, it will target the previous fourth wave area somewhere under 2100.
Once we've completed the fourth wave down, we'll have a long climb to a final new high in a fifth wave.
___________________________
Trader's Gold Subscribers get a comprehensive view of the market, including hourly (and even smaller timeframes, when appropriate) on a daily basis. They also receive updates through the comments area. I provide only the daily timeframe for the free blog, as a "snapshot" of where the market currently trades and the next move on a weekly basis.
______________________________________
Sign up for: The Chart Show
Next Date: Wednesday, May 15 at 5:00 pm EST (US market time)

The Chart Show is a one hour webinar in which Peter Temple provides the Elliott Wave analysis in real time for the US market, gold, silver, oil, major USD currency pairs, and more. You won't find a more accurate or comprehensive market prediction anywhere for this price.
Get caught up on the market from an Elliott Wave perspective. There’ll be a Q&A session during and at the end of the webinar and the possibility (depending on time) of taking requests.
For more information and to sign up, click here.
| "I think you are the only Elliot Wave technician on the planet who knows what he's doing.” |
| m.d. (professional trader) |
All registrants will receive the video playback of the webinar, so even if you miss it, you’ll be sent the full video replay within about an hour of its conclusion.


Island reversal intact on SVXY.
Have a great evening all!
Wow, been busy till now and see the market precisely followed your chart! It must be hard for you to hide gains this much. But imagine some people in other parts of the world need to hide from multiple wives 😉
Holy Mashed Potatoes!
Looks like the BTF dippers just got whacked!! 🙂 🙂 🙂
Sorry for opinions without a plan, but this is a mess. Can’t imagine VIX going back to 11 with this chop. I have indicators I depend on (as y’all do) but this mess says one thing to me… stay small, don’t be a hero. Saw an 18k gain turn into 10k (maybe a few more now), but we cannot beat ourselves up over this. Divergent chop like this will dub with any good plan. Market looks better for VIX/inverse up vs “market” up but I will use after market to square more positions… and trade around the remaining positions VERY short term day moves. Good luck y’all.
Absolutely Mojo!
This is a scalper’s market…!
Betcha Verne! 😉
baltic dry looks like ready for another turn down too..adding more fuel hopefully that Turning Point is soon
Hi Peter and friends
energy chart update below
https://imgshare.io/image/may-6th-18th-energy-chart.NYPEu
next week is looking like a barn burner
This link below is just for you Peter
https://www.youtube.com/watch?v=orCiC9-p7yE
Thank you Tom. I don’t like holding a position over the weekend, which cost me dearly today. I’ll make sure to go short before the Friday close.
haha … brings back memories … 🙂
I stuck to my plan .
Tom
It was a difficult decision to stick to my plan
Yet your post earlier told to be patient.
Mojo
I’m in agreement with you
My plan noted in the prior thread .
By the way note today’s close was below the key
Resistance I noted in my plan .
Thank you Peter T for everything
Safely hedged with a slight margin of profit worked in .
🙂
Old post :
I’ll plan on using the cash Dow at or near 26448.89
As key resistance .Friday’s close at 26504 is above that level .
Next higher level is 27216 but I’m doubting it .
So 26585.62 needs to hold then a drop back below 26448.89
And that 26448.89 should be taken out with an acceleration move
Down or I’d say something is wrong .
Clear A B C down in place ( A ) with now being ( B ) the high .
might end up being a Sunday futures trade in the overnight market
If this market is going to gap down Monday .
For me this is a hedging stradegy only at this point .
All I have to say .
Enjoy the weekend
My downside still stands at cash Dow 25412
Lower prices if taken out yet that’s my initial target
To cover at .
http://schrts.co/NizQCwvs Ignore some of the notes they could be old but this is how I see the support going down on the Dow…hope it helps anyone..
Looks like they are not quite ready to surrender 2900.
Ringing the register at the open!
BTW, I am of the opinion that the failure of 2900 is not a matter of “IF”, just “WHEN”.
The key is that price above 2900 offers the opportunity to acquire even more cheap puts and scalp the trading range whipsaw.
A close below 2900 means it’s time to back up the 18-wheeler! 🙂
Hi Tom C. and friends 🙂
watch http://www.prognoseus500.nl/
I have the huge decline for this week into the 14th.
It is also possible into the 17th.
My Old indicator gives a decline from 27th into the 17th.
21 September 2018 (3 Oktober 2018) and Christmas 2018 was OK and now it seems to be OK again.
Trade what you see and use this information only for confirmation.
Also wanted to mention.. nice catch Peter on Twitter…from one of your previous chart shows! Thanx
Hmmm. Don’t understand. What’s that about?
I keep covering 50% of my short in 2900 – 2910 range and then re-shorting on a bounce. One of these days, I will be left with way too small a position when we decisively break below 2890-2900 zone.
Free money! 🙂
Who says you cannot make money trading a sideways market?!
Not if you compound your profits! 🙂
That is true – my cost basis on the short keeps moving higher (though at a small pace). Now its up at 2870. Still in the red, but not that far off anymore.
Verne – I started using credit spreads on SPY as a trade (very small to test). Not bad at all. I have been a believer of using outright longs and shorts. However, like the idea of adding exposure with limited upside and downside.
Awesome!
It was one of the best things I ever learned when I was trading with Ken Trester. It is really surprising how few traders use them considering how remarkably easy and efficient they are. I think most folk think they are very complicated but they are not really! 🙂
Looks like a bull flag under development in VIX.
If correct, we have a beautiful pole target of at least 25!
Darn wish i had bought that vxx ytda…oh well..
Didn’t I tell you they would pay you? ☺
Peter maybe I’m confused…I thought a couple of chart shows ago you said it had a good bounce up coming up..and it did..and was a nice one..
Sorry, it was the Twitter reference that I didn’t understand. Otherwise, it’s all working out as planned in the last Chart Show.
maybe..I dreamt it ;)…
2900 in play pre-market… a break there and….!
“Farewell and Adieu, to you Spanish ladies!” 😉
Ringing the register on 289 puts.
Not sure if they will defend 2900….😛
Nice wip-saw yesterday into open. Took off QLD hedge to VXX and TVIX positions pre-open after adding to VXX after close yesterday. I know this isn’t EW but did that because VOL in general looked like cup and handle (bottom of handle overnite). Unloaded 2/3 of VOL few minutes ago. Holding rest of VOL to see what plays out. Off to appts. Great trading y’all!
this more detailed energy chart will explain todays movement
https://ibb.co/7z3cy05
the blue line chart is a long term chart that lacks daily movement detail
but shows a more general picture
I’ve mentioned this before
May 7th lunch time energy chart update
https://ibb.co/kg5c0Xr
Hi Tom. The link is not working. Can you post again please?
Sorry, it does work. Thanks!
Based on my theory of bankster leveraged buying, which so far as I know has never seen suggested anywhere, either they make a furious effort to reclaim the 2900 shelf or they MUST capitulate to the downside momentum, in which case the leverage that catapulted us past the 2800 support/resistance shelf must also be unwound. In plain English, if they cannot re-capture 2900.00, the WILL surrender 2800.00. Let’s see if the theory holds water, or I am doing you-know-what in the wind! 🙂
Since I’m not convinced which marhmatical relationships
To run .
I ran them all based on a typical mini crash scenario
These are not necessarily in order .
Cash Dow
Block 1 targets
25855.15
25555.07
25039.47
——————-
Block 2
25405.14
25019.85
24357.84
——————
Block 3
26065.36
25840.90. <—–keep an eye on this level if touched ( might become a pivot )
24357.84 < —–:potential extreme
Block 4
25711.35
25415.10 <——– ( another pivot and my initial downside calculation 25412 )
24906.07 < ——- ( an extreme and I'd go long if timing lines up ) big if ..
Averages of blocks 1-4
25759.26 ——- a minimum
25457.73———— becomes a pivot
24939.65 —-:is an extreme .
May 22- June 3 is when these levels will matter to me .
If price levels get hit prior to time cycles then I'll lighten up
And look lower .
The mid points ALWAYS become the pivot .
The lower levels if taken out call for a complete 're calculation and imply
Much Mich lower levels ( yet they rarily if ever get blown out with out a huge bounce )
Time is going to matter .
Fibonacci time should begin to show up yet I have not run that .
Today being may 7 and respecting Tom's as well as Peters work
I must still stick with my own .
WHERE are all those genious bulls today ?
By the way I am bullish come may 22-June 3
This is what I consider the defining moment
This pullback will or won't change my mind as to the higher highs I see
Coming into mid August .
Going below 24906.07 would cause me concern
Sticking to my plan
Enjoy the rest of the week everyone
Block 3 correction
Extreme 25455.22 ( not the 24357 )
Everything else is correct .
thanks tom for the energy posts..appreciated
thank you joe
Yipee!
FINALLY, nicely back in the green on my massive long vol trade.
Let’s get this party started!! 🙂
VIX bull flag target 25.00….
More volatility bull flags a’forming…we could be just getting underway…! 🙂
Yes indeed, what I was calling the cup n handle. Sold all VOL as rounding top at noon, then as pulled back bot SOXS for a ride. Up 20% in 2 days with most on sideline so I will watch and nibble… hopefully nimble 🙂
What a ride… now what Verne HaHa!
Hehe!
Charles Nenner is telling his subscribers to ring the register on their long vol trades.
He does not know how this beast operates! 🙂
Hopefully Peter T will give us the lowdown at the Chart Show tomorrow.
According to his long stated downside targets this party is just getting started! 🙂
Well looky here!
The dumb VIX short sellers are once again jumping the gun and piling in short.
You’ve got to be kidding! hehe! 🙂
Tech friends noting QQQ, XLK and 2 FAAMG stocks FB & GOOGL below trendline, watching for confirm on AAPL, AMZN MSFT. They are on/ through lines but… conviction?
also..armstrongs number on the dow was 25815.47..if book no longer possible consolidation..which we hit…which could also confirm
I think the only thing bothering me is I feel oil should have dropped more too
book..took
Shooting star on vol instruments.
Now for the pause that refreshes.
Ringing the register ahead of a reload on coming bounce! 🙂
Boo-Yah! 🙂
It’s a beautiful day, in the neighborhood…!
Have a great evening all…! 🙂
Beauty! 🙂
lol…have a great night..
May 7th evening energy chart update
https://imgshare.io/image/may-6th-10th-energy-chart-sw.NgJ9d
Thank you Tom. Have good night!
Hi Peter and friends
last week’s the energy chart had no inversions
but it was severely time shifted by a 1/2 day
and I believe the same thing is happening this week
I’ve adjusted the blue line energy chart by a 1/2 day
and it looks real good, see link below
https://imgshare.io/image/may-6th-10th-energy-chart-sw.NgeQf
Yep! I expect the breached 2900 -2920 former support shelf to prove formidable resistance to any bounce the next day or two and the chart seems to confirm this.
It is beyond stunning how almost without exception ( I know of only one besides Peter who sees the waves up as corrective), EW counts everywhere are impulsive off the December lows. Traders following these counts are beside themselves with bullish glee and salivating at the prospect of new ATHs just around the corner. Some have even boasted about already cashing in short trades and going long based on these EW counts that have this decline just about done. Others are gloating about shorting volatility ( I saw that!) Ooops! 😎
Thanks Tom.
You have indicated, and I think I have observed, that the success rate really goes up once you’ve done the time shift, right?
Hi Skip
I’ve been doing this long enough to know that
time shifts are real
hard to catch early
but I do my best
Tom,
Your time shifted chart does not bode well for the Uber IPO. $90 billion of new stock is a helluva lot to shove onto the market with these headwinds. MS might not be able to stabilize very much for very long. And if Uber sinks in a failed IPO, many will take that as a sign to bail. I have to think MS, GS are short going into next week.
Hi Jack
I just post energy charts
energy charts are not the markets
the markets will do it’s thing
the energy that hits our planet will do it’s thing
most days they move together
some days they diverge
I have no control over that
if you have a more accurate guide to market movement
you should stick to what works for you
this is not for everybody
Tom
One other important thing a lot of otherwise experienced traders are not considering is the possibility of the persistence of bearish extremes, as we have just witnessed a persistence of bullish extremes. This move off the December lows ocurred without a single meaningful correction and went on for over four months.
How long have we been seeing extreme overbought conditions in this market, accompanied by a plethora of negative momentum divergences even as price marched ever higher? And then there there is once again a historic shorting of volatility exceeding the insanity of early 2018. But….but…indices are trading near or below their lower B bands they protest, AND VIX has even traded ABOVE its upper B band, some would knowingly observe.
These folk are about to learn a thing or two about the persistence of technical extremes. Funny. They have short memories, as they just witnessed the same to the upside! Talk about herding!
What is good for the bull, is certainly good for the bear!
Carry on! 😎
Damn ! The bounce happened while I was sleeping. It is starting to look like a waterfall decline. The door is now wide open – Mr Market has to just walk through. We are yet to have the real “panic day” of this decline.
Mr. Temple,
Thank you for sticking to your guns and working with Elliott Wave as a science. Your personality shows that you desire to be accurate in what you do. That, your experience, and your desire to share this Theory with the world gives me confidence that your approach to this technique is the correct one. Again, thank you, and God bless.
PS. If people had continued to this with planetary cycles for thousands of years we would be way ahead there, too. I appreciate and understand your other research there, too. Venus’ time cycle is 1.6 times the Earth’s after all, etc.
Yeh, the BB and “no panic yet” are great observations. Hard part for me is how it plays out with EW. Short term indicators (SMA) have gone negative (mainly for DJIA) but no intermediate yet. That should bring the panic, but may need a rebound off B bands first which could give us EW wave that tests SMAs. This could all go one way or another based on China thing, so I am staying small right now but will sell any rebound (or buy VOL). Let’s be careful out there.
Peter T… any preview for the Chart Show? 😉 See you tonight. Cheers!
Better arrive early…gonna be a crowded house! ☺
We will get 1.5% moves on SPX just on the back of tweets over the next few days. Trading it around, but from the short side only. As of now, it’s been a very small decline. Drawing channels on SPX Index (not the futures), yesterday we tested the lower line of a parallel upward channel. Wedges have been broken already. Now we need a break of yesterday’s intraday low to get more comfortable on the bearish side. Even for the bulls, a move to 2700 would be a 38% retrace – something that is very normal in bull markets !
Thanx for the energy chart! good luck today..!
Verne – question for you. Is there a way to cash settle spread trades in case I take them into expiry and SPY ends up being in between the two strikes ?
Several options.
You can close the entire spread by buying it back if a credit spread, or selling if it was a debit spread.
You can close either the short, or the long leg of the spread.
Obviously if either the short or long leg you hold through expiration, then the call will be execised and the put will be assigned, resulting in being long 100 shares for each call option, or 100 shares short for each put option.
Always better to exit spreads prior to expiration unless it is part of a strategy to either take delivery of, or sell short actual shares.
If both legs of spread are in the money at expiration execution and assignment cancel each other as you end up buying and selling the same number of shares with corresponding losses or gains depending on spread width.
I forgot to add above “are in the money at expiration”.
I’d go through all blocks yet will do that over the weekend
I’m still thinking 25412 yet time is key in my work
I really need hourly data at this point to fine tune price and pattern
Yet that is not available so sticking to basics
Block 3
26065.36 < ——now resistance and the Key Level
25840.90. <—–keep an eye on this level if touched ( now a pivot )
25455.22 < —–:potential extreme ( corrected as posted above )
Averages still stand
Averages of blocks 1-4 ( keep in mind these are averages )
25759.26 ——- a minimum
25457.73———— becomes a pivot
24939.65 —-:is an extreme .
Block 1 targets
25855.15 < ——–it's been tested
25555.07 <—–next spot to keep an eye on ( may become a pivot )
25039.47 < —– not sure we see this level.
One leg at a time and each block works together
This website is for educational purposes relating to Elliott Wave, natural cycles, and the Quantum Revolution (Great Awakening). I welcome questions or comments about any of these subjects. Due to a heavy schedule, I may not have the time to answer questions that relate to my area of expertise.
I reserve the right to remove any comment that is deemed negative, is unhelpful, or off-topic. Such comments may be removed.
Want to comment? You need to be logged in to comment. You can register here.