
The cycles of history point to so many similarities in climate, health, societal change, and religion, among other characteristics of our experience on this planet. One of them that’s striking is the appearance of prophets at two of these cycle highs.
A major cycle is the 172 year cycle that I’ve written about many times before. Dr. Raymond Wheeler identified the 170 year cycle in his work and in a simplified cycle clock, The Drought Clock. Stephen Puetz mathematically adjusted the cycle to 172 years in his ground-breaking book, The Unified Cycle Theory. While this cycle peak marks an economic high and subsequent crash, it’s also parallels the Uranus-Neptune conjunction of 171.4 years. The turns are supported by events throughout history within mathematical probabilities that make their reality indisputable.
In fact, for the last three conjunctions, we experienced a major market sell-off fourteen years after the conjunctive event.
Uranus Neptune Conjunctions
| Conjunction | +14 yrs. | Event |
|---|---|---|
| 1650 | 1663 | the largest depression in England—1663, followed by Blubonic Plague (1664) and Fire of London (1665) |
| 1821 | 1835 | start of the largest depression in US history to that date (The panic of 1937 was the crash) |
| 1993 | 2007 | the Great Recession—central banks have managed to keep the market up through most of 2016 |
Major cycles are harmonic (X3) and both Puetz and Wheeler identified the 515 year cycle (171.4 X 3) as the civilization cycle. Two of the theoretical peaks were the years 118 AD and 633 AD. Each of these dates marked the appearance of prophets and the beginning, or resurgence of religions (Jesus and Muhammed).
The chart below (click to enlarge) is from the work of Dr. Wheeler and shows the temperature peaks of both eras and the relative events.
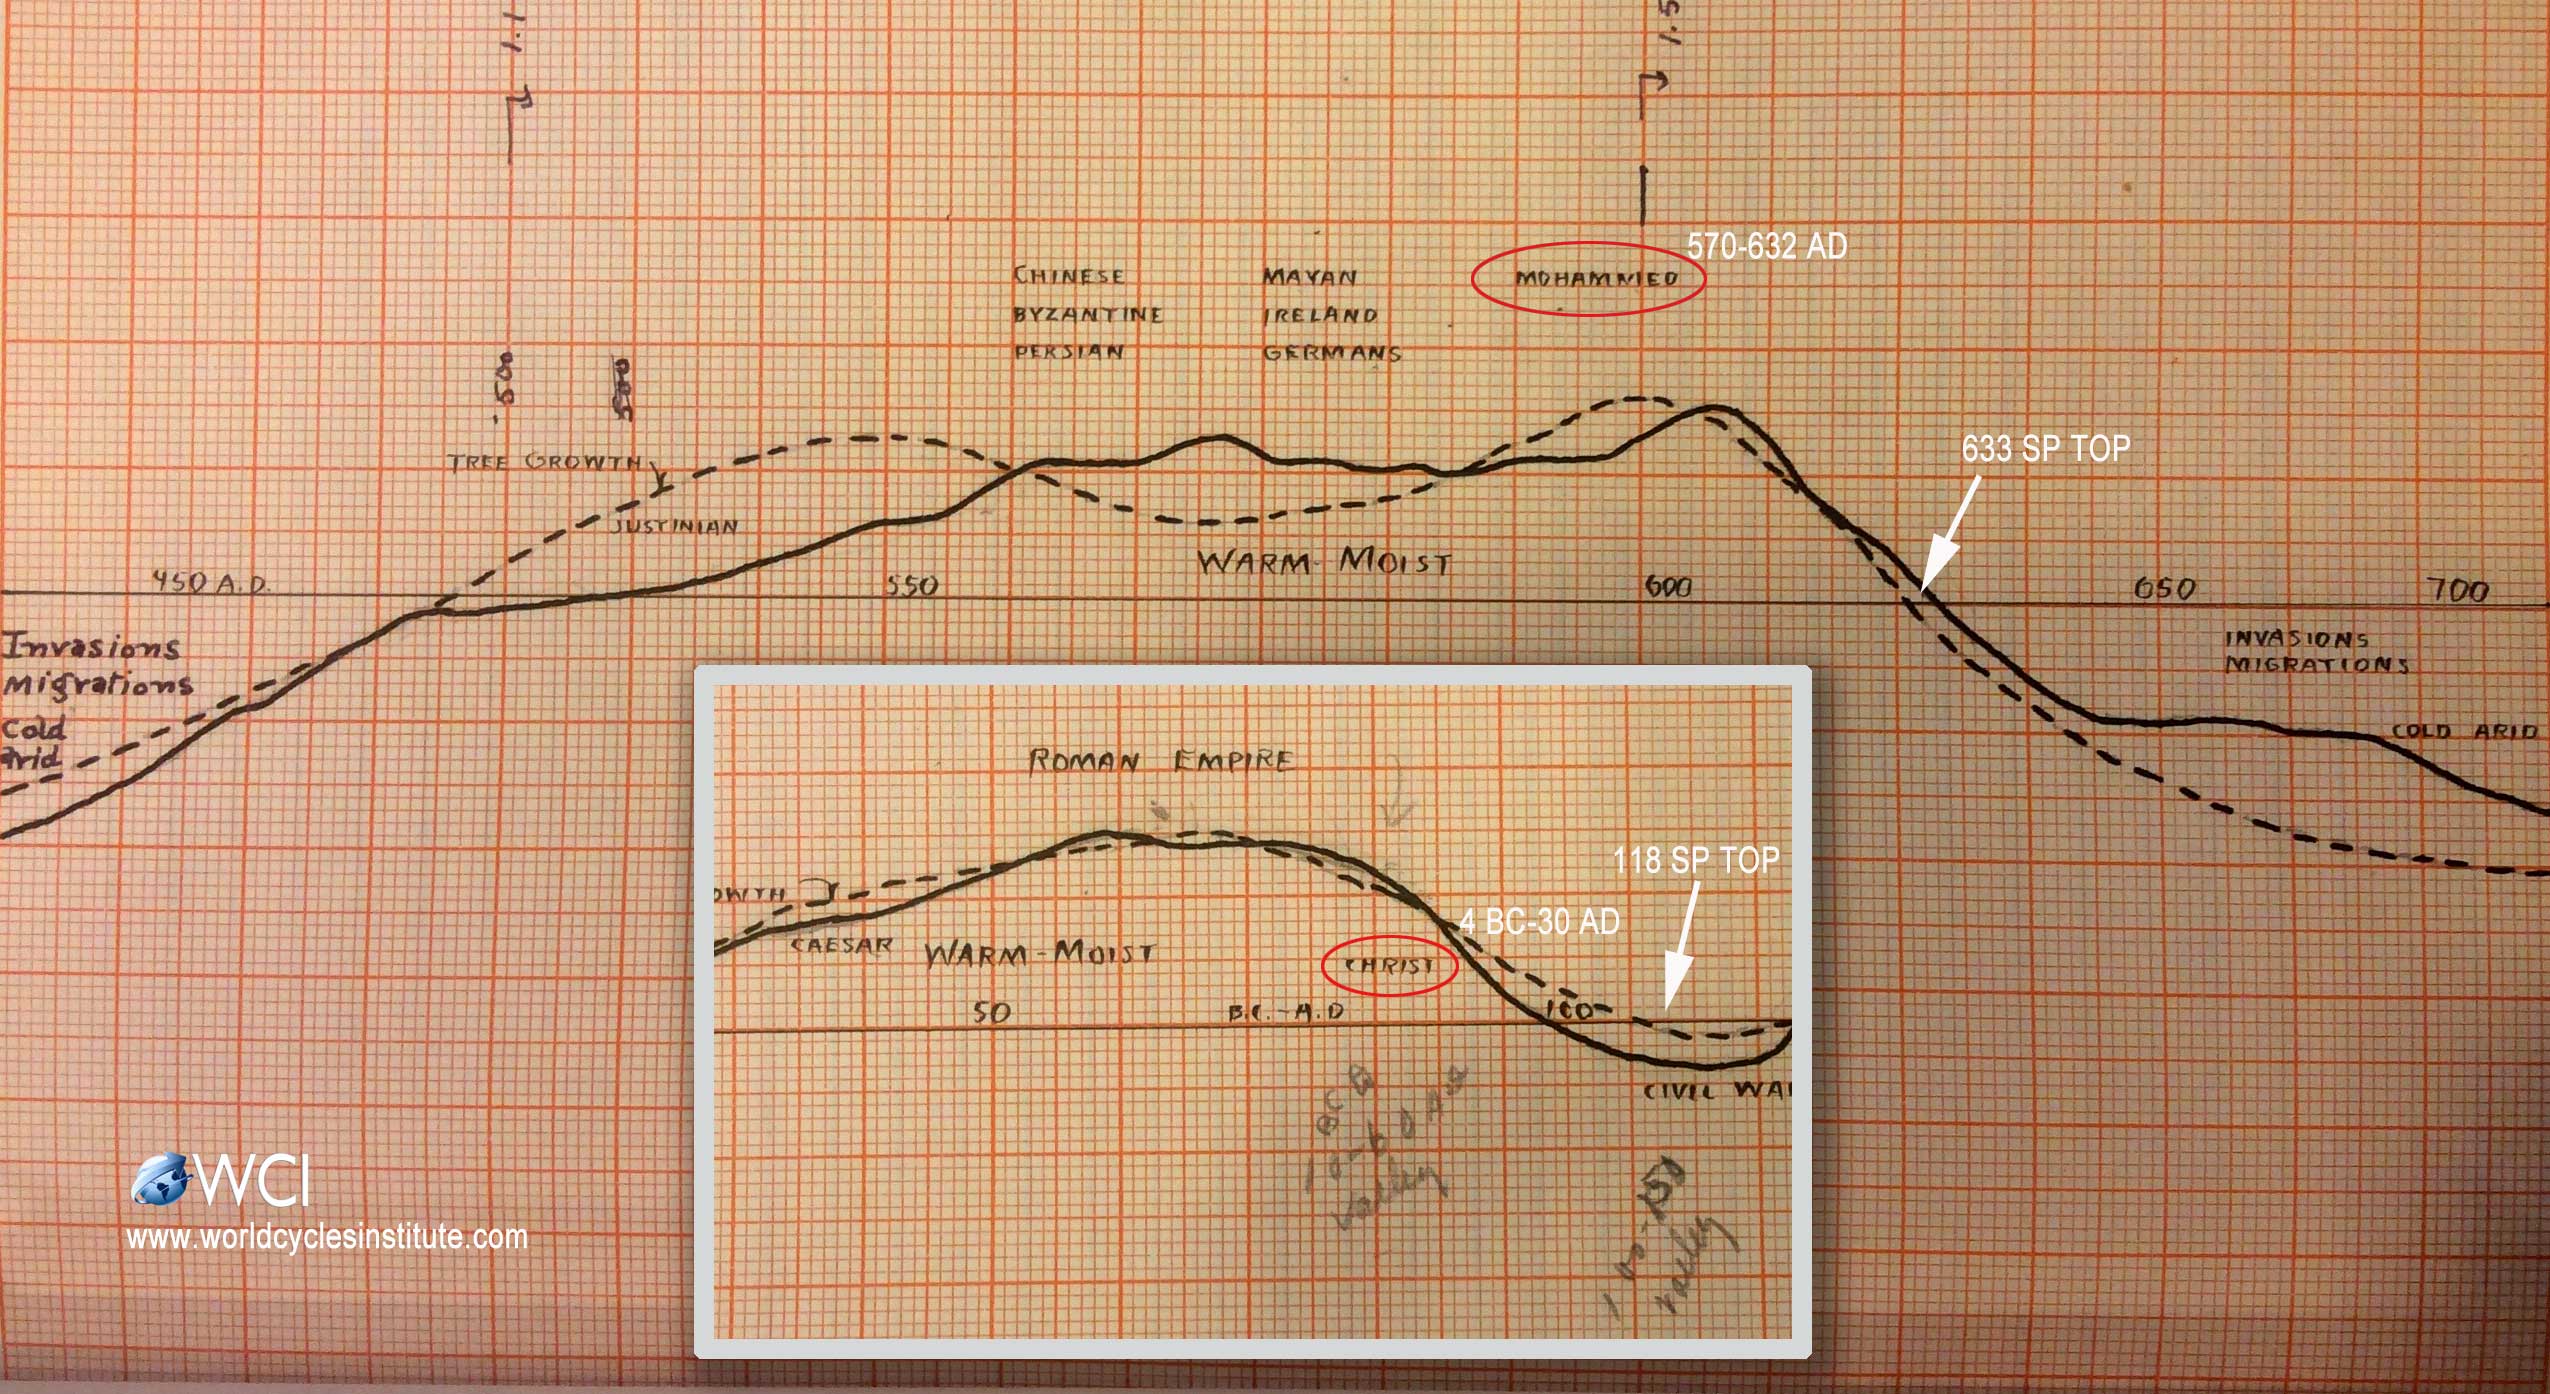
The larger chart covers the years ~430 – 720 AD, which was a major warm temperature top (the solid black line on both charts shows the relative temperature). You’ll find a “big picture climate chart” spanning 3000 years on the blog post entititled “Global Cooling.”
The inset denotes the height of the Roman Empire (the chart cover the years ~100 BC – 135 AD). I’ve written about this before in a post about the correlation of climate to the demise of the Empire.
Jesus and the end of the Roman Empire
The SP (Stephen Puetz “theoretical cycle top”) for the Roman Empire was 118 AD (the 515 year civilization peak cycle), which began the demise of the Roman Empire over a period of several hundred years. Jesus Christ was alive from 4 BC through 30 AD, just as the temperature cooled. He appeared, as did Muhammed, just before the cycle peak. As I’ve written before, this forecast civil wars, a period of social revolution, and political turmoil.
Muhammed and the Peak of the First Byzantium Empire
A similar pattern exerted itself at the cycle top of the 600 AD period (approximately 500 years later). After 395 AD, the Roman Empire split it two, the eastern half survived and historians refer to it as the Byzantine Empire. Under Justinian (527-565) the empire regained some strength. You can see on the larger chart that the temperature rose at that time (after decades of colder, dryer climate). Justinian grew the empire to include North Africa, Italy, Sicily, Sardinia and parts of Spain.
However, after the Stephen Puetz theoretical peak (633 AD), climate turned colder and dryer and this marked the start of the gradual upheaval of the empire. Only a year later, Byzantium started to lose a large portion of its territory to the Arabs. The Byzantium Empire was later revived in the next 515 year cycle, which peaked in the year 1148.
Similar to the top of the Roman Empire, which coincided with the theoretical peak and the coming of Christ, Muhammed (570-632 AD) appeared just before the theoretical top of this 515 year cycle. He is widely regarded as the founder of Islam by non-Muslims. He is known as the “Holy Prophet” to Muslims, almost all of whom consider him to be the last prophet sent by God to mankind to restore Islam.
However, within ten years of his death in 632, which also marked the cycle peak, Ridda Wars, or the Wars of Apostasy ” broke out, and the Rashidun Caliphate was established. The peak led to a period of intrigue and assassinations of its leaders and civil wars.
The 515 year cycle tops always herald in a demise of the current civilization, and a major social and religious upheaval. It also led to major migrations in both cases. Prophets also arose to prominence and led to a greater reliance of religion and religious teachings.
We’re also reaching the peak of a civilization cycle. The 172 cycle (and top of the climate cycle) was in 2007 (which was 14 years after the Uranus/Neptune conjunction). The peak of the civilization cycle in is 2178 (another 172 years cycle from 2007). Are we expecting a prophet to appear on the horizon? The timing is right and we certainly need one, based on the state of the world.
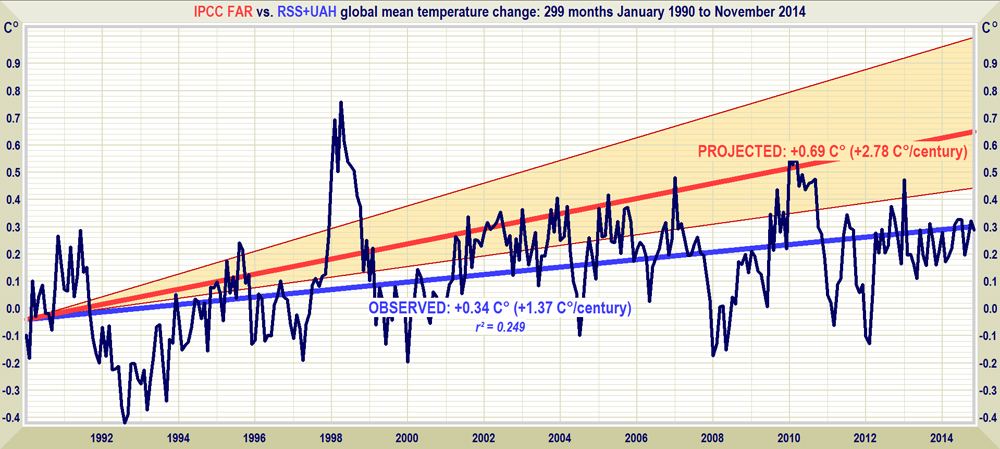
Above is a chart of recent temperature patterns over the past twenty-five years or so (produced by Christopher Monckton). The temperature peak was in 1998 (predicted by Dr. Wheeler in his Drought Clock). Pay particular note to the drop in temperature in the year 2007. It aligned with the huge drop in what we now refer to as “The Great Recession.”
You’ll also find a large temperature drop in the year 1929, illustrated in my video, “Don’t Like the Climate? Wait a Cycle!” which shows how the DOW rises and fall with temperature.
I expect to see a very cold winter coming up this year as the US market finally tops and heads down in what we may end up calling “The Greater Depression.”
The short story is that we’ve passed the 172 peak in 2007. Central banks have managed to keep the stock market up through this year through their policies, which have been described as the biggest financial “experiment” in history, by none other than Lord Rothschild himself.
The Market this Weekend
There isn’t all that much new in the markets. I’ve been predicting the continuation of the fourth wave of the ending diagonal for several weeks now. I’m still looking for a new low.
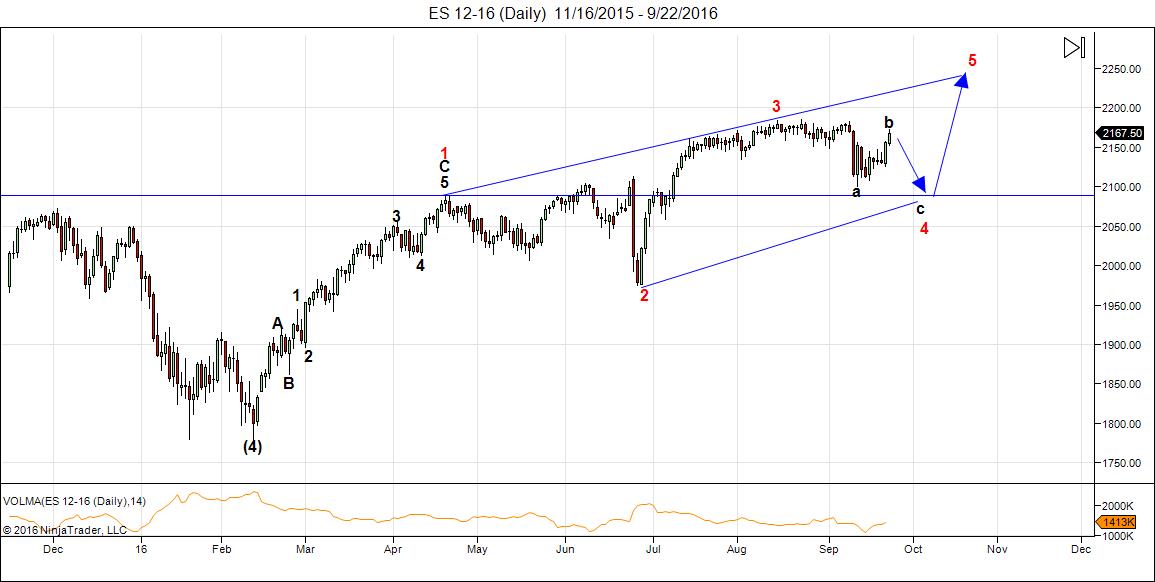
Above is the daily chart of ES (emini SPX futures). On Friday, September 23, we completed the b wave of the 4th wave of the ending diagonal (ending diagonal labeling is in red). Friday, Sept. 23 was an Andy Pancholi turn date for the SP500. The EURUSD peaked the day before on another Pancholi turn date.
I expect a gradual drop to below the 2100 area before a turn up in the final wave of the pattern. Watch for a double top, though, before that happens.
Wave (red) 2 of the ending diagonal was a long time finding a bottom and the (red) 4th wave needs to create some timing symmetry with the second wave, so the extended time involved in reaching its target is to be expected.
Here’s why this final pattern has to be an ending diagonal (and why I predicted it months ago):
- the final wave of a sequence has to be in 5 waves, with one exception—an ending diagonal, which is part of a 3 wave pattern
- the wave up so far (from Feb. 11 to ~ April 20) is in three waves because:
- the small “second wave” (black B) did not retrace 62%, which is a requirement of a motive wave in 5, so for that reason, it must be considered a B wave
- the 5th wave of the black 5 wave sequence is in 3 waves, which a requirement of a final motive wave is that all the subwaves are also motive
- the black third wave does not have a full subset of five waves, which is required for it to be a motive wave
- for all the above reasons, the first sequence up from Feb. 11 is a zigzag.
Summary: This is the final fourth wave dip before the “blow-off” fifth wave and the top of the largest bubble in history. I expect a little more downside before we turn up again to head for a new all time high.
___________________________
Introducing: The Chart Show
Thursday, September 29.
 The Chart Show is a one hour webinar in which Peter Temple provides the Elliott Wave analysis for the US market, gold, silver, oil, and major USD currency pairs.
Get caught up on the market from an Elliott Wave perspective. You’ll also get Andy Pancholi turn dates for the balance of the current month. There’ll be a Q&A session during and at the end of the webinar and the possibility (depending on time) of taking requests.
All registrants will receive the video playback of the webinar, so even if you miss it, you’ll be sent the full video replay within about an hour of its conclusion. For more information and to sign up, click here.


Great analysis; unlike anything else on the web.
Just for the sake of argument I would like to present an alternative scenario. This is just what comes from my own analysis and is in no way meant to challenge the analysis above. And I might add that Armstrong confirms that 2007 was a major high.
My view is that 9/7 was a very significant turn; as there have been many before. It’s just that the market can only let go when all the major dates have been tested.
The 9/25-26 timeframe is another significant turn that further weakens the trendforce. As this is another longterm cycle, a few days either side is possible.
9/22 should have been the high but 9/26 is also major. So here is what will happen next week – at least in my expectation.
A tidal inversion on Monday will give a low. So the market will invert on this major day. HC venus conjunct Saturn supports this.
We have Venus in a bullish dasha untill 9/28 and my Mercury indicator is bullish into 9/28 and this is also the max elongation west of Mercury.
9/28 I have another tidal inversion. Combined this gives a low for Monday and a high on wednesday. This is just a matter of kicking the can down the road for another 2 days. Everything I see is down into March 2017; I can’t help it. I can see why 8/15 was significant, why 9/7 was significant and why 9/26 was significant. But there is nothing left. And the first leg down is into 10/14,
As this is the start of a very long down cycle, there is still a lot of absorbtion to do.
So a low around the end of the month and a retrace into 10/3-4 before a W3- like move comes is possible. But the key – my key – is that the turn has already come and is irreversible. So with my limited insight I can’t see a new ath. But that is just me. Next week I will give the roadmap into the next major date : early december.
Ps. Working with tides the inversions are the holy grail. I found these myself. Sorry I can’t disclose how it works. But is works like a clock; you’ll see. As a matter of fact Thursday also shows a – low tide- inversion. This inversion will stand for 2 days. So after a high on Wednesday and a low on Thursday we could see another high on Friday. No higher highs; just denial and – who knows – central bank intervention.
10/3 is Carolan’s fall high. This could be the final surrender. But the party is over and the lights are off,
Cheers,
André
andre,
your ability to perceive the market is insightful and relevant – and i agree, we are at a major confluence of opposing forces. For me, major price reversals specifically on 9/28 is key, so i will be watching next week closely.
with this market – all things are possible. there is nothing we can do to the buying of the Fed or if the fed decides to buy the market to a ‘blow off top’ level through proxy channels using Citadel [according to zerohedge], in order to sway the electorate. Trump has been pounding the table that this market is ‘rigged’ , its all rigged – the economy is fake, the numbers are fake, and yellen is acting as the biggest political figure out there using free money to make sure obama can leave office well and go and play golf, and hillary gets elected.
a blow off top – if it is rigged to happen – in no way reflects ‘social mood’. social mood is dark and angry right now. Charleston riots this last week is just one example. Isis bombing attempts in NYC. killings in malls. and this is world wide. social mood has collapsed. the populous no longer trusts government or the powers that be. the populous has seen through the spoon fed narrative of lies/deception that “all is well”….. they see through these rigged markets.
What kills me is that Wavists will still try and make a connection to the overt equity market rigging, and social mood. internal polling has donald trump 10 to 15 points leading nationally. Try getting those numbers from the “controlled -bought and paid for” mainstream media polls, where ‘random sampling’ has been replaced by goal seeking predetermined numbers. for a wavist – a rigged blow off top equates to a positive social mood, Clinton in the 90’s positive, which explains why the markets went up. HOGWASH!!! The oligarchy knows this connection well, and has used this narrative of the propaganda indexes so much it has short circuited and backfired in swaying true public opinions.
as for this market – all is possible.
Luri,
Thanks for the kind words.
Andre and Luri. Market is looking good for your bearish call, Andre. Luri, As to your comment about internal polling. I don’t know how you got it but it confirms how they are acting – desparate and putting on a brave face while staring into disaster. It is similar to having to guard themselves against referring to Trump as the winner in the past tense. Ned Davis’ chart of the mkt during years that the encumbant party loses show a rally from May- June to @ Sep and down Sep and Oct. Close to what we are experiencing.
Thanks Iuri,
looks to come from the bottom of your soul
Time-price-vector calculations confirm 9/28 is the day. 10/6 the strongest date in between. This might be a low. Then up into 10/9-10 and down into 10/14. This date is very strong and confirmed by multiple sources.
Hi Peter,
Great post! Thanks for sharing these concepts, very interesting.
Hi Valley,
Yeah, I find the similarities fascinating …
Great post Peter
Luri , i like what you said .
anything is possible that is for sure .
if the masses are typically wrong though then the odds shift to a hillary loss.
that is the risk .
Joe
Market knows its decision time.
See the MONTHLY macd for SPX, SPY, DOW.
Crash waves come out of this setup if and when longs suddenly realize they have to flip sides.
Hi Pieter,
you have become decisively up last Friday.
Have you flipped the sides ?
Staying flat into a binary event like this debate where a large move in either direction could follow.
I like Peter’s C down for 4 here. Better than having started 5 up. 4s are always messy, and largely untradeable in a swing trading style.
Got wind of that on Friday, and saw the tension between my “bullish” weeklies and the other time frames. Tonight’s/tomorrow’s reaction will be pretty informative.
Andre
im not sure about chris carolans fall high on oct 3 .
Having studied his work and running through his theory
each year my concern is the new moon .
carolan stated the market lows tended to be 55 hours prior
to the new moon . there is much more to this and im typing on the fly
but the date im focused on is sept 28th-29th .
55 hours prior to the new moon would be 11:12 west coast time ( USA )
oct 6th is another date yet its the late sept date that fits in regards
to my understanding of carolans work .
As for the debates im thinking the real thing people will be watching for
is Hillary’s health , Can she stay standing for 90 minutes on her own.
The dow closed below 18125 which again is a bearish close .
the 20 day oscillator did get oversold into the sept 9-14th lows , not extreme
mind you but fairly oversold .
any steep decline would bring this indicator into the extreme i am guessing
Bottom line .
im expecting some type of low this week and im holding my bearish positions
for now .
The next important swing high by my work is oct 24th . so once i cover
later this week ill be looking for an upward bias which may just be a sideways
movement
various downside objectives at this point yet im watching the
17731-17358 range in the cash dow .
i cannot at this point make a solid extreme bearish case .
Joe
http://www.astropro.com/new.html#SEP_26
“September, on the 28th, in advance of the new moon on October 1st, and continues into the 4th”
“October 13-19 SuperMoon shock window”
“October 27-November 2 new moon period”
“October’s soli-lunar shock windows are unusually potent. The September 28-October 4 new moon window, for example, overlaps the three days-either-way shock wave associated with Mercury’s September 28 maximum western elongation (the end of the year’s penultimate Mercury Max cycle)”
Joe,
There will be retraces in any down move. The main point is that I think that the trend is down.
9/28 is much stronger than 10/3. But still this could be a lower high, The strongest dates in my system are 9/28, 10/6, 10/10 and 10/14,
The dominant cycle is down into 10/14. That will be a low.
The longer trend is down into march 2017. So 10/14 we will see a retrace into december.
Again, this is just what I think.
I said a low on Monday and a high on Wednesday. So far so good.
Cheers,
André
Political correctness’ first victim was religion and unwanted proselytizing is annoying. So the next prophet happened in 1844 in Persia (Iran). Worth looking up if one is interested..
The time price vector on DJ from the may 2015 high into the aug 16 high is 8496. This is exactly 59 times 144.
This is one of the reseasons that I think the ATH is already set.
Problem is that nobody does this kind of analysis – as far as I can tell- so I am a bit on my own here. I Can’t expect people to confirm my view when nobody sees what I see,
Only remaining question is if I see the right thing. Guess we’ll see soon enough,
Cheers,
André
André,
You are unique, and I hope you will be right because I m short.
Good luck to all.
Andre, will you please HELP us do this kind of analysis? You are quite a bit ahead of the curve so we’ll need to start with baby steps to get an understanding of what you are doing. THEN perhaps ‘some’ of us can sprint forward towards where you are.
Thanks for all you do and share.
Purvez,
If you could be more specific I can see where I can help.
Some of my tools are proprietary and I can’t share everything, But if you have a specific question, just let me know and I’ll see what I can do.
Andre, right now I don’t have the foggiest of how you arrive at your dates. All I have gleaned is that they are ‘cycle/vibration’ related. Some ‘starter’ material that I could read up on which would help lay out the fundamentals of what you are doing would be a huge help.
Of course anything you feel is proprietary should be excluded. I suspect I would not even begin to understand that part even if presented.
Thanks again.
A!
You are doing good stuff and we can only hope it is correct! Than we can all say for sure ‘that dude is a genius’!
For now, I stick with Peter his count since I don’t see we have topped ‘properly’ + I expect a big fat bottom later than mid October while you say we will retrace later on. 😉 Time will tell! 🙂
Cheers,
W
Andre’,
Thanks for your conviction to your work! While I do not know if you are “right”…
I “believe” you are right! I am looking forward to any posts you would care to share with us! Do not let anyone get you off track!
Andre,
I concur with Ed. You are doing some fine work . All of us who trade are looking for the edge and I “believe” you may have found it. Don’t loose focus . Don’t let anyone get in your way of truth and understanding. Thanks for including us in your quest.
Bravo!!!!
Harvey
Thanks for all the kind words. I’m humbled.
André
Well you deserve it Andre,
I believe in your art
And I also like the work of Peter and Joe.
André,
Can you also share something about the magnitude of the decline after Sept 28?
Thanks
John.
This weekend I’ll see if I can translate my timing into price. But I think Peter should be able to shed more light on this.
As a first estimate 2007 on s&p looks like a magnet.
2001-2003 is another strong price level. (based on sqr9 and w24).
Covered all bearish trades
i didnt want to but i did .
joe
SPX monthly EMA(13) is currently at 2086…that might be a good price ‘area’ to pay attention to…going forward, two other price ‘areas’ worthy of note: the 2000 top was 1552.87 on March 24 and the 2007 top was 1576.09 on October 11…
Why i covered my bearish trades .
not saying this will happen but the market should have continued
falling off and it did not , the date shown here would where
the 2 legs are = ( larger pattern A B C )
guess we will find out soon enough
joe
http://imgur.com/J4CjGJt
ANDRE – 9/28 is a ‘key’ price reversal date. it stands out as such. the action of prices tomorrow is worth studying.
Luri,
I agree. But I have a lot of confidence in this timing, Only question is how late it will turn. Could be tomorrow night. But this should be the final start of the decline into 10/14,
This weekend I said a low on Monday and a high on Wednesday. Tomorrow another tidal inversion; these work always.
Wednesday, September 28, 2016
https://twitter.com/NorthmanTrader/status/780369996170027008
Rotrot,
Northy’s tweets are not public. Do I understand correctly that he says 28 is a cit?
sorry about that…six Fed speakers tomorrow, to include Yellen’s 10:00AM testimony before the House Financial Services Committee…
Thanks! Could bring some volatility.
Here something weird I found,
The time price vector on the 2007-2009 swing is 1043,3. Calculating the e-tone value of this we get 2307,3. 16 times 144 is 2304. See how close this is?
adding 2307 to 2009 we get 6/30/15, adding 3 time 144,2 to this we get 9/4/16,
This is when the venus indicator gave the high and caused the 9/7 high,
Just another explanation why 9/4 was so significant, Adding 24 days to 9/4 (wheel of 24!) we get 9/28.
All based on the e-tone tpv on 2007-2009. E-tone translation seems to turn everything into a vibration. Ms Yellen before the senate committee this day; can mean only one thing. I said it before; major vibrations always show in the real world.
1260 is a biblical cycle. As 0 is nothing, 126 is also a cycle.
From the major 1/20 low (was the cycle low) adding 126 twice gives ….9/28!
See how vibrational that is? And the tides give an inversion. Everything dances to the vibrational tune.
Heliocentrically Mercury, Mars and Saturn form a triangle. Today.
The e-tone tpv on the 1929-1932 decline gave 9/8/16, Very different period, but very close to 9/5/16. It is all the same vibration, Gann said that it is just as easy to predict 100 years in the future as it is to predict next week.
The price range between 1929 and 1932 (intraday extremes) is 345,44.
Adding 89 times this to the 1932 low and we have 9/9/16; major down move.
Yet another confirmation of a major change in trend.
Dan Ferrera calculates the crash angle on the NYSE birthdate. An alternative is to use the USA birthdate. The 1929 high now gives an 228 degrees crash angle. Using the 30/12/15 torque high, we get 9/28 as a crash date.
Soon, my friends, soon.
Very soon.
SOON SOON SOON! 😀
Ty A! 😉
Cheers,
W
Mind boggling analysis. Great work Andy. Lets meet the soon SOON.
TY
Bala
Closed a long Put on VXX for a gain this morning. Not very confident if we are finishing the B Wave of C of 4 or starting the C Wave of 5. Very compelling research posted. I may take a small position short as i think wave 4 has not completed yet, but won’t be aggressive again until we approach one of the trendlines on the ending diagonal. The move down from the 8/15 has too many overlapping in the waves to think the top is truly in.
2165 on the spx may be a good entry point as it is the .618 retrace from the 9/22 high to yesterdays low. The 1.618 extension gives a c wave low 2117. Stop at 2180. Risk reward of 3 to 1.
A few years ago, Quotetracker used to be the very best charting program that linked to all the major online brokers. Jerry Medved, who created it, sold it to TD Ameritrade, who did nothing with it. They finally retired it over the past month.
Searching through everything out there this past week, I found that Jerry has taken his original program and enhanced it even further. I grabbed it instantly. It’s without a doubt the best charting program for traders of any kind that connects to an online broker (you can even trade with it, if you like).
The new program is Medved Trader and you can find it here: https://www.medvedtrader.com/www/frontend
And it’s $179 a year!
I get no compensation of any kind for this. I’m just passing this along as I love his software and would like others to benefit from his work.
Thanks Peter,
My next big low is Okt 6..
we are now less than 55 hours before the new moon .
this is typically a low based on Chris Carolans work .
will be interesting to see the market action going into the close
might be a decent short term bullish trade ?
Thank you for the info peter , i began a remodel on my house several
years ago ( i bought this beat up house back in 2009)
i am finally into my last room and intend to use part of that
space for an office/computer/trading area .
i have been checking out various software programs yet have not
yet decided on which way to go . My bias is to take all my excel
spread sheet formulas and input them into a software program
and then run it through a rigorous test , tweak what i need to
and have it auto trade . im guessing it will take me a year at best
to actually have it all set up . ( worst case i learn something from it )
Ill check it out
Joe
I use Linnsoft’s Investor/RT and recommend it, and them, highly. 15yrs with them now.
Great customer service. Including odd hours on the weekends if necessary.
One downside — all the quote data is imported onto your machine and stays there. So you have to maintain yourself it if there are splits etc. Not a big deal for most.
Upside … first you can scan across the universe for signals, near instantly. The signals can be structured to simultaneously pool monthly weekly daily and intraday indicator values into a single binary buy/sell decision. (Most of my signals involve multiple timeframes.) The coding language is simple boolean arithmetic (and, or, not, etc) and the tokens can be customized to suit your natural language. Eg, mW is my token for the monthly Williams 10 per. My favorite aspect of it is the visual backtesting of signals. Design one. Chart its history. See where it works or doesn’t. Revise. Over time, your toolkit gets better and better.
Basic plan is 70/mo plus extra for a data feed. You can use IB for free real time quotes, if that’s your broker but a backfill source would be recommended. Charts have MOST of what you’d expect. But not the best EW labeling tools or channel graphics. Give it a look. I can answer some questions if posed in direct response to this post.
Nice pop
my day is finished
ill live to trade another day 🙂
18506 cash dow is still possible into oct 7th .
from there ill re evaluate
im flat now with no trades
Joe
PALS is mixed this week and next. However, I am hunching that we reach new highs tomorrow or Friday and then have two weeks of selling first two weeks of October.
2173.69 to 2176.91 on the S&P is a gap on the 60min chart.. It will probably fill the gap then turn down..
Square root timing on the 2000 high gives 10/3. That’s Monday. Doesn’t change a thing. Down into 10/14. End of the month/quarter is a bitch.
Master timing on the 6/22/15 high gives 10/2 on zero degrees. 10/1 new moon.
Damn; I should have seen.
There is a 25 year cycle from the 1982 low into the 2007 high, This is a major cycle as it is a squared number and 1,5 times the 17 year.
This cycle gave a low 9/26, So the crash angle gave 9/28 and is still acitive. The 25 year gives the high 10/3. Next stop 10/14. Everything gives 10/14.
Now an ending diagonal. Don’t expect much up as everything is down.
Again; nothing changes; it’s a matter of days now.
It also means that when we turn the door into 2017 is opened.
This will be a hot autumn. But not due to global warming 😉
P.s.
25 years from 2007 is 2032 = 17 years from 2015.
50 year is 7 times 7 + 1.
Mmmm. have to do some more thinking.
The 1982 low came (almost exactly) 50 years from the 1932 low. If this is a low angle , midpoints give highs. Then 2007 was a major high. (think somebody else already said this).
My target for a low is the end on 2023 (50 years after 1974 low) but now get the feeling the mood may stay negative into 2032. Who knows; high 2029 (=+100)?
The ATH was – and will stay – 8/15. After 49 days we enter the deathzone (7 being fatal number). 8/15 + 49 =10/3.
andre,
i am still supportive of period as being a confluence of opposing forces. 9/28 was the day, so now we count the days ‘out’ from 9/28 [inversion days] until a change in trend has established itself.
how is your confidence level for 9/28 moving forward being the change in trend to the downside from the 9/15 top? my thought is that ‘robo trading algos’ can levitate prices through cycles if programmed so to do.
Luri,
My confidence level is extremely high. Robo trading can’t stop declines as they are just part of the same vibration as we are.
This weekend we will see some really bad news.
1987 saw a big decline, 150 years after the 1837 high. The top was 8/25 but the decline game 10/2 (w3/C) down.
Mastertiming on this 10/2/87 gives 3/10/2016, These date are connected.
Vulcanic vibrations, calculated on the biggest eruptions – gives 10/3.
Everything is a vibration. Central banks and trading bots are part of what is happening and can never alter what has to be.
At least, that is my opinion,
Markets are synchronizing. Wallsteet already wants down, but Europe has some catching up to do. This weekend they will meet. Big moves come when markets are in sync. European markets have seen opening gaps for the last 2 weeks with the cash market flat 9 out of 10 days. This is not a healthy market.
Will give some more reasons this weekend. But we should really prepare for a volatile market.
Typo 10/3/16
andre,
you are great! haha – you need to go on tour with david ike. i agree with you completely all is vibration [electrical in nature], and vibrations are flowing packets of information. And the information concerning cycle dates points to yesterday, the ‘now’ and towards 10/3/16…..?
Luri,
One sign of an approaching turn is what I call time compression. I have cycle dates from many different sources, But the time between dates becomes shorter. All dates I give are significant but if looks like everything is converging this weekend.
If this is true we are likely to start a Multi year bearmarket.
Things will get really volatile in 2017 with another – lower – top in the fall before a huge decline into 2018/19.
In my mind the turn is already upon us and is irreversable. And the ath will not be touched for the next 7/8 years. Just my contemplations; no trading advice 😉
5/19/15 was 2000 sqrrt 5 weeks from 9/3/1929, When we add 32 more weeks we get 10/1/16. 32 is 2 to the fifth power. See how 5 rules everything?
sqrrt 2, 3 and 5 are seeds. Not regular numbers but building blocks of the universe very vibrational.
10/1/16 is also 19331 sqrrt 2 weeks from october 1492. And 10/3 is 116 sqrrt 3 weeks from 2000.
This shows there is a mathematical reason for the market going up into the weekend. Has nothing to do with intervention of any kind.
Stan Harley who writes a cycles market letter, has discovered that cycles tend to be functions of specific Fib numbers time the square root of 5. You can find it on youtube.
Kent,
Thanks; I have seen his work,
https://www.equities.com/user/stanharley
andre,
the non mathematical reason for the market going up into the weekend is called END OF 3RD QTR “PAINTING” OF THE TAPE! its thats simple. its called wall street collusion!
:-)))
https://twitter.com/AlmanacTrader/status/781239568536334336
“September Last Trading Day Historically Bearish–S&P 500 Down 15 of Last 21”
Andre
I respect your work as well as your passion for it .
something i have observed is the 34 years from 1932 to 1966
also 1974 plus 34 = 2008
my suspicions is the July 1984 low fits into this yet i have yet
to figure out why or how .
also there is a 42 1/2 year cycle in play along with a 93.3 year cycle
both of which i have yet to pin point .
1927 plus 42 1/2 is 1969- 1970 which brought us to the year 2012 .
the 42 1/2 year cycle i relate to the global warming / cooling periods .
the 93.3 year cycle i relate to the moon and aspects to other planets .
where that fits in i have yet to figure it out but i am convinced it matters.
my cycle low still stands as Jan 20th 2017 yet i see a cycle low as
march 2 2017 as well .
your work is remarkable yet were you and i disagree is where
the all time highs will be seen .
late 2017-2018 should be new highs following the Jan-march lows .
My bias for this is cyclical yet is also in combination with martin Armstrong
work as well as the wave count .
Key support for the cash Dow is now seen as 17063.1 which concerns me
once we do indeed head lower following what ever high we actually get
over this next week ( 18506 cash dow ) or the Oct 24th swing high date .
1966 to 1985 was a sideways movement in the Dow ( 21 years )
from a price perspective it was 1966 to 1982 which was 16 years .
the years 2000 to 2012 i consider a sideways movement which
was only 12 years yet based on the pattern i am following it makes
total sense even if outside the box pattern recognition .
The highs of years 2014 to date should be the left shoulder
of a head and shoulders top formation ( i have not pin pointed the exact
left shoulder yet ) the new highs in late 2017 – 2018 should be the head .
so figuring out an initial down side target will be simple .
a rough estimate of where the high could come in would be 1.5 to 2.2
times the length of the left shoulders high to low in terms of points.
then that number in points added to the low .
as an example from a longer term perspective .
14198.10 ( 2007 top ) minus 6469.95 ( 2009 low ) =7728.15 pts
times 2.2 = 17001.93 pts plus the 2009 low at 6469.95 targets 23471.58
on the cash Dow .
using the 1.5 multiplayer you get a target of 18062.17 <—-
this level keeps getting tested and i've noted the closes
below 18125 are bearish yet the market has continued to
turn back around and rally .
using last year data as this last left shoulder as an example
18351.36 – 15370.33=2981.03 pts times 1.5 and 2.2 ( for the range )
4471.54 and 6558.26 plus the 15370.33 low targets the
19841.87-21928.59 price range .
lastly 8 year expansions ( bull markets are rare ) , we will visit the
8 year mark in march 2017 ( we both are calling this a low )
Oct 1987 to Oct 2002 = 15 years add 15 years to Oct 2002 and you
get Oct 2017 ( low to low to high as i see it )
looking at it from an odd set up based on George Lindsay time spans .
7 yrs low to low plus 8 years low to high ( rough guess estimates )
2002 plus 7 = 2009 plus 8 years = 2017 for a high of importance .
i have stood by that simple formula since the 2009 bottom and
if i m proven wrong ill except it but at this point i m sticking to it .
in your own work your calling for a march 2017 low . the question
is what if we get this low in march as expected yet price is still
above the 15370 low of august 2017 or the Jan Feb lows of 2016 ?
One thing i ve learned over the years is that we must learn to except
what the market gives us , we cant demand more profit .
Joe
Joe,
I don’t have a crystal ball. A high late 2017 is very likely. Will it be higher or lower?
For trading it doesn’t matter that much, as long as it goes up it is up.
But my system tells me the trend is down so highs should be lower. This weekend I’ll share some of this material so you can make your judgement.
1966 to 1985 would be 19 yrs correction
10/3/16 is 115,2 sqrrt5 from the major 1/20 low. This is one of Harley’s cycles.
10/2 is 196.8 sqrrt5 from 7/20/15,
Andre,
Harley is projecting a low first week of November but he is very bullish and expecting new highs after that.
In my opinion the market is totally rigged by the Algo’s.
The machines against human emotions all calculated.
John,
If we all shared the same vision there wouldn’t be a market. I don’t say he is wrong. This weekend I’ll give some reasons for my bearish bias. Then everybody can decide for himself what to make of that.
Thanks,
I don’t think like a bear or a bull,that is killing me with daytrading just one step at the time waiting for my next turn 5/6 Okt.
But keep up your work just like Joe.. it is very interesting.
https://worldcyclesinstitute.com/the-next-prophet/#comment-11884
you may want to consider reading all of Harley’s articles…
today is a Bradley model turn date .
note yesterdays triangle top formation
this mornings high poked into the triangles apex and then was rejected .
that is typical of a triangle .
the daily charts July to Sept triangle is a similar pattern .
the key now being yesterdays high , a break above yesterdays highs
would target 18506 on the cash dow .
a continued break down would make the case we topped yesterday .
its to soon to make the claim the peak of this counter trend rally has ended .
a close below 18125 as well as a continued decline is needed before any confirmation .
im staying flat today yet if im going to trade ill trade to the upside on a short
term basis only
the triangle mentioned was in the overnight futures
short term buy at 18073 dec dow emini
ill leave a very tight stop .
this level corresponded with the dow daily chart
the low in sept to the high and the .618 retrace .
this does not fit when looking at the futures .
hence a risky trade yet will see soon enough
Joe
“Dow below 17,992 would be a clear warning that a steep fall could be underway”
http://www.zerohedge.com/print/573544
got 10 pts , not great but dont have time to watch this
andre,
thoughts on what you are seeing in the market action?? vibrations playing out?
9/28 was a crash date and it sure brought some movement. But I really expect 10/3 to be tested. After that it is pretty straight down into mid october.
Last weekend I mentioned the tidal inversions on Thursday and Friday, These seem to work. Tomorrow a high, a low in the weekend and the last serious 115 td top 10/3.
Andre,
Good call Andre,
Do you still think we make another high on Monday?
Thanks
John,
Nice motive wave down today
Solarham.com shows highly elevated geomagnetics last 72 hours.
ALT count …. haven’t validated in detail …. would love serious EWer reactions
This is fitting what I take from my NON – EW charts into EW as best as I can fit them …
Jan (not Feb) was the W4 low
Feb was the bottom of 2 of W5 up (double bottom)
Brexit ended the 4 of W5
(Could argue internals of W5 all abc’s)
Top was in back in early Sept.
Leading Diagonal down off Sept.
LD3 was the 400pt day.
LD4 up ended last week. 50dma as R.
1 and 2 of LD5 down completed. 3 down of LD5 down underway.
Today was i and ii of 3 of LD5 heading south.
If correct, iii of 3 of LD5 should be imminent as DB melts down and its not an overnight or weekend fix. Very red mañana.
200dma would be a logical target ~2050.
Then Oct gives us W2 (or B) up.
Nov 2 or Nov 8 starts W3 or C down.
Might be wrong but best to be prepared if not. GLTA.
i was dead wrong today no doubt
i was lucky to have the 10 pt gain i got .
despite the 60 trillion deutsche bank has in derivatives as well
as the potential run on the bank and the fact it is the major
clearing firm in Europe i find it odd the market did not fall
even harder then it did .
the Sox index today was up 1.25 % the transports relatively unch.
The Dow poked below 18125 yet closed above it at 18143.
i do have a bearish outlook going into January yet at this point
the market has not yet proven itself bearish to me .
had i not had a long day today id be trading the overnight futures
tonight .
Open Question for futures traders :
Has anyone other than me noticed a notation on your account saying
” Potential Regulation – T Call ”
My account trades strictly futures and i have never Been over margin.
Ill look into this later yet i have never seen this notation until today
and i wonder if it has to do with some new regulation .
Joe
Is anyone seeing this on the DJIA futures? This is a ‘freeze frame’ at around 16:25 BST on Fri 30/9/16.
https://postimg.org/image/e4n73k0dh/
It sort of ‘gels’ with what andre is suggesting.
Hey purvez
that is my thoughts also .
i posted this a few days ago
it was why i covered my bearish trades .
now how ever i have to re evaluate it
but it is picture perfect to me
http://imgur.com/J4CjGJt
Hi Joe, I saw your gartley pattern a couple of days ago and thought that made a lot of sense. Then we had the big ‘down’ yesterday which threw me until today’s ramp up which sort of outlined the complete pattern.
Let’s see where things take us now.
Thanks very much for your input.
Info for any of you who trade on margin .
09:06 Anonymous so far: Why do have this notation on my account saying potential reg t call i have only traded futures and i have never been over margin
09:09 andy: you can disregard that message. it was generated as an error
09:09 Anonymous so far: thank you
09:10 Anonymous so far: any reason why it may have generated that error , just for my own info ?
09:13 andy: it’s because this account has not been flagged as a PDT, pattern day trade account and any settled funds get placed into a money market part of the cash balance. that being said, when you make a trade, eventhough you have the BP for it, the clearing side (back end) doesnt see those funds and generate a false margin call
09:14 Anonymous so far: ok
09:14 Anonymous so far: thanks for the info
09:14 andy: you are welcome
I guess this means
if i make multiple trades in a day it triggers this error .
still doesn’t make sense but i accept it .
i hold trades multiple days more so then day trades .
anyways i found it odd that was triggered yesterday
when it has never happened before .
Joe, my reading is that they are starting to get twitchy about margin. I would ‘enshrine’ this conversation because you may well need it at some point when they ‘close’ off some of your trades on the grounds that there wasn’t enough margin in the ‘right’ place….even though you had no control over your money to start with.
This website is for educational purposes relating to Elliott Wave, natural cycles, and the Quantum Revolution (Great Awakening). I welcome questions or comments about any of these subjects. Due to a heavy schedule, I may not have the time to answer questions that relate to my area of expertise.
I reserve the right to remove any comment that is deemed negative, is unhelpful, or off-topic. Such comments may be removed.
Want to comment? You need to be logged in to comment. You can register here.