

The Pressure is Mounting
Well, it’s that time again, when I get several emails trying to tell me what to do and where the market is going. I try to stay well away from all of them. They are counter-productive to my work.
I cannot do my work without remaining absolutely objective in my approach to the market.
As I do my typical analysis (it took many hours this weekend, focussing on the relatively small waves at the top of the current B wave in the US indices), I look across all the usual asset classes I routinely cover and it became very clear that they’re all on the verge of a major turn. However, I’m viewing signs of a corrective wave to the upside before that happens.
In the US indices, I don’t believe we’ve reached a top, for the reasons I outline below, which including important timing elements, as well as the count I’m seeing across multiple asset classes.
This week will be important, but also deserves a high degree of caution. The upcoming turn down will be a big one and count last for multiple months.
The US indices have resisted the mounting pressure so far, but it won’t last much longer.
DAX: Already in a Predicted Downturn
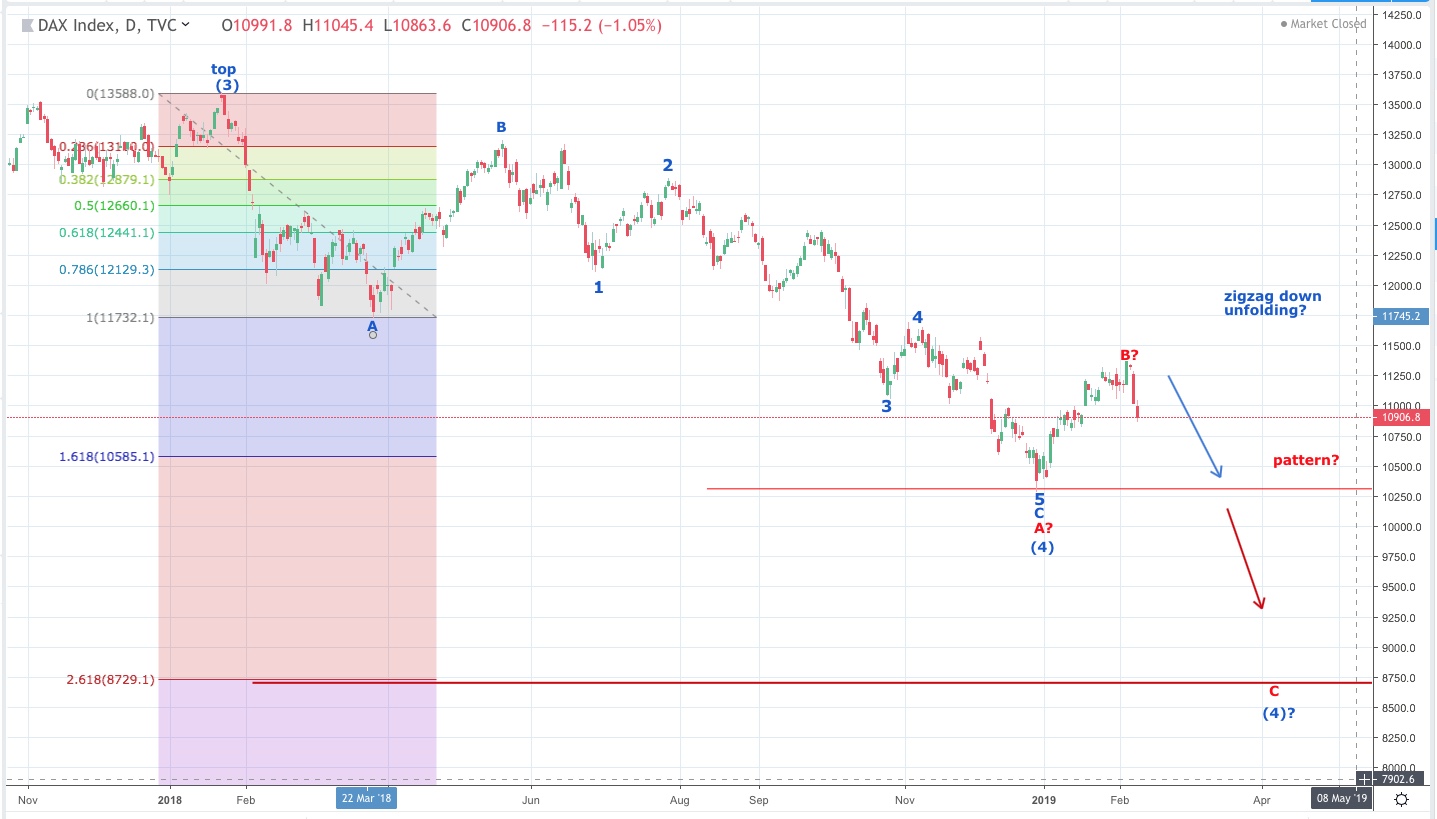
Above is the daily chart of DAX (the German exchange). (click the chart to enlarge)
Indices around the world (as I’ve shown in previous posts here) are in a similar position to the US indices. DAX is currently in a fourth wave after topping in a third wave. However, I’ve been predicting (for the past few weeks) another downturn to a new low, and probably a much lower low.
This week we’ve seen the start of that wave to the downside. This is some of the pressure I’m referring to. The US indices are starting to look like “the last man standing,” as some international exchanges (and major currency pairs, including the US dollar index) appear to have already turned.
This pressure will eventually cause the US indices to join the group. It might be quite a show, because everything is about to turn together to the downside.
However, DAX appears to have completed 5 small waves to the downside and while the larger wave counts as a three at the moment, it could easily turn into a five and continue to the downside. In the meantime, it looks to me that we’ll get a bounce, which may indeed align itself with a final high in the US indices. Lots going on this week.
Elliott Wave Basics
Here is a page dedicated to a relatively basic description of the Elliott Wave Principle. You’ll also find a link to the book by Bob Prechter and A. J. Frost.
____________________________
Registration for Commenting
Want to comment? You need to be logged in to comment. You can register here.
If you register, it protects your information. It also allows you to comment without filling in your information each time. Once you’re registered, simply go to the home page and click on the login link top right in order to log yourself in. Usually, you’ll be logged in for several days before needing to be logged in again.
______________________________
Problem receiving blog comment emails? Try whitelisting the address. More info.
______________________________
Couldn’t be happier … KK 2
Couldn’t be happier …The analysis and insight you provide is simply amazing! I’ve been trading the futures and equity markets for well over thirty years and usually average around 5% monthly. Since joining your Traders Gold Service two months ago, that number has better than doubled. I couldn’t be happier.—KK |
The best of them JL 2
The best of them …Last couple of years, I subscribed to several ‘market traders’. You are by far the best of them and the personal contact is awesome. Daily and daily updates are very well written! Besides your expertise in EW, I also like your cycles analysis. Best investment I ever made! —JL |
Tops in your field DZ 2
Tops in your field …You are tops in your field. Tried to follow Elliot Wave international for years. They were always behind the market. After discovering you, I perceive that you are an expert in reading the waves, which puts you way ahead of the rest of your peers. And you can read the Waves like you are reading tomorrow’s financial section. I pray you stay healthy. —DZ |
Get an upper hand … JC 2
Get an upper hand in trading …Seeing all the different currency pairs and the wave structures and hearing you explain why this has to do that on a nightly bases gives one a upper hand when trading. Elliott Wave applies to all stock and indices and can be applied to any candlestick chart. If someone ask what you want for Christmas – Tell them a membership to Peter’s “Traders Gold!”—JC |
the real deal SM 2
The real deal …‘Educational, insightful and thorough market analysis for all levels of traders. It’s Elliott Wave at its best….Peter Temple is the real deal’ —SM |
Rise above the rest … SM 2
Rise above the rest …I have only ever met a few people who, in their chosen fields (astrology, medicine, music, martial arts, technical analysis), rise above all the rest and you are one of them…you have ‘the gift’…and that’s why I’m a Trader’s Gold member. —SM |
Have not had a losing week RW 2
Have not had a losing week …I have been with Peter almost a year. The only thing that matters is have I made money with his service. I think I have finally turned the corner using Peter’s EW. I have not had a losing week in the last 5 months. Thanks Peter, for your amazing amount of hard work. —RW |
A true expert in Elliott Wave FL 2
A true expert in Elliott Wave …You are a true expert in EW analysis. What you provide is not available anywhere and is priceless. Subscription on your services is the best thing I have ever done. Many thanks for your effort to make me a better investor. I now have more trust in my investment decisions. I hope you will continue the excellent work! —FL |
US Market Snapshot (based on end-of-week wave structure)
Here's the latest daily chart of ES (emini futures)
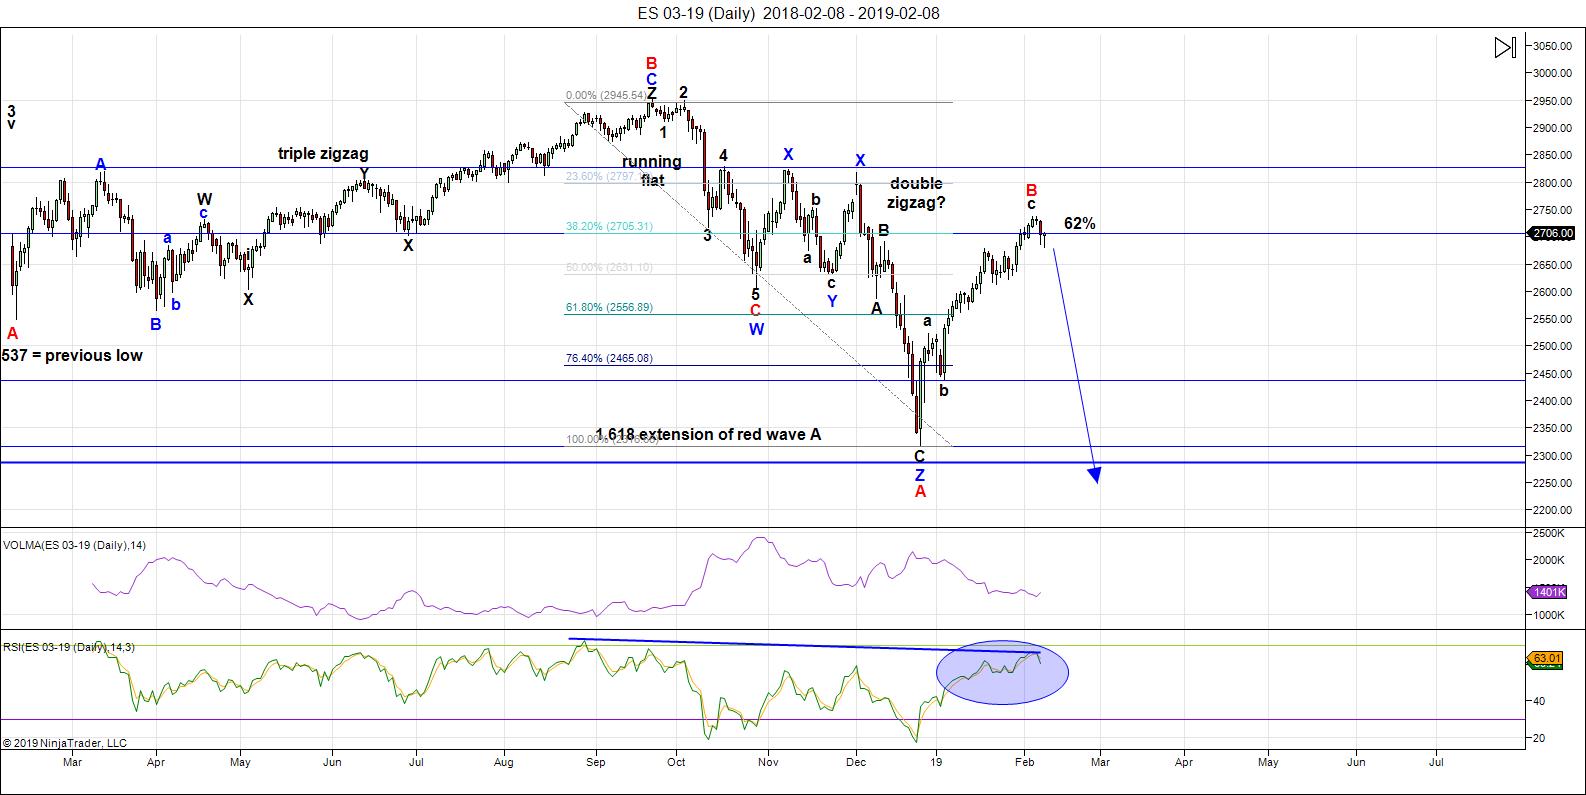
Above is the daily chart of ES (click to enlarge, as with any of my charts).
We have a B wave that's now risen 62% of the of the height of the previous set of waves down from the all-time high.
This past week, we had a wave down in the US indices that, at first glance looks like a "five." However, to my eyes, the additional waves within it suggest that it's corrective. it also dropped slightly below the 38% retrace level of the previous set of waves up. First waves need to drop to the previous fourth wave of one lesser degree, which it did not do.
In IWM (the ETF for the Russell 2000), the waves down are undeniably in three waves. Since all NYSE sub-indices must have the same count and can't move in opposite directions, the probability is high, imho, that we'll see one last new high in ES.
There is also the question of timing. The waves down from the all-time high to the Dec. 26 low took 12 weeks exactly. The B wave up from that low, that we're at the top of now, has a high at February 5. That's one day shy of six weeks.
However, the B wave up has risen slightly more than 62%, so I would expect in this case, that it should take a relative amount of time to complete, closer to seven weeks, or slightly longer (by a day or two). That suggests the top will be this week.
On Thursday night, I called for a bottom in the current area and a turn up in a first wave, which we now have. The wave up looks motive and rose to slightly above 2705, which was my call. This is consistent with the start of 5 waves to a new high.
Let's see what happens this weekend, but the probability, as far as I can see, if for a new high to complete this B wave.
There are other asset classes (currencies, oil, silver, and gold) that also suggest a new high is coming in the US indices.
Summary: My preference is for a dramatic drop in a C wave to a new low that should begin this week. The culmination of this drop should mark the bottom of large fourth wave in progress since January 29, 2018 - over a full year of Hell. It may be a dramatic drop that lasts multiple months, and will target the previous fourth wave area somewhere under 2100.
Once we've completed the fourth wave down, we'll have a long climb to a final new high in a fifth wave.
___________________________
Trader's Gold Subscribers get a comprehensive view of the market, including hourly (and even smaller timeframes, when appropriate) on a daily basis. They also receive updates through the comments area. I provide only the daily timeframe for the free blog, as a "snapshot" of where the market currently trades and the next move on a weekly basis.
______________________________________
Sign up for: The Chart Show
Next Date: Wednesday, February 13 at 5:00 pm EST (US market time)

The Chart Show is a one hour webinar in which Peter Temple provides the Elliott Wave analysis in real time for the US market, gold, silver, oil, major USD currency pairs, and more. You won't find a more accurate or comprehensive market prediction anywhere for this price.
Get caught up on the market from an Elliott Wave perspective. There’ll be a Q&A session during and at the end of the webinar and the possibility (depending on time) of taking requests.
For more information and to sign up, click here.
| "I think you are the only Elliot Wave technician on the planet who knows what he's doing.” |
| m.d. (professional trader) |
All registrants will receive the video playback of the webinar, so even if you miss it, you’ll be sent the full video replay within about an hour of its conclusion.


2/10 poseidon turns retro. 2/10 is a node/apex date. 11 will be a high and a low. 2/12 is equilibrium timing on 1932. The vedic moon is exalted 2/13; a high.
About torque. Garret said price is a liar; we need to use torque (price/volume), The idea being that when prices go up on light volume, the trend is up vv.
All my analysis is on torque. Only in torque we see real cycles, The 2000 high came 12/31/1999. So torque is predictive in most cases.
When I download data without volume, I look for related volume. For The Baltic Dry index I use FTSE volume and for vix I use SNP volume. Both give A high 2/11. This proves that torque works and related volume always beats no volume.
10 is a strong date hence the high monday.
I still think 2/18-25 is where we are going,
Cheers,
André
This comes from Gann’s timing. See 2/8-10? Major change in trend.
“IMPORTANT DATES FOR CHANGE IN THE MAJOR TREND
The following dates should be watched for important changes in the major trend of both Industrial and Railroad stocks. If any stock makes top or bottom around any of these dates, you can expect a reversal in trend, especially if there is a sharp decline or a sharp advance around these dates: Feb 8th to 10th, March 21st to 23rd, May 3rd to 7th, June 20th to 24th, August 3rd to 8th, Sept 21st to 24th, Nov. 8th to 11th, Dec. 20th to 24th. These dates are based upon a permanent cycle, which does not change. Important dates are based upon a permanent cycle, which does not change. Important tops and bottoms are made in many stocks every year around these times. Watch the stocks that reach extreme high or low levels around these dates.”
Thank you Peter T for your tireless teaching and input. Your opinion is definitely valued in this traders life. Giving is a gift and you definitely have the gift.
Thanks again!
Jeff T
tks, Jeff.
Thanks Peter. Something about the price action Friday bothered me and I think your analysis explained it.
Although the decline did indeed look impulsive, I pay close attention to pivots and reclaim of 2700 intra-day was a huge red flag imho. One more wave up would make perfect sense. The initial wave down for a turn at this degree should DECISIVELY take out MULTIPLE pivots. That has been my own experience over many years of trading around pivots. It simply did not happen last week.
Thanks Peter
Your time and efforts are aporeaciated .
I have friends in Seattle ( where I grew up )
Rembering the old snow days we got as kids .
I have not seen the Columbia river this chilly
Ever yet my time working around it is minimal at
14 years .
Glad to be heading south towards long beach California
Since they are calling for snow in Portland Oregon on Monday .
Thanks again , I do realize how much time your weekend updates take
And the hours of tying everything together .
Joe
Thanks, it was indeed a long haul this weekend. We’re cold now up north here. I guess the El Nino died about two weeks ago. Since then we’ve been hovering in the minus teens C and as low as -25 highs … and no end in sight. It’s gradually starting to warm up a bit, with -11 forecast for a week from Tuesday. These temps usually head south over time, so watch out.
Well Peter t
It looks like the mini ice age was man made 🙂
I’m sure you know I’m in complete agreement with your
Research which only adds to my own .
This is the 2 nd article I’ve read in the past week basically
Saying the same thing .
I’m guessing this will be a new direction they will push .
It’s not cyclical it’s all man made .
It’s worth the read I guess just to be aware of the story line
as we move further into the future
http://news-us.dailyadvent.com/news/detail/aaff3e4127caecde889af8384b0093c8_us?client=mini&like_count=133&features=43
Amongst the many inconsistencies in the story line
To the link above I’ll add these just for fun .
The researchers propose that some 90 percent of the indigenous population, or nearly 55 million people, died at the hands of the colonists, either through violence and or diseases like smallpox, measles, and influenza, hitherto unknown in the New World.
Then they state :
The authors of the study also admit that it is notoriously difficult to quantify how many indigenous American peoples died at the time, in part because no census data or population records exist.
My next research project .
This guy put in 30 years of research .
Not a bad place to start .
Effects of planetary motion and alignment
Before we get started, let’s address a couple of basics:
Never try to dismiss any correlation with the idiot’s refrain that “correlation is not causation.” That is an astonishingly stupid thing to say, as it is tantamount to saying that “a clue is not a mathematical proof.” Who claims that it is?
There is never causation without correlation.
Correlation provides important clues where causative mechanisms might be found.
Correlation is not causation, but you are more likely to find a cause in a correlated variable than in an uncorrelated one. Search where there is at least a trace of a putative connective tissue. If you think it was the tomato that upset your digestion, start your controlled trial on tomatoes.
Correlation is not causation, but sometimes a finding is suggestive, like a trout in the milk. It does not prove that the milk was watered, but it makes you suspicious.
The “correlation is not causation” mantra is true as far as it goes, but it tends to be used so as to argue that, despite many correlations linking A with B being found in different circumstances, these will somehow never suffice to strongly suggest a causal link between A and B. On the contrary, correlation is a necessary feature of causation, but not a sufficient proof. Correlation is not always causation, but it helps find causes. Correlation is a pre-condition of causality.
Harlan True Stetson (1885-1964) was a Research Associate of the Massachusetts Institute of Technology, where he was the Direcctor of the Cosmic Terrestrial Research Laboratory at Needham from 1940 to 1950.
Effect of Sunspot Cycles on Long Distance Radio Signals (Tele-Tech, Jan. 1947, Vol. 6, No. I, pp. 44-49.)
A survey of sunspot activity and critical frequencies over the period 1934-1946. Absorption in the E layer is an important factor in the prediction of usable frequencies.
Maxwell Oscar Johnson (July 18, 1892 to May 21, 1951)
Cycles in Weather and Solar Activity, 1950, Paradise of the Pacific Press
Cycles in Weather and Solar Activity is another attempt to account for apparent cyclic variations in weather by correlating them with similar variations in sunspots or solar radiation. Here, however, the suspected weather cycles are correlated not only with solar variations but also with planetary positions. The author shows that the records of New Haven yearly mean temperatures and rainfall in England correlate reasonably well with yearly relative sunspots and with the synodic periods of certain planets, and then theorizes that planetary positions cause the solar activity.
(from D. J. Portman, “Cycles in Weather and Solar Activity. Maxwell O. Johnson,” The Quarterly Review of Biology 27, no. 1 (Mar., 1952): 136-137.
John Henry Nelson (Dececember 10, 1903 to May 23, 1984) was an engineer with RCA Communications in New York. He was also Propagation Editor for 73 magazine until his death in 1984.
Shortwave Radio Propagation Correlation with Planetary Positions, RCA Review 12, March 1951
Planetary Position Effect on Short-Wave Signal Quality, Electrical Engineering 71n5, May 1952
Cosmic Patterns – Their influence on Man and his Communications, American Federation of Astrologers, 1974
This book deals with one of the most controversial questions in the field of solar system science: Do the planets play a part in the development and behavior of sunspots and magnetic storms? The author, who has spent almost 30 years doing detailed research in this field, has produced very strong evidence that the planets do, when in certain arrangements, cause changes in the particular solar radiations that are associated with magnetic storms in the atmosphere of the earth.
What a crazy market!
Looks to me like we are heading higher.
Round numbers being vigorously defended…
Banksters are buying… lol!
Your probably right on higher Verne
Peter t being correct as well .
This market is reminding me of 2002-2003
123 4 1 2 3 4 but no 5.
My overall bullish bias is working yet honestly
I still must wait until mid March before calling anything .
I guess everyone is excited about the potential government
Staying open deal which is rediculous . There really is no
Reason the government should ever shut down . The political
Games are making all of them look like fools .
The US China talks and deadlines another issue .
brexit and the EU another issue .
The fact the stock market has held up through all of it only
Shows how much none of the ” news ” really matters .
Last year was a bearish cycle and the end of the year ” window dressing ”
Sent the losers down . Fund managers then bought back in going into
Year end . That is my opinion.
The finance sector has been holding up lately from what I’m seeing anyways .
Insurance sector not bad either .
It feels to me like people are about to start chasing the market in fear of missing out .
That would imply the 200dma gets broken and the 200 dma slope would then begin
To turn up .
It’s going to take a bit of time for that to take place .
My thinking outside the box
Once we see a 5 wave move up ( if we see one ) then comes wave 2 or B
That could be mid March or late May .
I’ll continue to hold individual stocks as planned into September before
Making any longer term decisions yet from Sept 2019 to jan 2020 we enter
Another cycle high .
From Oct 2019 into around March 2020 we have a few cycle lows due .
That said . From a longer term point of view I’ll point to the year 1972.
1972 was an odd price high .
I have been doing some research in which I have been trying to build a
Longer wave model . Using some general data sets ( not super accurate )
I have found a combination of planets which tend to show longer term
Rare alignments . It also dove tails with the work of James mars langham
Which he wrote about in 1939 .
Generally , I looked back 1200 years trying to see the exact cycle times
What I discovered is a few more alignments in the mix .
This is not an easy task to pin point and yet I did see a correlation between
The early 1800’s and the year 2032 . That alone to me May have more to do
With global cooling than the stock market yet that’s ok with me since my real
Interest is the sunspot cycle .
The next sunspot cycle high ( we are near minimum now but not at minimum
Or at least minimum has yet to be defined at this point )
That gives us approximately 5 1/2 years into 2024 2026 before the next solar maximum.
The article I posted in the prior thread :
Explains a bit of history to this :
https://www.socionomics.net/2011/09/article-the-sunspot-cycle-and-stocks/
Peter T has written about his research of DR Wheelers work . In one of those articles
He mentions the tempurature dropping as the sunspot cycle rises .
Putting this together and I have not put it all together at this point . It’s looking like
It’s going to continue getting colder as the sunspot cycle rises . The stock markets around
The world will probably rise yet as we enter solar maximum everything from GDP to world
Economies go into an economic decline .
Martin Armstrong’s ECM also points towards the year 2032 as a major turn . I can’t say his view
On that but the set up looking longer term looks like an extended cooling trend which is in complete
Agreement with Peter T , a food shortage and plagues . Now if you want to add to the fodder .
Population loss and an increase in plant life with the addition of ” The Green New Deal ”
We’re looking at a Great Depression times 100 .
That’s my very broad outlook .
Today though waiting until mid March before making any stock index calls .
( I can’t blame bankers because their manipulations are to short term for me to Cate about )
2/12 Mercury 180 degree on sun-rahu. (triangle). 2/12 fibo day.
2/13 moon activates sun-apex.
Hi Andre
so far, so good on the energy chart for this week
see link attached
https://ibb.co/9YKmTSD
Tom,
Thanks. This weekend new chart?
I have just about given up paying any attention to most of what I hear and read anymore. The price action to me as a trader clearly confirmed what Peter T predicted about upward movement just ahead yet I take all kinds of grief when I challenge immediate bearish counts and try to point out, based on experience, the importance of how price trades around contested round numbers. I think I am going to simply keep my mouth shut and trade the market based on what I see.
Cashed in ES contracts.
Holding SPY 271.5 calls.
Holding 270/272 bull put credit spread on SPY.
Using 1/2 point trailing stop contingent order on SPY to exit long calls.
Will roll spread up 1 strike if we CLOSE above 2700.
Will exit short puts if we get a reversal signal, a close below 2700, or a gap higher or even a strong green candle in VIX. Hopefully we get ALL of the above at the top. Good luck everyone!!
Verne
I agree with you
1 2 3 4 I II III IV i ii iii now . And I’m not saying it’s a 5 wave structure
Sounds about right Joe.
I know I am alone in my belief that market price is less a function of “herd sentiment”, than it is of central bank activity. This market rally has been accompanied by a global expansion of CB balance sheets. The evidence is there for the whole world to see and I am surprised they put it out there. Q.E. is back!
Oh yes! I know they “only” announced” patience in their balance sheet run-off, but that just shows how gullible and downright stupid and easily manipulated folk are these days. They SHOWED us what they are actually doing!!!
Does any thinking person believe there is anything “normal” about these multi-hundred point DJIA ramps higher we have been witnessing recently?
My own view is that market weakness is forcing them to employ freakish leverage, hence all
those gaps higher. They do have one great weakness.
They cannot HIDE when they unwind LEVERAGE!
That is why I pay very close attention to what I refer to as price pivots.
They tell you what the banksters are doing.
If you know what they are doing, you know where price is going.
I fully understand not everyone agrees with this viewpoint.
I will let market price speak for itself…
Verne – I use an algorithm to identify turning points of corrections based on historical data. I end up using 90% confidence interval to get a potential range of turn at the end of waves 2 and B. Since 2012, corrections on the side of rallies have gone to the higher end of expectation 75% of the time. Given the historical recalibration built into the model, every time this happens, the model assigns a higher probability of the rally reaching higher levels in subsequent cases. It is possible that two potential events have caused this phenomenon – central banks providing liquidity and more capital being assigned to algorithmic models. This also explains why sell offs are fairly violent between 2.5% to 7.5% (as that is the typical stopping level for these algos). As vols go higher, these algos are shutdown causing the declines to retrace to more typical historical levels. Then as vols go down below a certain level, they are switched on again reinforcing the behavior from the last 10 years of central bank easy money.
Yep! December and January saw the most massive retail exits from the market in history. We are to believe the herd has “suddenly” once again become wildly bullish?! it really is amazing.
I agree CB liquidity drives global equities markets. The foot-prints of the machines are as plain as the noses on our faces…lol!
Tom
excuse my ignorance about energy..I am just starting to try to learn that side of trading..Do you create those charts yourself? and if so can you explain a little about how it works? thank you..
Hi Marie
I just posted a new chart for this week
to answer your question
I do not generate the data
that is done by a research facility in a Scandinavian country
I take the data and time shift and clean it up for posting
Energy comes in many forms
the Sun is the biggest energy source in our solar system
is gives off many forms of radiation not just heat
This radiation effects our planet and our emotions
which in turn effects how we trade. I hope this helps.
Well put. Tom, do you have any access to science that proves the influence of exogenous energy (EMF) on humans? … it’s a link I’m missing that I’m searching for more info on. For me, it would help to explain the recurring traits that accompany the major cycles (172 years, etc.)
https://www.youtube.com/watch?v=jie7qFhEPnY
https://www.youtube.com/watch?v=han7AzKvv2Q
Randy is worth a look
Randy is a trader’s trader!
Thanks Red Pup.
Luri says “Hi!” 🤗
Verne
From what I from your thoughts about the central banks .
I’d say Peter T already told us what they would do almost 1 year
Ago when he explained the then upcoming wave 4 .
In my own work in late 2017 I forecast a bearish cycle into Jan 4 and Jan 20 2019
Which was just over 1 year in advance .
I know you rely heavily on your beliefs in the central banks yet those same banks
Failed to stop the 20% dump from Oct to Dec 2018 .
Or do we now say, well they allowed it to happen ?
Where is this information that specifically shows the central bank buying stocks ?
I have heard ” the balance sheet ” the ” PPT ” etc for years and yet
The wave count which Peter T posted on this site last year called the low almost
To the exact level .
I just find it very difficult to blame an outside source for what the market does .
I will agree that the government’s around the world as well as the central banks have
Done their best to have everyone put their full faith and trust in them . I can accept that
But in no way will I ever be one of the fools who trusts them .
I bought the Dec 26 open based on a combination of my work and Peter T work .
I’ll leave the blame game for someone else
Apologies for my previous post .
I’ll keep my thoughts on central banks to myself .
Sorry if I sounded offensive .
No offense taken whatsoever Joe. I am not sure why there are so many folk these days that take offense over someone having a different point of view! I think it is healthy for us to question everything.
I do not think the banksters are all powerful. They will be utlimately overcome by the massive debt overhanging global equities markets.
As to the crash last year and its explanation, I can cite a few possible reasons.
The crash was clearly signaled by the 19 consecutive HIndenburg Omens.
The strategy the banksters used to drive market higher was to focus their buying in a narrow group of stocks. You can literally calculate how the lion’s share over 30%) was owing to gains in fewer than ten stocks!
The crash of last fall was built in and clearly telegraphed by the narrowing market breadth as price headed higher.
The bankster buying was temporarily overwhelmed by the margin calls that resulted from the crash, but you saw that V shaped phony bottom.
They simply stopped reducing their balance sheet and removing liquidity from markets and I suspect that they actually started another QE program quietly.
I will never as long as I live understand people who want to argue about the role of CBs in influencing short and mid term market trands, Al you have to do is overlay and SPX chart with the advent of the Q,E programs. Proplr would be shocked to find out how much of stock pruchases were done by stock buybacks of companies of their own stock. Since these buys were funded with debt issued with the aid of banks, that also is indirect Q.E.
Even putting what we know about Q.E aside, how can anyone look at a 15 minute chart of the indices and fail to see the way Central banks infuse cash into the market at very strategic points to arrest impulsive declines, negate bearish reversal signals, close open gaps down etc etc. have come to the conclusion that this is not an argument worth having. I guess some people just don’t look at candles the way I do.
Market price is in my view not solely due to “herd sentiment”
It does not matter what your sentiment is if you have no money to buy.
I stated before that retail investors left the market in historical numbers last Fall and earlier this year. The market will crash when the central banks loose control of it, and not one second before. Just my take based on long observaton.
With the passing of Anthony Caldaro on Feb 11 2019
I’d say we lost a good Elliott wave guy .
Peter t has mentioned Elliott wave theory as a science
I’ll say Anthony Caldaro added to that science with his
OEW Elliott waves blog .
You will be missed
Elliott wave lives on !
Verne
We all have our methods and our beliefs
As long as we benifit by the tools we use then it’s all good.
Its the loss of purchasing power of the currency in the end which
Brings higher prices . A rise is purchasing power of the currency lowers prices .
Higher taxes, higher wages give an illusion of prosperity.
Our incomes go from 5000 a year to 100,000 and our cost of living goes up as well .
For some they lose because they don’t ever put any money to work and chose to spend
What they earn .
The rich get richer not because of income but because of investment.
The poor get poorer because of lack of investment .
It’s all about the value of the local currency .
That’s my thoughts .
The feds can attempt to flood the economy with money and lower the value of
the currency yet that just causes a rise in things .
Local governments that lack money raise taxes , business then raise prices
It all appears like an economic boom for a while yet at some point it all comes
To a halt when the masses finally get fed up with being strapped .
I don’t call it ” the cost of living ” I call it ” the cost of government ”
We can look at Illinois or we can look at the rise in homelessness .
Raise minimum wage to 15 an hour won’t cure anything .
Raise the minimum wage and you create more tax dollars
Nothing really changes .
You either invest or you find yourself barily getting by .
Now we have pensions scrambling to survive . Those 1% bonds won’t do
So where do they put their money ?
What heppens when us treasuries begin to decline ? Interest rates rising
Will help the pensions but it will kill the government .
Higher taxes force business to raise prices and that squeezes the masses .
The yellow vest movement is growing for these very reasons .
People are becoming fed up with Taxes !
The federal reserve does not need to sell treasuries but it can let them expire
And collect their money back , it can then take that money and buy stocks to hedge
Those losses on the remaining bonds it holds as rates rise .
Back in 2005 it was the ” real estate never declines ” that drove first time home buyers
In. Now it’s the stock market .
The last phase of a bull market tends to be a steep rise as everyone piles in at once .
1999 it was the nasdaq , 2003 to 2005 it was real estate , 2016-2017 it was bitcoin
I don’t know what the next sector is but it’s not usually the same sector
I know basic materials are beat up, commodities are beat up, the gold and silver markets are
Beat up . Bond prices don’t look good to me
NVDA reports earning after the close Thursday .
Don’t expect anything great Friday .
Feb 13-19 th is here next comes March 5
Keeping my market thoughts to myself until March 15 .
Price is the most important , I totally agree
Joe I could not agree more!
My view on EW theory is not based on a desire to make an argument for its own sake. It is based on long years watching RESULTS of EW analysis. How many analysts do you know that CONSISTENTLY correctly predict market direction? I cannot tell you how many times it was only because I read someting that Peter T said that made me question the call of do-called EW experts I was PAYING to keep me on the right side of the market. I lost a lit of money tradimg their calls! Until I got wiser.
I am not saying one has to be 100% correct. Clearly there are times in EW anslysis where multiple valid counts are possinle, and the correct one becomes clear only AFTER the wave completes.
I admit my EW skills are very limited, so by necessity had. to develop other tools in order to consistently execute profitable trades.
I make a distiinction between a method being “predictive” and offering “high probability”, which ultimately is what trading is all about.
Harry Dent niw looks like a complete fool for years of calling market tops because he refused to acknowledge the role of central banks. His demographic models did work beautifully for years, but he failed to adjust to new and unprecedented market conditions and kept applying the same old metrics that no longer worked to predict market direction.
I peronally traded volatility set-ups for years witha 70-80% success rate. Then a few years ago trades that used to work simply stoped working and we saw an unprecedented complete departure of VIX returning to years of histotic mean. It headed in one drection and kept going for years to historic lows. Market conditions change. Traders and analysts who do not recognize this and adapt will often end up on the wrong side of the market.
Just saw this after my post above
https://www.armstrongeconomics.com/world-news/taxes/massachusetts-seeks-to-change-its-constitution-to-use-taxes-to-discriminate-against-people/
The sheer stupidity and corruption of the US congress just boggles the mind. Rather than pass a bill limiting the ability of corporations to defraud shareholders and manipulate the market by share repurchases, they are now going to treat the buybacks as DIVIDENDS????!!
Oh, I get it. You can royally screw the shareholders just as long as we get our cut of the action! Right!
Does anybody really doubt that this rotten-to-the-core fiasco is inevitably going to implode???
Just think about this for a minute folk. The vast majority of shares repurchased are ALREADY trading below what these corrupt corporations paid to buy them back so share holders are currently sitting on losses due to that misguided scheme, clearly designed to boost P.E. ratios and pay themselves fat bonuses.
Now hapless share holders are in addition going to have to fork over additional monies to the Guvment in what would amount to a “dividend” with a NEGATIVE yield!!! You cannot make this stuff up…!!!
I was thinking that Peter’s title for this week’s thread is most apropos.
One cannot help but get the feeling that something huge is brewing.
From the way they are buying futures I am guessing that they will prop prices into the close tomorrow ahead of the upcoming long week-end….then lower the plank!
Today was likely a mini preview… Lol!
Keeping my thoughts to myself until mid March .
CSCO looks like 5 up from the Dec lows .
The oil sector held up as did the materials sector
Finance was weak .
Keep in mind I have my own indexed stock groups so I can’t speak for
The actual index’s .
For me Thursday was a mixed to slight positive day despite the cash Dow being down .
I have noticed though that this becomes a bearish set up lately .
My groups of stocks tend to lag tops then drop a bit harder on the follow through
Down days .
I totally ‘re grouped ( ‘re allocated ) between Sept ( gold stocks ) and Dec ( 16 others )
My overall weighting has changed .
Not going into it just noting I have spent a fair amount of time working with
Share based weightings . It takes forever to get everything as I wanted it .
Mid March I’m sticking with as important and most likely a low .
Staying with my longer term bullish bias into Sept .
I’d say watch the transports Friday ( all next week )
CSCO is a basic 3 waves up from Dec. A nice short.
I think your correct Peter T
I was looking at the weekly chart
Also I’ll add
I have not looked at the retrace from the 2000 high to the 2002 low
On CSCO but there may be a fib retrace level not far away .
The 5 waves I spoke of from the Dec low to now was weekly chart only .
very sweet divergence happening on the weekly if nothing else
Peter T a very serious query.
I cannot count the number of times EW analysts in unison throw out a five wave count only to have you correct that view and call it a three, and be proven right. I am not even talking about us light-weight posters, but the so called experts who charge folk for their useless opinions.
Why in heaven”s name do so many EW analysts have trouble distinguishing three and five wave patterns??!!
Verne,
I find looking at waves and determining whether they’re 3’s of 5’s exceptionally easy. I can determine (analyze) a pattern in an instant most of the time. Here’s that CISCO chart: https://worldcyclesinstitute.com/csco-chart/
When I was 17/18, my father put me through a battery of tests (I see I still have the results in a file, which is interesting … will have to read). I scored “off the charts” in space relations, which is “mental manipulation of 3D concrete objects through visualization, i.e. manipulating of things mentally.”
So those tests in which they give you an initial set of say, four images in different positions and they ask you to pick the next one in the sequence from a selection of 4-5 other ones, is a snap for me. I always do those first because they’re so easy. I can just look at them and mentally see the relationships between them all in a flash.
I’ve had people talking about EW, say that analysts meticulously count waves. I don’t – I just look at a chart and can see the waves an underlying structure (don’t quite know how to explain this).
It’s likely why I ended up in television as a writer/producer/director. I used to imagine the commercial or program in my mind and then just go put it all together. Won me lots of awards.
Not tooting my own horn, but it’s an ability that I’ve had all my life and have used to some great effect in a variety of venues. I don’t think I did a lot to get that skill. However, when I was much younger, we lived outside a small town and I would play on my own in a small forest, imagining bad guys and developing scenarios in which, (as the Lone Ranger, complete with mask, and “six-guns,” I win every time … haha. It was hours and hours of using my imagination, playing by myself, day after day. I think that’s how I developed that ability.
Don’t know if that helps. I’m a little bit weird that way (lol – probably just the start …)
Wow! That is truly amazing. Thanks.
Makes a lot of sense too.
Actually, looking at the test results, it was when I was 20 I took those tests.
The bears are pathetic. No commitment whatsoever to the short side. We continue to wait until the EW scenario potentially changes to bullish! The FED has successfully engineering quite a significant rate hike with little negative effect on the market. Big win for them so far until the bears get their act together (if they are able to).
Pete is there some sort of online test we could have a go at
In relation to? (sorry, I can’t see easily which comment you’re replying to …)
Is this B wave almost over! Did count change?
This is all way too funny!
The bulls are giddy, dancing in the streets and chanting:
SPX 3000!!!!
The bears are all wailing plaintively: “All is Lost!”.
And running for the hills.
Is anybody else thinking what I am thinking?!
Closed short leg of bull put credit spread today and fully loaded long volatility with a generous helping of TVIX.
I do wish they would offer options on that puppy! 😜😜😜
I bought some speculative 1.00 strike calls on RIOT a few weeks ago and they have plumped quite nicely. If Luri’s long term Bitcoin chart is right we will exceed the old highs. I plan on taking delivery of the shares at expiration and forgetting about the trade for a year or two to let the position “plump” a bit more. I may even sell covered calls against what would be a good sized position, although the option bid/ask spreads are pretty lousy.
Anyone else long Bitcoin? 😎
not far off loading up. think we have one more little down run yet
Thanks for the chart on csco Peter
Cash Dow now 1 2 3 4 I II III IV I ii iii iv v
I don’t whether to call it a 3 wave move or a 5 .
Not sure of a b c x a b c
It’s 13 waves up though .
Hey Dude, if Peter says its a three…well, you know…! 😊
Some folk are talking about SEVEN waves up off the December lows.
I am not by any means a competent EW guy but could they be missing an extended third wave?
Well, if you go count the CSCO chart, guess what … seven waves. You need that number to have a C wave of 5 waves and an ABC wave overall. it’s exactly the same pattern, as I’ve maintained all along in the free blog posts. And now, we have an ending diagonal in play … so … we wait for this monster to break.
There are several other reasons this is a corrective wave, but they’re the same boring reasons I’ve stated along the way. It’s a market that’s frustrating as Hell … the Fourth Wave from Hell kinda frustrating.
At the moment, the C wave is 2.618 X the length of the A wave, which is a typical full, extended length for a C wave. We wait and continue to sit on our hands. You’ll hear all this again on the weekend, whether we top before then, or not.
From now on, I am planning on 2.618 C wave extensions Y’all hear? Haha!
Thanks Peter!
Swing high Jan. 18, before important low 1/22, was a Friday before full moon. (https://worldcyclesinstitute.com/bear-market-rallies-a-taste-of-whats-to-come/#comment-35890)
Today is Friday before full moon.
LizH,
I assume you meant feb. 18?
Are there any bears left?!! Lol!
Nice call on the ED Peter.
Not quite a throw-over yet but who needs it?
Have a great week-end everyone!
Well, I’m trying to prove that it’s not one, but so far, not successful
Off the cuff calculations points to a nice round number target of 2807.95 as a maximum target for wave five of the potential ED and it is certainly looking like we hit it the next session or two!
On another note :
Raymond merriman .
I agree with his overall views for a few different reasons yet everything appears to be coming together
Then again , some of my models are based on his studies .
This is something new to me though so I posted most but not all of it .
https://mmacycles.com/index.php?route=blog/article&category_id=1&article_id=238
We may get a glimpse of this future reality this week. Venus will conjoin both Saturn and Pluto, February 18-22 which is a preview of what we will see when Saturn and Pluto actually enter their conjunction on January 12, 2020. This week’s conjunction of Venus, Saturn, and Pluto follows the time last month when Venus was conjunct Jupiter and square Neptune, January 20-22. These translations of Venus over first the Jupiter/Neptune square, and then the Saturn/Pluto conjunction, are a symbolic preview of the greater picture of Jupiter square Neptune, January-September 2019, followed by the Saturn/Pluto conjunction in January 2020, with an effect lasting through much of 2020. As you can see, first the market was up, and now let’s see if we get a pull back from the Venus-Saturn-Pluto conjunction this coming week.
An even more important “translation” to the same set of aspects will follow with the Sun in March and April. That is, the Sun will conjoin Neptune and square Jupiter, March 6-13, and then head for a square to both Saturn and Pluto, April 10-13. Thus, this period offers another preview of what is to come, if not specifically in terms of market behavior, then in terms of political and economic scenarios. That is, first hopes and wishes, perhaps tinged with delusionary visions of “what could be,” followed by a smack in the face with cold reality, probably related to debt issues. It is very interesting to see the increasing attention being created for many socialistic policies, like free college education, guaranteed minimum annual payments by the government to everyone, even if you don’t work, to Medicare for all, at the same time the national debt is reported to exceed $22 trillion. These “parallel realities” are taking place as we leave the first Venus translation of Jupiter and Neptune (wishes, hopes, delusionary visions) and approach the Venus conjunction to Saturn and Pluto (hard, cold, reality involving debt) this week. The tax cut (Pluto) did not create the increase in revenues for the U.S. treasury that was expected. But I suspect all that will be forgotten soon as we approach the Sun’s translation to Jupiter/Neptune square in March – until we get to April, when the debt level again reaches a point of greater concern and makes headlines.
Each translation of Jupiter/Neptune by a faster moving planet, followed by that same planet’s translation of Saturn and Pluto soon afterwards, is likely to exhibit this pattern: first optimism based on hopes and wishes, then worry based on “How can we afford this with such debt?” This back and forth pattern progresses to less and less optimism and more and more concern the closer we get to 2020. The danger for traders and investors is that they become complacent, because every downturn in the market is still followed by healthy rallies, until Jupiter and Neptune finally separate after September. The danger for governments, institutions, companies and individuals is that if not careful, they may be headed for a credit crisis, such as bankruptcy (classical Jupiter/Neptune occurrences), where they spend far beyond what they can afford, falsely believing that everything is OK and will work out.
It is important to understand this dynamic. It may be hard to identify the exact turns in financial markets these days, especially if you don’t use geocosmic indicators. However, if you understand the collective psychology that is taking place, you can see why this type of pattern, and this probability of increasing investor complacency, can be a “setup” to a rather dangerous market climate that could very well be approaching. It is a reason why investors are advised to start thinking about how they can move from “market risk” to “cash” or certain commodities (if not done already), for when the psychological bubble of complacency breaks, cash will be king. That’s usually the way things go when Saturn enters hard aspect to Pluto and Uranus within a year of one another, which will take place in 2020-2021, for the first time since 2008-2010, and 2000-2002 before that.
His dates are very close to my own ..
My study of Venus bull and Venus bear cycles are from Barbara kovel not Raymond merriman I’ll add .
According to her when a market goes up or holds up in a Venus bear cycle then when
The Venus bull cycle comes you ain’t seen nothing yet . ( big rally )
On the other hand , when the market goes down in a Venus bull cycle ( Aug 2007-June 2008 as an example )
Then when the Venus bear cycle hits , look out below .
Since Jan 4 we have been in a mars Uranus bull cycle , a Venus bull cycle and an inverted puetz cycle
All these combined gave us the screaming rally .
The puetz cycle is now over , we are in a minor mercury bear cycle yet still in a Venus bull cycle
As well as a mars Uranus bull cycle .
Short term I’m keeping quiet until mid March .
Raymonds article I am in agreement with .
I think he has a very good overview of what is taking place and he already discribed this before hand .
Enjoy the weekend everyone .
Told you some weeks ago about Gann’s deathzone 2/18-2/25. Next week should be interesting. 18 will be a high but US markets closed, so 19 will be a high too.
If this analysis has some value we could see a major change in trend next week.
18 is a very strong date and 19 is 53 months (prime number) from 9/19/2014. Bradley gives a high 2/19 and that is a cosmic cluster date. That is why europe will bring a low 18 for a leg up into 2/19.
Next part of the month looks bearish.
No forecast; just some thoughts.
Cheers,
André
The energy chart for next week confirms
see link below
https://ibb.co/5vyqtVs
Thanks Tom. My system gives a high 2/17, like your chart, Early morning 2/18 cet we have a negative sensitive degree of the moon. 2/18 is also a negative degree in the Sun. This all confirms we will see a high early morning 2/18 and a low later in the day. The deathzone runs into 2/25 and that should be a high. Think that date will be tested for a serious leg down.
you are correct about the 25th being a high
https://ibb.co/JHF43m7
Tom,
Thanks. One thing; have a positive degree of the moon 16:00 cet, so think the low comes Friday. We have BR40 (venus) and the euro/dollar gives a high. Both indicators indicate a low 2/22. In 2000 (19 year cycle) the DJ gave a high 2/22 and NDQ a low 2/22.
Am really interested what your next chart will bring voor the next two weeks.
2/25 major high but tidal field up into 2/28 (end of month).
p.s. 2/16 is a Gann natural trading day/ change in trend. 2/28 comes next. The energy chart peaks 2/16. Have no clue how you create these charts but they correlate nicely with my timing.
p.p.s.s.
The solar constant gives a high 2/20 and the 35 week cycle a low 2/21.
It is absolutely fascinating how varied are the views of market price action.
Right now my own is ludicrously simple. I think this ridiculous ramp up in the markets is NOT normal, and due to leveraged buying by the cabal. The beautiful thing about leverage is that it eventually has to be unwound! I expect vindication of that thesis to come via a monster FIRST wave down. Until I see that happen, I am staying out of way of the banksters. Their pockets are so much deeper…!!! 😀😀😀😀😀
2/20 is 45 months or 45 degrees from the may 2015 high. This will be a high.
Like my coffee hot. Gaz is needed for warmth. So the natgaz/coffee ratio is a logical combination, And yes; it gives a high 2/18.
The strongest indication is that 2/18 is a low in the cosine on Neptune RA. This is a Multi-week cycle and confirms the death zone.
Not much to add. 18 will be a high and a low. 19 strong high and a low. 2/24 very strong high, marks the end of the death zone. One more week of consolidation but next weekend should be very significant. 2/24-25 a high.
Expect Tom’s energy chart to confirm this 😉
André
HC Pluto hits the HC north node of Saturn 7/30/2020. In the countback sqr9 we get 2/18 at 315 degrees. Next 3/1; low?
Could go on 4ever. Everything gives 2/18.
If we are in an ED, there will be no more “highs” after it completes. The ED possibility in my view would increase with a throw-over move next session so I agree with the idea of a possible high on Tuesday when markets reopen. Confirmation should come with an impulsive break of the diagonal’s lower boundary. If a C wave of the degree I am expecting is on deck, we are going to take out 2700 on the FIRST wave down. Not sure how any talk of “highs”, as a trader of course, would be relevant under that scenario. Every trader is going to view the coming move down as a swing trade oppotunity lasting at least several weeks. If we do NOT take out 2700 on the initial move down, I think that spells very serious trouble for the immediate bearish outlook.
A new weekend post is live at: https://worldcyclesinstitute.com/extreme-greed/
This website is for educational purposes relating to Elliott Wave, natural cycles, and the Quantum Revolution (Great Awakening). I welcome questions or comments about any of these subjects. Due to a heavy schedule, I may not have the time to answer questions that relate to my area of expertise.
I reserve the right to remove any comment that is deemed negative, is unhelpful, or off-topic. Such comments may be removed.
Want to comment? You need to be logged in to comment. You can register here.