
 The Clock is Ticking
We’re a little closer to a top in the US indices — in time and wave structure, not in distance. That’s because, the SP500 closed on Friday at the exact same level we were at a month ago. In other words, we haven’t made much progress in a month. This is not what I’d consider a bullish market by any stretch of the imagination.
The waves up are corrective and showing rather dramatic signs of coming to an end.
NQ is very possibly tracing out an ending diagonal, while ES appears to be in the late stages of an ending expanding diagonal, which is an extremely rare pattern. Both project a top within imminent reach.
Looking at the SP500, which has the same ending diagonal pattern, it also appears to be in a longer term wedge. Wedges never end well for anyone following them.
There’s little left to trade from a swing-trader’s perspective. Be careful with long trades, as many assets have had “failed waves” to the upside. They start well, but end up coming right back down to the start. It’s often less risky to sit on your hands and wait until the top. Surprises will be to the downside until we top.
Currency pairs this weekend are difficult to call. We have corrective waves in both directions on a short-term basis, so it’s impossible to provide a prediction on direction. But the bigger picture is that they’re very close to a turn.
Investor sentiment is up this week, as would be expected.
______________________________
Ryder Cup
I just finished watching the final session of golf’s Ryder Cup, the US vs. Europe. Europe annihilated the US. Congratulations to the very talented and spirited European team!
The crowds in France, where it was held, were perhaps the largest and loudest in the history of this event. I would have to think that a lot of the crowd exuberance was a reaction the worldwide political situation, and to the cycle top that we’re currently in.
I’m working on a blog post today (don’t know if I’ll get it finished today) which identifies some of the relevant traits of these cycles tops, contrasting the changes at a similar top at about the year 1600. The similarities are striking.
One of those similarities is the weather. It’s turning colder and I’m expecting an extremely cold winter, so time to prepare. Our temperatures for Calgary, Alberta this time of year are 15° C (59° F). It’s currently 3° C (37 °F) midday and predictions are for a high of 4° over the next week, slowly heading down below zero (32°F). Nights will be below freezing for the next two weeks (and have been for the past week).
Winter has begun super early here. We had a very late start to the summer and looking back, I’d have to say it was only about three months long. We’re slightly more than 300 miles (500 km) north of the US border.
Markets always top when climate turns down; that’s what history tells us.
__________________________
Elliott Wave Basics
There are two types of Elliott wave patterns:
- Motive (or impulsive waves) which are “trend” waves.
- Corrective waves, which are “counter trend” waves.
Motive waves contain five distinct waves that move the market forward in a trend. Counter trend waves are in 3 waves and simply correct the trend.
All these patterns move at what we call multiple degrees of trend (in other words, the market is fractal, meaning there are smaller series of waves that move in the same patterns within the larger patterns). The keys to analyzing Elliott waves is being able to recognize the patterns and the “degree” of trend (or countertrend) that you’re working within.
Impulsive (motive) waves move in very distinct and reliable patterns of five waves. Subwaves of motive waves measure out to specific lengths (fibonacci ratios) very accurately. Motive waves are the easiest waves to trade. You find them in a trending market.
Waves 1, 3, and 5 of a motive wave pattern each contain 5 impulsive subwaves. Waves 2 and 4 are countertrend waves and move in 3 waves.
Countertrend waves move in 3 waves and always retrace to their start eventually. Counrtertrend (corrective waves) are typically in patterns — for example, a triangle, flat, or zigzag. Waves within those patterns can be difficult to predict, but the patterns themselves are very predictable.
Fibonacci ratios run all through the market. They determine the lengths of waves and provide entry and exit points. These measurements are really accurate in trending markets, but more difficult to identify in corrective markets (we’ve been in a corrective market in all the asset classes I cover since 2009).
To use Elliott wave analysis accurately, you must be able to recognize the difference between a trend wave (motive) and a countertrend wave (corrective). There’s very much more to proper Elliott wave analysis, but this gives you the basics.
____________________________
Registration for Commenting
Want to comment? You need to be logged in to comment. You can register here.
If you register, it protects your information. It also allows you to comment without filling in your information each time. Once you’re registered, simply go to the home page and click on the login link top right in order to log yourself in. Usually, you’ll be logged in for several days before needing to be logged in again.
______________________________
Problem receiving blog comment emails? Try whitelisting the address. More info.
______________________________
A true expert in Elliott Wave FL 2
A true expert in Elliott Wave …You are a true expert in EW analysis. What you provide is not available anywhere and is priceless. Subscription on your services is the best thing I have ever done. Many thanks for your effort to make me a better investor. I now have more trust in my investment decisions. I hope you will continue the excellent work! —FL |
Tops in your field DZ 2
Tops in your field …You are tops in your field. Tried to follow Elliot Wave international for years. They were always behind the market. After discovering you, I perceive that you are an expert in reading the waves, which puts you way ahead of the rest of your peers. And you can read the Waves like you are reading tomorrow’s financial section. I pray you stay healthy. —DZ |
the real deal SM 2
The real deal …‘Educational, insightful and thorough market analysis for all levels of traders. It’s Elliott Wave at its best….Peter Temple is the real deal’ —SM |
Couldn’t be happier … KK 2
Couldn’t be happier …The analysis and insight you provide is simply amazing! I’ve been trading the futures and equity markets for well over thirty years and usually average around 5% monthly. Since joining your Traders Gold Service two months ago, that number has better than doubled. I couldn’t be happier.—KK |
Get an upper hand … JC 2
Get an upper hand in trading …Seeing all the different currency pairs and the wave structures and hearing you explain why this has to do that on a nightly bases gives one a upper hand when trading. Elliott Wave applies to all stock and indices and can be applied to any candlestick chart. If someone ask what you want for Christmas – Tell them a membership to Peter’s “Traders Gold!”—JC |
Rise above the rest … SM 2
Rise above the rest …I have only ever met a few people who, in their chosen fields (astrology, medicine, music, martial arts, technical analysis), rise above all the rest and you are one of them…you have ‘the gift’…and that’s why I’m a Trader’s Gold member. —SM |
The best of them JL 2
The best of them …Last couple of years, I subscribed to several ‘market traders’. You are by far the best of them and the personal contact is awesome. Daily and daily updates are very well written! Besides your expertise in EW, I also like your cycles analysis. Best investment I ever made! —JL |
Have not had a losing week RW 2
Have not had a losing week …I have been with Peter almost a year. The only thing that matters is have I made money with his service. I think I have finally turned the corner using Peter’s EW. I have not had a losing week in the last 5 months. Thanks Peter, for your amazing amount of hard work. —RW |
The Market This Week
Here's the latest daily chart of ES (emini futures)
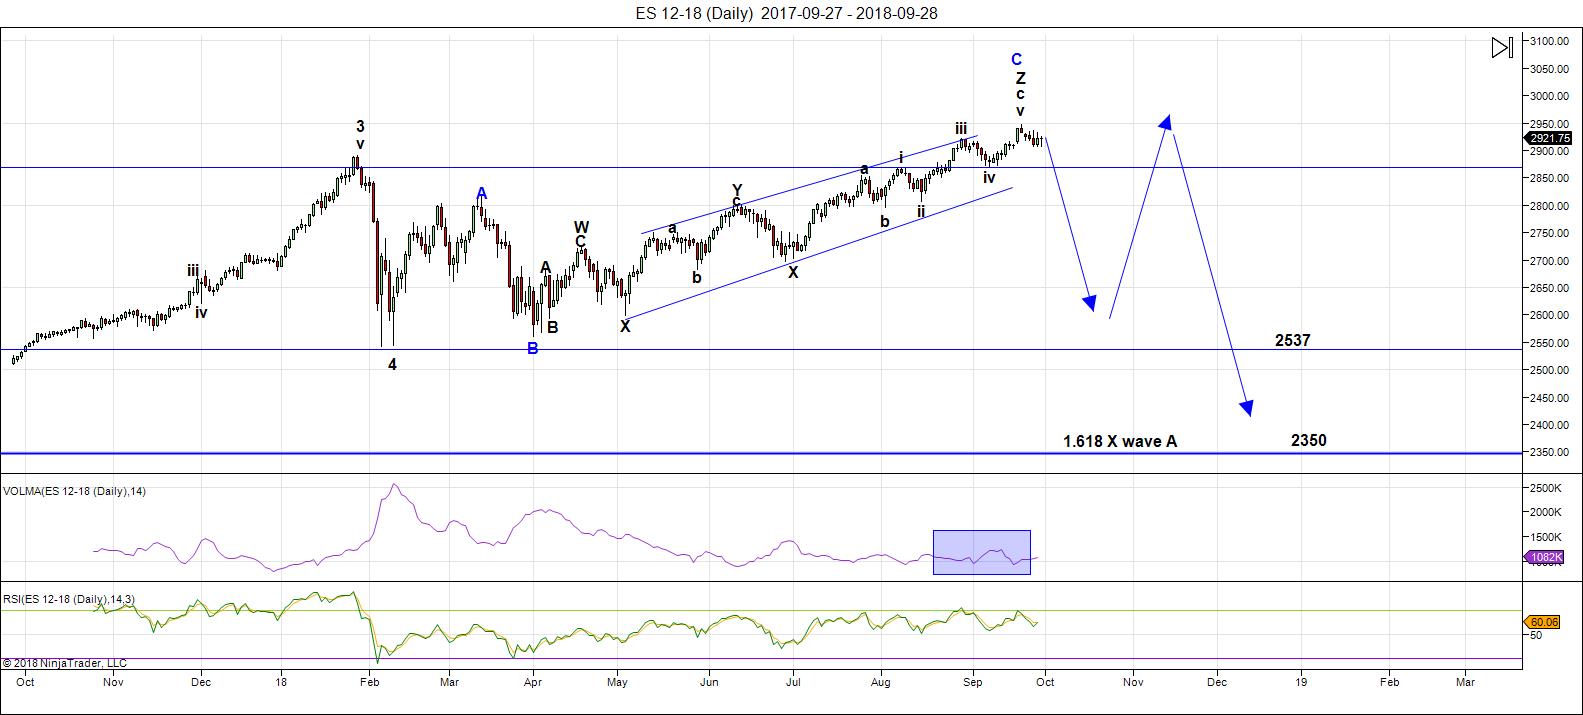
Above is the daily chart of ES (click to enlarge, as with any of my charts). Not much news for the US indices.
Even though we're at a new high this weekend, we're still waiting for the fifth of the fifth wave to end. It appears that on an hourly chart that we're in the final stages of an ending expanding diagonal, which is an ending wave. If that's the case, the upside is extremely limited.
My preference is for this continuation of fourth wave pattern (a remaining C wave down) is that of a expanded flat. However, technically, it could also be a running flat. At the present time, the B wave (that's the ABC wave up from about 2532) is longer than the A wave (marked as the 4th wave down from January 29, 2018). A regular flat registers as an expanded flat when the B wave is over 105% of the length of the A wave—ie, the B wave would need to reach above 2889, which is has done.
That means that the ES/SPX has multiple possibilities as to a target on the downside. Accuracy (in determining the most probable target) is going to depend upon both counting and measuring the waves to the downside. It's impossible to pick a downside target at this point in the process.
If we select all of wave 4 (on the chart—down from January 29) as the "A wave," then we're looking at an expanded flat. In that case, this outcome is the most probable:
- the C wave of a flat is typically 100 - 165% of the length of the A wave (so the target would be from 2532 - approx. 2360) - preliminary targets
There are other options:
- a running flat would trace out a C wave that is NOT longer than the A wave (in other words, it would not go to a new low). I regard this option as very low probability because it's extremely rare (I've only ever seen one of them). However, if NDX is tracing out a final impulsive pattern, its fourth wave should not be very deep, which may also restrict the length of the C wave in the SP500.
Volume: Volume ticked up with Wall Street back at their desks after the summer break. However, this week, it's headed back down. The lack of volume again foreshadows a turn.
Summary: We're waiting for a top in a B wave, which will result in a C wave to a new low. My preference is the larger structure (from January 29) represents an expanded flat. Once the c wave (down) is complete, expect a final fifth wave to a new high. That fifth wave up to a new high will be the end of the 500 year bull market.
___________________________
Trader's Gold Subscribers get a comprehensive view of the market, including hourly (and even smaller timeframes, when appropriate) on a daily basis. They also receive updates through the comments area. I provide only the daily timeframe for the free blog, as a "snapshot" of where the market currently trades and the next move on a weekly basis.
______________________________________
Sign up for: The Chart Show
Next Date: Wednesday, October 10 at 5:00 pm EST (US market time)

The Chart Show is a one hour webinar in which Peter Temple provides the Elliott Wave analysis in real time for the US market, gold, silver, oil, major USD currency pairs, and more. You won't find a more accurate or comprehensive market prediction anywhere for this price.
Get caught up on the market from an Elliott Wave perspective. You’ll also get Andy Pancholi cycle turn dates for the SP500 for the balance of the current month. There’ll be a Q&A session during and at the end of the webinar and the possibility (depending on time) of taking requests.
All registrants will receive the video playback of the webinar, so even if you miss it, you’ll be sent the full video replay within about an hour of its conclusion.


Lastly
look up over the past 30-40 years or so what the stock market has done from NOv 7th to Jan 16 each year . % wise it is a highly bullish period ( % of times the mkt has risen vs fallen )
This year I question this time frame , Nov 7 to jan 20th .
its a high % bullish period yet mars Uranus says it should be down
mercury venus says we start to turn up in a bullish move in mid oct .
they kind of wash each other so to speak . its tough to call this market by my timing methods at this juncture .
im keeping an open mind for now and my trading style will stay short term in nature .
Next year has a bullish bias though in my opinion based on all of what I look at
Are you watching watching this drama??!! YOWZA!! HeHe! What fun!!!!
And this is with NO SELLING!!!
What do you think is going to happen when the sleepy herd awakens to what the hell is REALLY going on?? Hyuk! Hyuk!
RUT is coiling sideways consolidating losses in this down-trend. We could be getting a pre-view of the fate of the other indices….
It seems to me that you get more reliable information about what equities are likely to do by keeping a sharp eye on the bond market….
Joe,
Thank you for commenting!
I am seeing signs of sheer panic in the futures markets.
It is hard to believe that anyone can take even a cursory look at those candles and not shake their head in amazement. It sure looks to me like somebody is absolutely in a state of complete terror and thrashing around like a bass on a line. Very ominous. Very ominous indeed!
Backing up the truck on long volatility short, medium, and long term. Will roll all positions forward to compound gains.
Hard to believe vol instruments trading red!!!!! Never look a gift horse…!!!!!!
Lots of signs showing that we are headed into a more severe decline than has been the case more recently. Still think 2792 is the target this market will seek. Russel and now Nasdaq have cleaner wave count lower. Ideally SPX and DOW should follow.
BOO-YAH!!
Monster trades all around on quick triples in vol and long puts.
Ringing the register and rolling profits forward. We are not even close to being done.
I am looking at the open interest in vol, leveraged short instruments, and even simple index puts and the whole world is fast asleep. I am even seeing idiotic posts on a few sites about how bullish the markets are. What exactly are these people looking at???!!! This is really unbeleiveable.
Have traders everywhere been so completely brian-washed as to not be able to see what is happening right under their very noses. 450 new NYSE new ATL and markets are bullish? God help us!
This could end up being worse that even I expected!!
Very much happy with the turn finally! Down to the targets now I hope. I’m aiming for 2500 area
Oh what beautiful moorrrrrrnnnnin’…!!!! 🙂
For the faint of heart, hear me now and believe me later. Vol holocaust II s just getting started. I am still shaking my head in absolute consternation at the price I was able to get away with for VXX calls when those cretins smashed prices down this morning. There was a time when a thousand traders would have have handed them their damned heads on a platter if they pulled a stupid stunt like that. The fact that they even tried it tells you that there are NO TRADERS left in this screwed up market. Very bad!!!! How on earth are we going to get a bottom if there is no one left to buy to cover?? You tell me folks…you tell me…!!!
Peter’s title for this week’s thread was prescient.
Things sure are quiet around here.
I guess everyone is busy raking in those profits, huh? 😎
Foreshadowing at best, perhaps, as we don’t yet have a top to the B wave, unfortunately.
Indeed! Seeing a few counts of a fourth wave underway with a fifth to come before the deeper dive. There is tremendous technical damage already done so any new high will literally come on mere fumes of razor thin breadth!
Hedging long long vol positions in short term with VIX 15.00 strike puts expiring next Wednesday.
Have a great weekend everyone!
See every one at the Chart Show next Wednesday for a road map from the Master! 🙂
Verne
there is many traders in this market believe it or not .
Most of these traders though are not human
Lol! I stand corrected Joe. You are indeed correct!
A new weekend post is live at: https://worldcyclesinstitute.com/danger-under-the-hood/
I think no body has nailed this move correctly, everyone was expecting a further rise and then C wave selloff…now we need to see this 62 percent retrace holds true or not. If not its really impossible to predict
This website is for educational purposes relating to Elliott Wave, natural cycles, and the Quantum Revolution (Great Awakening). I welcome questions or comments about any of these subjects. Due to a heavy schedule, I may not have the time to answer questions that relate to my area of expertise.
I reserve the right to remove any comment that is deemed negative, is unhelpful, or off-topic. Such comments may be removed.
Want to comment? You need to be logged in to comment. You can register here.