
The Dip — A Game-Changer for Me
“What really sets superstars apart from everyone else is the ability to escape dead ends quickly while staying focused and motivated when it really counts.” — Seth Godin
“Winners quit fast, quit often, and quit without guilt—until they commit to beating the right Dip for the right reasons. In fact, winners seek out the Dip. They realize that the bigger the barrier, the bigger the reward for getting past it. If you can become number one in your niche, you’ll get more than your fair share of profits, glory, and long-term security.”
I read this little book when I was learning the Elliott Wave Principle, which took me years to master, because of the errors and omissions in the book, and the seeming inability of the folks at Elliott Wave International to analyze waves properly (argh!). It was a frustrating time.
There were many times where I wanted to just give up. That’s “the Dip.” It’s the point in any major undertaking (usually three quarters of the way there) where psychologically, you hit a low point and are on the verge of quitting altogether.
Many never make it to their goal; it separates the “stars” from the also-rans. As they say, we don’t remember who came in second.
The “superstars,” the experts we look up to in life, got there because they powered through that “dip” in motivation and made it to the end, undergoing many frustrating challenges along the way.
We’ve had nine months in the US indices of a slowly rising B wave, but it is indeed almost over. Just a little more patience will pay off in a big way.
It’s been a frustrating wait because the rally in ES has been one that has almost died several times, but suddenly comes back to life every time. Frustrating!
But the Elliott Wave Principle, either through counting waves, or through fibonacci measurements, always alerts as to when the turn will come. Time, as I’ve said many times before, is not something EW does well. So … we wait. The signals for the coming turn are clear; however, the shorter-term wave structure in the US indices is not as clear as I’d like it to be.
In any case, other asset classes are also signalling a turn is imminent. This is going to be a major turn of just about everything. It will be worth the wait.
In terms of my work learning Elliott Wave, I found that I had to try to disprove it in order to prove it in every instance. It took me several years to go through the process, figuring out when I was wrong, why I was wrong. That process led to additional rules I discovered and guidelines in the book that I ultimately figured out were dead wrong. For example, truncations. I have not been able to find one in back-testing through a hundred years of the DOW data.
I lost a fair amount of money along the way, but I was determined to either prove it worked, or find a flaw that would cause me to abandon it. I was determined to master this particular niche. I’m still working towards that end. I say that because, with the market, there’s always some nuance or subtle pattern that you end up refining in some way. But the work I did has paid off.
I have not been able to find an example of how Elliott Wave fails to adhere to the set of rules that I’ve adapted from the Elliott Wave Principle book. Most analysts aren’t willing to put in this kind of work. I am, thanks to Seth Godin and The Dip.
______________________________
Update on NDX
NDX really didn’t advance this week; it still looks like we may have an ending diagonal in the works to finish off the 3rd wave. The measured target for the third wave to the upside is 7900, but I’m unsure if we’ll actually make it that high.
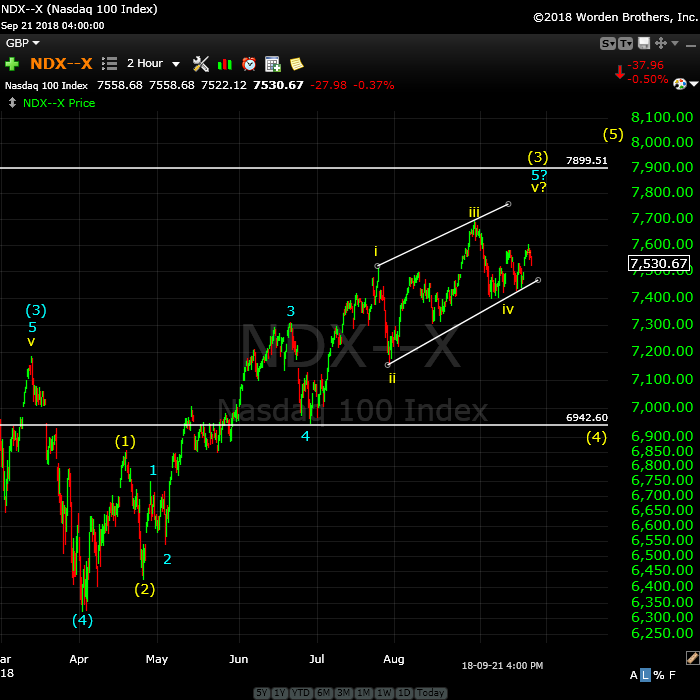
Above is the two hour chart of NDX (Nasdaq 100).
There at least a couple of ways to label this final set of waves up to the top of wave 3. With the sideways movement this past week, and the fact that NDX (and NQ) did not break below the lower trendline, leads me to label this pattern as an ending diagonal. If so, expect a final rally up to the upper trendline. We could get a “throw-over” (a spike above the upper trendline) but it’s not required to end the pattern.
On the other hand, if we break down below the lower trendline, then we’re in the fourth wave down and the third wave would likely be complete (I can also count the wave up as having traced out a full five waves of the third).
Keep in mind that at tops, often the final waves start to compress and often doing trace out their full expected lengths.
The larger fourth wave should come down to the previous fourth wave somewhere around the 6942 area. It cannot drop into the area of wave (1) or it would negate the impulsive wave and possibly lead to an ending diagonal.
The fourth wave down and then a final fifth wave to a new high are the final two waves before the top of the 500 year rally. After the final 5th wave up in NDX is complete, we’ll turn down into the bear market I’ve been talking about here for the past three years!
______________________________
Elliott Wave Basics
There are two types of Elliott wave patterns:
- Motive (or impulsive waves) which are “trend” waves.
- Corrective waves, which are “counter trend” waves.
Motive waves contain five distinct waves that move the market forward in a trend. Counter trend waves are in 3 waves and simply correct the trend.
All these patterns move at what we call multiple degrees of trend (in other words, the market is fractal, meaning there are smaller series of waves that move in the same patterns within the larger patterns). The keys to analyzing Elliott waves is being able to recognize the patterns and the “degree” of trend (or countertrend) that you’re working within.
Impulsive (motive) waves move in very distinct and reliable patterns of five waves. Subwaves of motive waves measure out to specific lengths (fibonacci ratios) very accurately. Motive waves are the easiest waves to trade. You find them in a trending market.
Waves 1, 3, and 5 of a motive wave pattern each contain 5 impulsive subwaves. Waves 2 and 4 are countertrend waves and move in 3 waves.
Countertrend waves move in 3 waves and always retrace to their start eventually. Counrtertrend (corrective waves) are typically in patterns — for example, a triangle, flat, or zigzag. Waves within those patterns can be difficult to predict, but the patterns themselves are very predictable.
Fibonacci ratios run all through the market. They determine the lengths of waves and provide entry and exit points. These measurements are really accurate in trending markets, but more difficult to identify in corrective markets (we’ve been in a corrective market in all the asset classes I cover since 2009).
To use Elliott wave analysis accurately, you must be able to recognize the difference between a trend wave (motive) and a countertrend wave (corrective). There’s very much more to proper Elliott wave analysis, but this gives you the basics.
____________________________
Registration for Commenting
Want to comment? You need to be logged in to comment. You can register here.
If you register, it protects your information. It also allows you to comment without filling in your information each time. Once you’re registered, simply go to the home page and click on the login link top right in order to log yourself in. Usually, you’ll be logged in for several days before needing to be logged in again.
______________________________
Problem receiving blog comment emails? Try whitelisting the address. More info.
______________________________
Have not had a losing week RW 2
Have not had a losing week …I have been with Peter almost a year. The only thing that matters is have I made money with his service. I think I have finally turned the corner using Peter’s EW. I have not had a losing week in the last 5 months. Thanks Peter, for your amazing amount of hard work. —RW |
Tops in your field DZ 2
Tops in your field …You are tops in your field. Tried to follow Elliot Wave international for years. They were always behind the market. After discovering you, I perceive that you are an expert in reading the waves, which puts you way ahead of the rest of your peers. And you can read the Waves like you are reading tomorrow’s financial section. I pray you stay healthy. —DZ |
The best of them JL 2
The best of them …Last couple of years, I subscribed to several ‘market traders’. You are by far the best of them and the personal contact is awesome. Daily and daily updates are very well written! Besides your expertise in EW, I also like your cycles analysis. Best investment I ever made! —JL |
the real deal SM 2
The real deal …‘Educational, insightful and thorough market analysis for all levels of traders. It’s Elliott Wave at its best….Peter Temple is the real deal’ —SM |
Get an upper hand … JC 2
Get an upper hand in trading …Seeing all the different currency pairs and the wave structures and hearing you explain why this has to do that on a nightly bases gives one a upper hand when trading. Elliott Wave applies to all stock and indices and can be applied to any candlestick chart. If someone ask what you want for Christmas – Tell them a membership to Peter’s “Traders Gold!”—JC |
Rise above the rest … SM 2
Rise above the rest …I have only ever met a few people who, in their chosen fields (astrology, medicine, music, martial arts, technical analysis), rise above all the rest and you are one of them…you have ‘the gift’…and that’s why I’m a Trader’s Gold member. —SM |
Couldn’t be happier … KK 2
Couldn’t be happier …The analysis and insight you provide is simply amazing! I’ve been trading the futures and equity markets for well over thirty years and usually average around 5% monthly. Since joining your Traders Gold Service two months ago, that number has better than doubled. I couldn’t be happier.—KK |
A true expert in Elliott Wave FL 2
A true expert in Elliott Wave …You are a true expert in EW analysis. What you provide is not available anywhere and is priceless. Subscription on your services is the best thing I have ever done. Many thanks for your effort to make me a better investor. I now have more trust in my investment decisions. I hope you will continue the excellent work! —FL |
The Market This Week
Here's the latest daily chart of ES (emini futures)
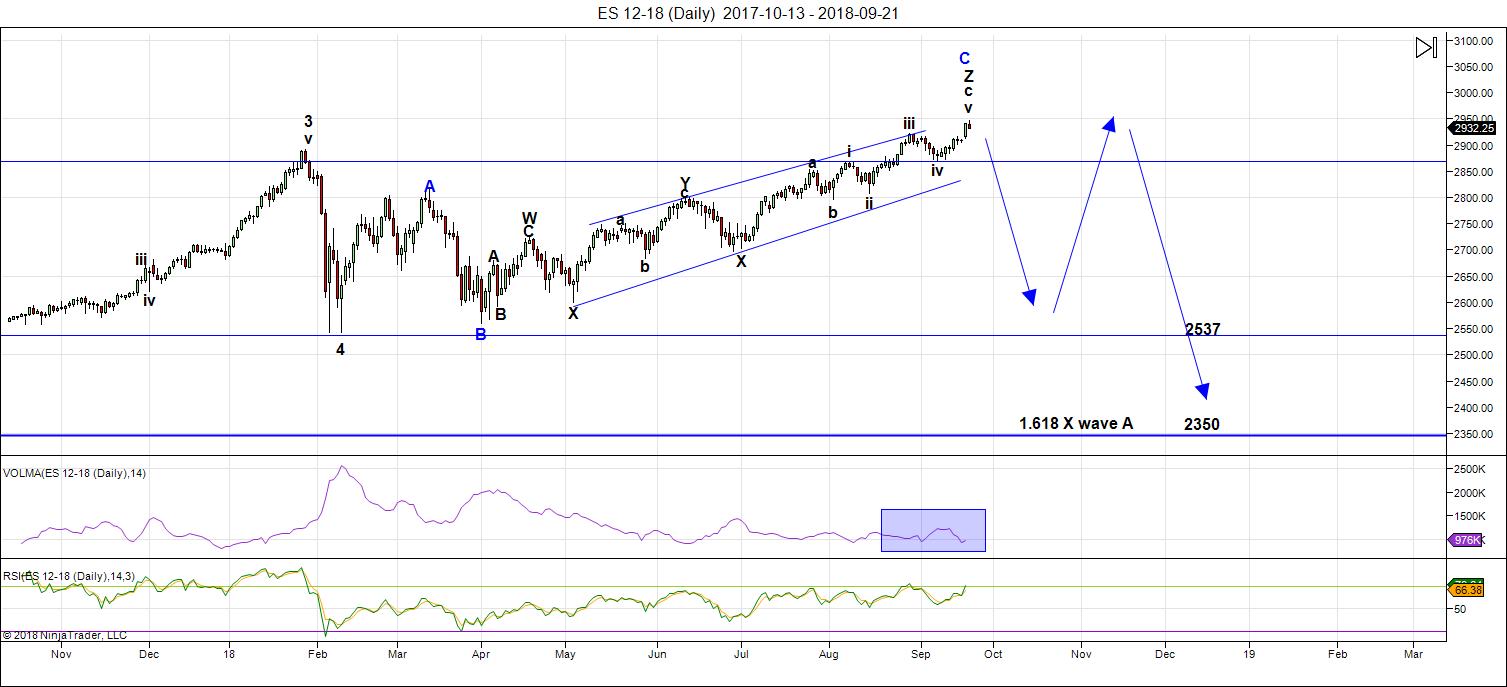
Above is the daily chart of ES (click to enlarge, as with any of my charts).
Even though we're at a new high this weekend, we're still waiting for the fifth of the fifth wave to end. It should end this week; there are signs from all the other asset classes I cover that we're going to have a major turn of just about everything.
The big change this week was the movement of the US dollar, which did not bottom as a wave in three as it threatened to do, but dropped to a new low. That sent SPX higher, in a larger wave than I expected, but still the final wave.
With all the events coming this week (full moon, Fed announcement), I would expect the turn to finally take hold. My money is on the Federal Reserve announcement, which tends to be a magnet and usually results in a turn the following day — the long-awaited C wave.
My preference is for this continuation of fourth wave pattern (down) is that of a expanded flat. However, technically, it could also be a running flat. At the present time, the B wave (that's the ABC wave up from about 2532) is longer than the A wave (marked as the 4th wave down from January 29, 2018). A regular flat registers as an expanded flat when the B wave is over 105% of the length of the A wave—ie, the B wave would need to reach above 2889, which is has done.
That means that the ES/SPX has multiple possibilities as to a target on the downside. Accuracy (in determining the most probable target) is going to depend upon both counting and measuring the waves to the downside. It's impossible to pick a downside target at this point in the process.
If we select all of wave 4 (on the chart—down from January 29) as the "A wave," then we're looking at an expanded flat. In that case, this outcome is the most probable:
- the C wave of a flat is typically 100 - 165% of the length of the A wave (so the target would be from 2532 - approx. 2360) - preliminary targets
There are other options:
- a running flat would trace out a C wave that is NOT longer than the A wave (in other words, it would not go to a new low). I regard this option as very low probability because it's extremely rare (I've only ever seen one of them). However, if NDX is tracing out a final impulsive pattern, its fourth wave should not be very deep, which may also restrict the length of the C wave in the SP500.
Volume: Volume ticked up with Wall Street back at their desks after the summer break. However, this week, it's headed back down. The lack of volume again foreshadows a turn.
Summary: We're waiting for a top in a B wave, which will result in a C wave to a new low. My preference is that this structure represents an expanded flat, but there are other options. Once the c wave (down) is complete, expect a final fifth wave to a new high. That fifth wave up to a new high will be the end of the 500 year bull market.
___________________________
Trader's Gold Subscribers get a comprehensive view of the market, including hourly (and even smaller timeframes, when appropriate) on a daily basis. They also receive updates through the comments area. I provide only the daily timeframe for the free blog, as a "snapshot" of where the market currently trades and the next move on a weekly basis.
______________________________________
Sign up for: The Chart Show
Next Date: Wednesday, October 3 at 5:00 pm EST (US market time)

The Chart Show is a one hour webinar in which Peter Temple provides the Elliott Wave analysis in real time for the US market, gold, silver, oil, major USD currency pairs, and more. You won't find a more accurate or comprehensive market prediction anywhere for this price.
Get caught up on the market from an Elliott Wave perspective. You’ll also get Andy Pancholi cycle turn dates for the SP500 for the balance of the current month. There’ll be a Q&A session during and at the end of the webinar and the possibility (depending on time) of taking requests.
All registrants will receive the video playback of the webinar, so even if you miss it, you’ll be sent the full video replay within about an hour of its conclusion.


Silver Futures by my data are back up near the prior high
of a few days ago despite the usa dollar rally .
My Main argument on silver and gold
was the silver gold ratio and that silver must
out perform gold in order to give me confidence
the ratio has done what i have expected and silver
has been out performing gold .
that is all i care about at this point .
ANOTHER..market gift..buying the dip again..hallelujah!
This has been one of the most profitable markets in a long..long time. Thank you Mr Market..keep it up!
I think the safety of Treasuries very much depends on your time frame Joe but your point is well-taken. If the expectation of a deflationary depression is correct, the dollar will strengthen and so will Treasuries, at least for the next few years. There is no question that bonds (U.S. ) will be paid in full at maturity; the only question will be what they are worth if we end up with hyperinflation, which we will ultimately..
Interesting comment about being short the market. How do you know the exchanges will pay?
The recent article on Zerohedge by Chris Cole was really sobering. He points out how an assumption of market liquidity could be the most dangerous assumption traders are making about the coming market storm.
Treasury funds are headed up, yields down. I’ve been predicting the turn for a couple of months and looking at bonds this morning, it looks like they’ve turned (or are starting to), so the flight to safety is beginning. Prechter predicted treasuries are the safest place to be after the crash, but they may end up with slightly negative yields. However, it will be safer than everything else.
It amazed me that the Fed raised rates this week, when they’re clearly heading down. Another example of their stupidity. I wouldn’t count on higher rates going forward.
Peter T, does a negative bond yield imply the bond face value could be less at maturiy, possible even going to zero, and worse….”GASP!”…the bond holder actually ( at least theoreticall ) OWING money at maturity???!!!!
If you’re talking about corporate and government bonds, nothing will be safe. Many went bankrupt in the 30s and this downturn is going to be far worse. US treasuries should be the safest. In terms of them, yields may collapse and even turn slightly negative, but unless the US defaults the principle should be Ok. I’d be investing in mattress companies …. lol. Or just a large one with a lock on it. I don’t think much is safe outside cash for at least five years. After that, not sure.
To a large extent, this will be new territory we’re going into. And governments will try just about anything to stay afloat.
They are giving themselves room to ease as they know what is coming.
Verne
if the financial institution you have your money with folds it
is doubtful you will get your money back . ( My thoughts anyways )
I have serious doubts about all gov bonds including us treasuries .
They changed the rules a few years back in regards to money market funds
which can now go negative . yes cash in your account can lose money .
Any stock can go to zero
it will become extremely difficult to find any safe spot to put your money
we are beginning to see this play out today .
what ever happend to the customers money at MF Global ?
Former chairman and CEO of MF Global and former New Jersey Governor Jon Corzine testifies during a hearing before the Oversight and Investigations Subcommittee of the House Financial Services Committee December 15, 2011 on Capitol Hill in Washington, DC. The hearing was to examine the collapse of MF Global. (Photo by Alex Wong/Getty Images)
Former chairman and CEO of MF Global and former New Jersey Governor Jon Corzine testifies during a hearing before the Oversight and Investigations Subcommittee of the House Financial Services Committee Dec. 15, 2011 on Capitol Hill in Washington, DC. The hearing was to examine the collapse of MF Global. (Photo by Alex Wong/Getty Images)
There is a critical forgotten story behind the recent announcement of a $5 million fine that ex-MF Global CEO Jon Corzine will pay, for having led a firm that used over $1 billion of its customers’ money in order to cover its own losses.
The forgotten story pertains to psychological pitfalls and bad risk management, and its moral provides a lesson that the entire financial services industry needs to take to heart, especially as we move into the era of President Trump.
A quick glance at the past week’s coverage of the Corzine fine, for example in The New York Times or The Wall Street Journal, makes no mention of psychology or risk management. Instead, the focus is on whether Corzine gave direct instructions that customers’ money be used, or instead simply headed a firm where such actions took place on his watch.
Michael Lewis’ much heralded new book, The Undoing Project, chronicles the history of psychologists Daniel Kahneman and Amos Tversky who brought many of these pitfalls to light. My book Behavioral Risk Management explains how psychological pitfalls can infect risk management processes in important ways.
There is an important backstory that occurred before MF Global used customers’ money, went bankrupt, and initiated a long process to recover what customers had lost. We can pick up the backstory in 2008 after the firm incurred losses stemming from an unfavorable incident that involved an authorized trading incident. The board hired Corzine in 2010. However, two years earlier, in 2008, it had hired its chief risk officer Michael Roseman.
YOU MAY ALSO LIKE
Audi BrandVoice
A City For Sensory-Seekers: Miami Stimulates With Its Skyline and Its Science
MF Global’s business was commodity brokerage and its customers were farmers, hedge funds, and other customers who traded commodity contracts. The losses that eventually drove MF Global into bankruptcy stemmed from high risk bets on European sovereign bonds that Corzine made as he swung for the fences. Corzine bet big that the bond issuers would not default.
https://www.forbes.com/sites/hershshefrin/2017/01/07/what-the-sad-saga-of-mf-global-teaches-us-to-do-differently/#76d323cb4fa9
Quite right Joe. It is a dirty little secret that money market funds can actually “break the buck”. That is really incredible when you think about it.
Joe, the MF Global customers were all very quietly made whole.
It is nothing short of mind-boggling that Corzine did not go to jail.
He raised and gave a lit of dough to politicians so I guess that put him above the law.
The issue of finding a safe place to hold cash does become an issue in 3 of 3 and also around 5 of 3 down. In case this is actually a multi year decline, then treasuries may be the safest place all the way from 1 of 1 to 2 of 3. I do expect rates in the US to go negative in the coming 3-5 years. The 30y rate in such an environment can go to around 0.75%. If you buy 30y bonds now @ 3.20, a move to 0.75% will return about 60% on your invested capital. Plus 5 year of carry – so say 15%. A total return of around 75%. There will be very few things that will provide that kind of return over the next 3-5 years. I would want to buy Gold as well for a similar environment, however, Gold somehow take some time to take off. You could have bought Gold in 2008 AFTER the crash at reasonable prices. Not bonds. Bonds have to be bought about a year ahead of the crash. There is a 35 year trend line resistance on the 5y5y forward rate (corresponds to about 3.28% on 30y treasury). That trendline won’t be broken easily. I bought 30y treasuries over the week at average price around 3.20%
I wouldn’t expect a lot from gold in the medium term. It will be lower in 5 years.
My SPY 290 calls at open have nearly doubled. Buying EVERY dip..working like a snake charmer!
Theres my double..Thank you Mr Market! Stop in at 85% gain..gonna let her ride.
Moving stop up to 100% gainer..still looks like SPY got some more legs!
In at 61 pennies..out at 1.22..no bad for 1.5 hours of work. Thank you Mr Market..the gift that keeps on giving!
Negative interest rates will wipe out pension funds which will create a deflationary spiral.
the united states has the baby boomer issue to deal with.
the only way i see the treasury bond market surviving is if the government takes over everyone 401k and forces everyone into treasuries .
you wont have any money you could call yours under that scenario
Gold and silver in my opinion are just commodities. im bullish at the moment
based on the silver gold ratio which is doing what it should .
I do not know if silver becomes the new dollar so to speak . i don’t know what foreigners wish to do with their money to hedge us dollar risk.
i do know that when anyone is massively in debt the bank will either deny
your loan application or raise your interest rate to give you that loan.
All governments are in debt and will be competing for money to re fi their debt.
it is the gov debt that is the problem much more so than the consumer.
we don’t live in the same world anymore .
what happens in Europe after draghi retires next year ??
There is no way the ECB can stop its bond purchases . There will be no buyers
we will know soon enough though how this is going to turn out .
My bet is higher rates and any QE will be devoted to keeping the governments afloat at best. More taxes and higher rates will slow the economy and because
politicians wont change their ways it ends up pretty ugly .
Who is after Trump ??? Who would want to be the president of the usa ??
I doubt it will be anyone with a brain who really has an interest in what is the right thing to do .
Gov protects Gov and its government pensions .
More taxes and slow economy , Everything gets unwound .
Peter has touched on some of this yet im not quoting him
Joe – Negative interest rates will have the same effect on Pensions as it has had in Europe and Japan. Their unfunded liability will go up as stocks and rates decline and they govt will have to put in more funds over time which will be achieved by raising taxes. During that period, it is very likely the CBs around the major countries will own 100% of all govt debt. Price of treasury bonds will sky rocket in such an environment. The way CBs get in trouble is not by expanding balance sheet – it is by ending in a negative income scenario. The Fed’s remittance to treasury has been falling as they have been raising short term rates. If short term rate is increased to 3.5%, the Fed’s income will go negative. That’s pretty much a hard cap on Fed funds rate. I think they will stop hiking well before that. With every recession, that hard cap will keep coming down and will eventually hit 1%. After that, something innovative will be required to exit a deflationary cycle. We have enjoyed the benefits of fiat currency from Bretton Woods 2 to now. The time to pay for it is coming soon.
Adding some Nov QQQ 186 calls per SIR PETERS forecast of new high for N100
If the cash dow closes at the highs of todays trading and
stays below 26657.01 ill look to take a short position in the overnight
trading Sunday . Key resistance still stands at 26606.09 and must not even
be touched if what i see playing out has Merritt.
26657.01 is key for now though as i see it .
a perfect close for today would be in the area of 26539-25537.
if todays close does actually fall into that area and the market gaps
down on the open then ill target 26242 as a minimum downside for
monday.
Im done for today.
have a great weekend everyone
On this day in 1869 ?? what happened ?
Imma loading up the truck on my longs for QQQ breakout per SIR PETER..said N100 should hit 7600..to 7900. Might be 5% more upside.. I would be very careful shorting this extremely bullish market.
cash dow
correction
26606.09 major resistance and not even touched
26557.01 really should not be broken.
26519-26537 the ideal close for today
done …………
My 26.7K target was hit..next up dow 27.5K IMO.
Buying DIA Oct 12 265 strike puts for 2.00
Imma taking opposite side hardy har ha..i think you will be right but not til mid terms in Nov. Should be up til Nov.
Yer’ On!!! 😁
forensic psychologists would have a field day with some of the posters on this free blog…their incessant need for attention speaks volumes about their character (or lack thereof)…one may consider it a microcosm of what is occurring in our broader society…maybe just another indicator of the cycles frequently referenced by our host!
I personally like the variety of opinions..all helping each other trade..we all have same goal..to make money.
I am so glad my parents taught me manners, including keeping my big mouth shut when I had nothing edifying to others to contribute! 😑
You do a great job of building others up Mr Verne..really like your trading ideas..keep it up!
Why, thank you Sir Charles! 🙂
Adding new trade CURE to capitalize..on strong health care sector.
Was able to scalp another 50% on SPY 290s on drop below lower bolinger band and pop back up.
This lines up with SIR PETERS projection..
https://www.investopedia.com/news/investors-face-worst-returns-10-years
Once this bull dies..look out below.
It seems clear to me that buying pattern today is designed to intimidate trades on the short side. This probably means another sharp move down prior to a move higher. These folk are nothing, if not predictable, lol!
I think youre right..i did have 2 good buy the dip trades today..but they seem more like a suckers rally to me.
Yep! So long as you are nimble you can really stick it to the banksters. It would seem you and I are the only ones on the forum up for “Hit & “Run” trades! 😉
Hi Peter T
I am reviewing a paper and the authors have a very interesting thesis on global debt and how it will impact interest rates. I know we are both expecting a deflationary onset that should result in falling interest rates. These guys have a bit of a different take and are arguing that the coming wave of global bond defaults is instead going to put upward pressure on rates not because of the usual response of central banks to inflationary forces, but because rising defaults is going to result in fear of bond holders over return OF, instead of return ON, capital. It is a very interesting take and I wondered what your thoughts were about that thesis. Thanks!
Mr Verne..logic would assume that if defaults are rapidly rising..then banks and lending institutions would subsequently increase rates to offset losses and account for new levels of risk. And in the secondary market..risky assets get marked down and yields rise.
Yes, that does make sense. Not only to off-set realized losses, but more importantly, the FEAR, of future losses. We are not accustomed to the idea of rising rates in a deflationary environment but we have also never had global debt this massive and this much at risk either. We are certainly living in interesting times. Thanks for your input Sir Charles! 🙂
Verne,
I will have to look at much later today. I’m in the midst of my analysis. My predictions in this area are purely technical, backed up by history. There are lots of ways to justify just about anything otherwise. But I’ll keep an open mind and give it a read-through.
Thanks so much Peter!
GS big picture looking like head and shoulders to and it has
now broken its neckline.
somewhere 200 ish next ?
All major banks have finished a 5 wave rally and an “A” and a “B” of correction. We are headed down in “C” and even a simple A = C measure take these stocks way way lower than here. On a monthly chart, long term support trendline crosses 38% retrace sometime in mid 2020. I think that’s when the trend will truly turn lower. Till then we are likely to chop around between here and 190.
A new weekend post is live at: https://worldcyclesinstitute.com/tick-tock-a-top-is-near/
This website is for educational purposes relating to Elliott Wave, natural cycles, and the Quantum Revolution (Great Awakening). I welcome questions or comments about any of these subjects. Due to a heavy schedule, I may not have the time to answer questions that relate to my area of expertise.
I reserve the right to remove any comment that is deemed negative, is unhelpful, or off-topic. Such comments may be removed.
Want to comment? You need to be logged in to comment. You can register here.