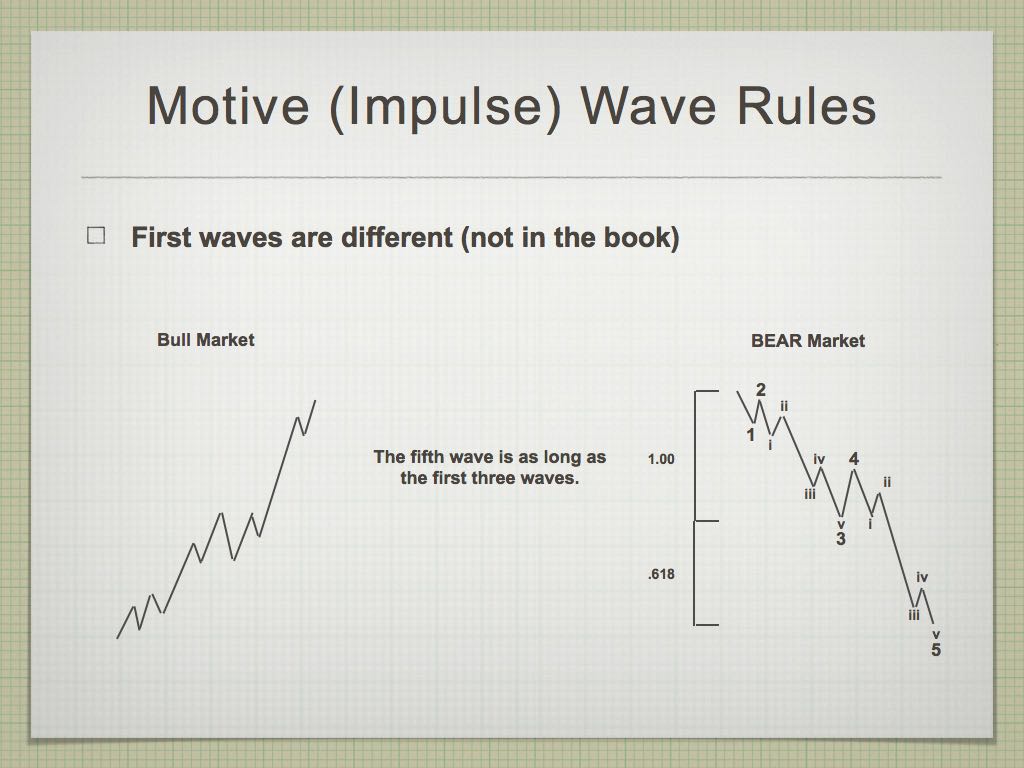
The structure of first waves of a five wave sequence typically look different than the third and fifth waves. I’m referring here to the first wave of a new trend. They tend to look very much like a three wave countertrend move, and as a result, are very difficult to analyse. The key is to measure the relationship of the first three waves to the fifth wave.
You will not find this difference in wave structure identified in The Elliott Wave Principle. This comes from over 20,000 hours of watching the market. It’s something I see Elliott Wave International (Bob Prechter’s group) get wrong time and time again.
In the diagram on the right, you can see a first wave down in a bear market. The length of the first three waves should measure out to the length of the fifth wave (measured from the apex of the fourth wave to the end of the fifth. Another way to measure this is to use an fibonacci retracement or extension tool and measure the length of the first three waves together as 1.00. The 1.618 extension then should determine the ultimate length of the entire first wave.
Another key determinant of first waves is that they retrace to the previous fourth wave (of one lesser degree) which travelled in the opposite direction.
You can see looking at the diagram on the right that you actually have two distinct waves with the first wave, based upon their subwaves.


