
(April 27, 2015) The US indices continue to grind higher seemingly without end, but they’re getting weaker under the surface! More signs of a top are showing up. But let’s look at the Elliottwave count for the major US indices.
We’ve been in this ending diagonal for a long time. Each of the indexes sports the same configuration. In Elliottwave, once you’ve had 5 waves up, that’s the end of the trend. We’re looking for a final missing subwave up.
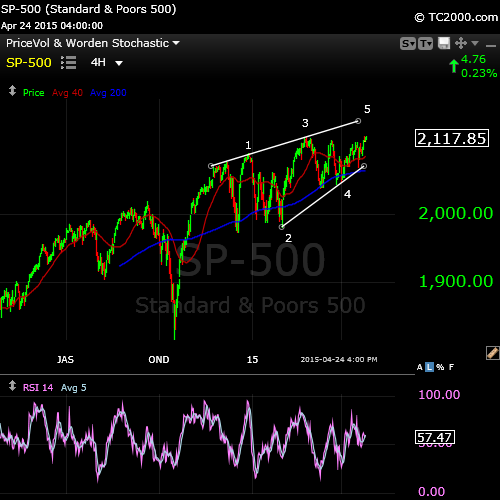
You can see the missing wave in the SP (it may be complete today – April 27, 2105).
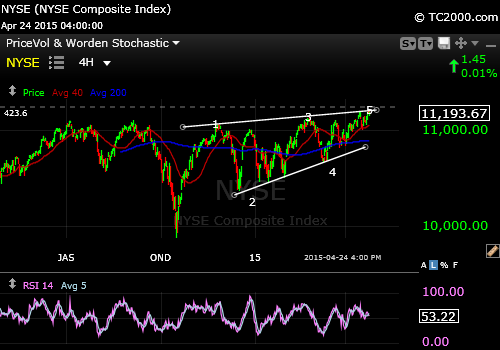
The NYSE above looks to be complete.
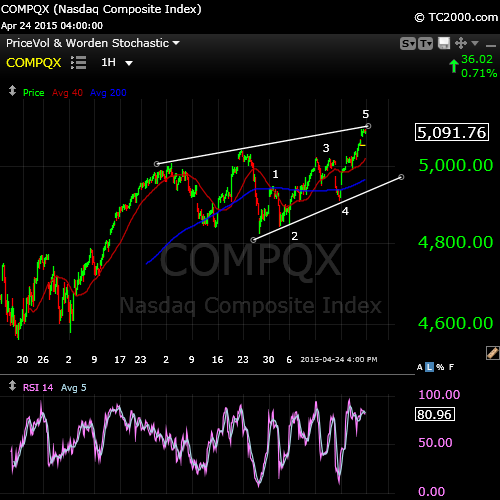
The Nasdaq COMP has also done 5 up and it trying to do a “throw-over,” a spike up above the trendline.
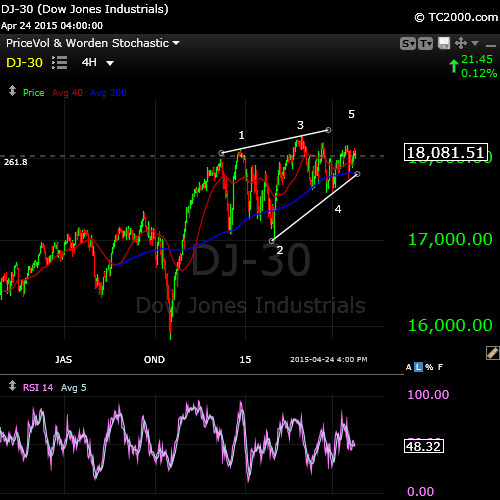
Finally, the DOW is severely lagging and may not make it. It also has a questionable count and could have done 5 waves up already. That would make the current wave a 2nd wave, ready to head down, but would put the indices out-of-whack with each other.
Below is the Elliott Wave ending diagonal pattern. To a non EW trader, it’s simply a wedge (as per Murphy’s “Technical Analysis of the Financial Markets”).
 |
Cycles Analysis
What’s recent news is that I’ve recently taken on a position as the Executive Director of the Foundation for the Study of Cycles. This is the organization that was founded by Edward Dewey in 1941. We’re in the final beta testing phase of a major upgrade to “Techsignal 9” our Cycles Analysis program.
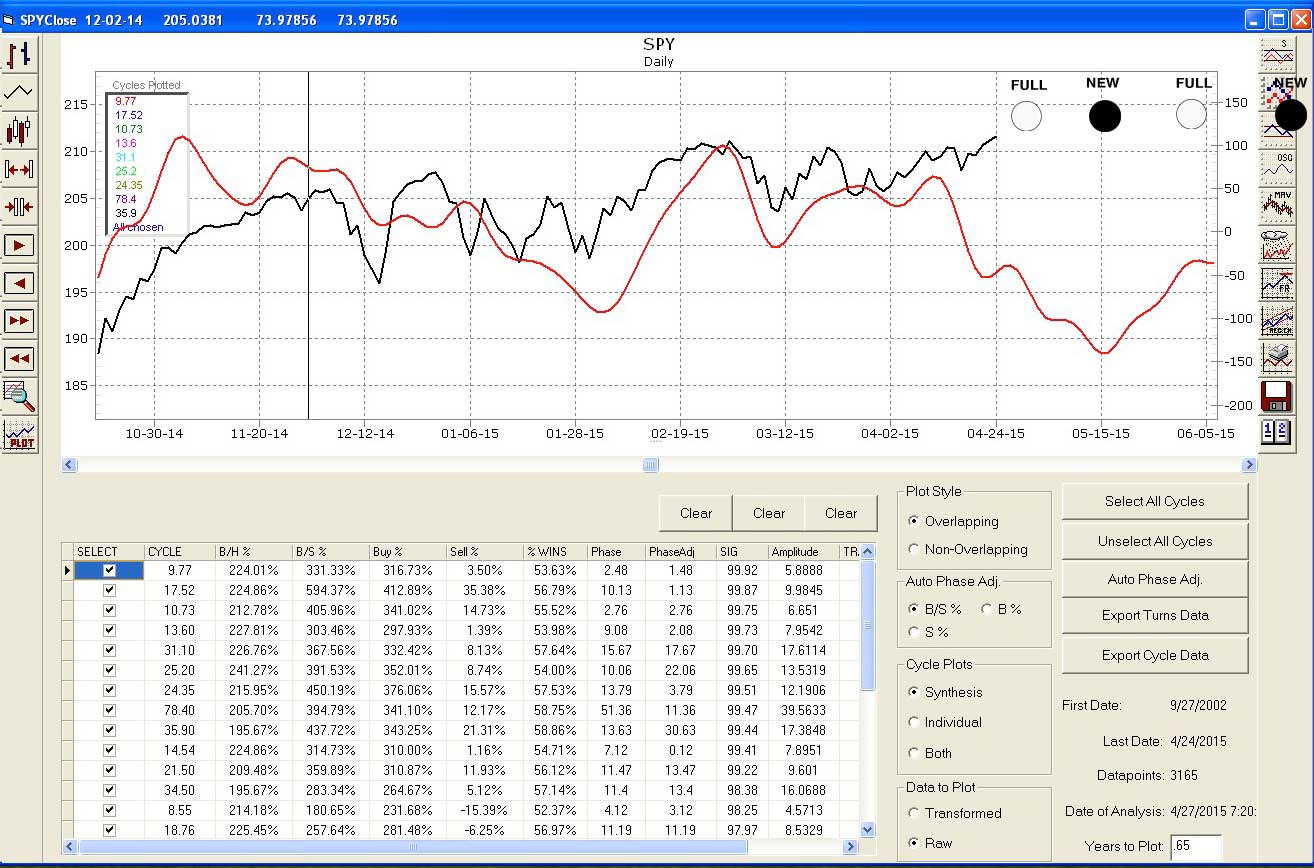
This is a predictive analysis program that takes any asset you select and looks back to determine the cycles (turns) that determine its movement. It then finds the best fit of that cycle to the current price pattern and predicts the movement going forward. It’s proven to be highly accurate. It shows the cycle SPY cycle heading down now (I ran this this morning – April 27) and this aligns with the Elliottwave analysis (I’ve overlain the moons myself).
You can see the incredible fit the cycles analysis algorithm has to the actual price line. The black line here is the actual SPY price chart. The red line is the predictive cycle. You can see how it projects us heading down now.
If you’d like information on how to acquire this leading edge software, please email me here. I can get you a special price, if you’re interested in the final beta version: peter@worldcyclesinstitute.com. The final version should be out in early May.
Planetary Signals
At the Foundation, we’re also in the late stages of a planetary signal service. There is nothing like this anywhere else, believe me.
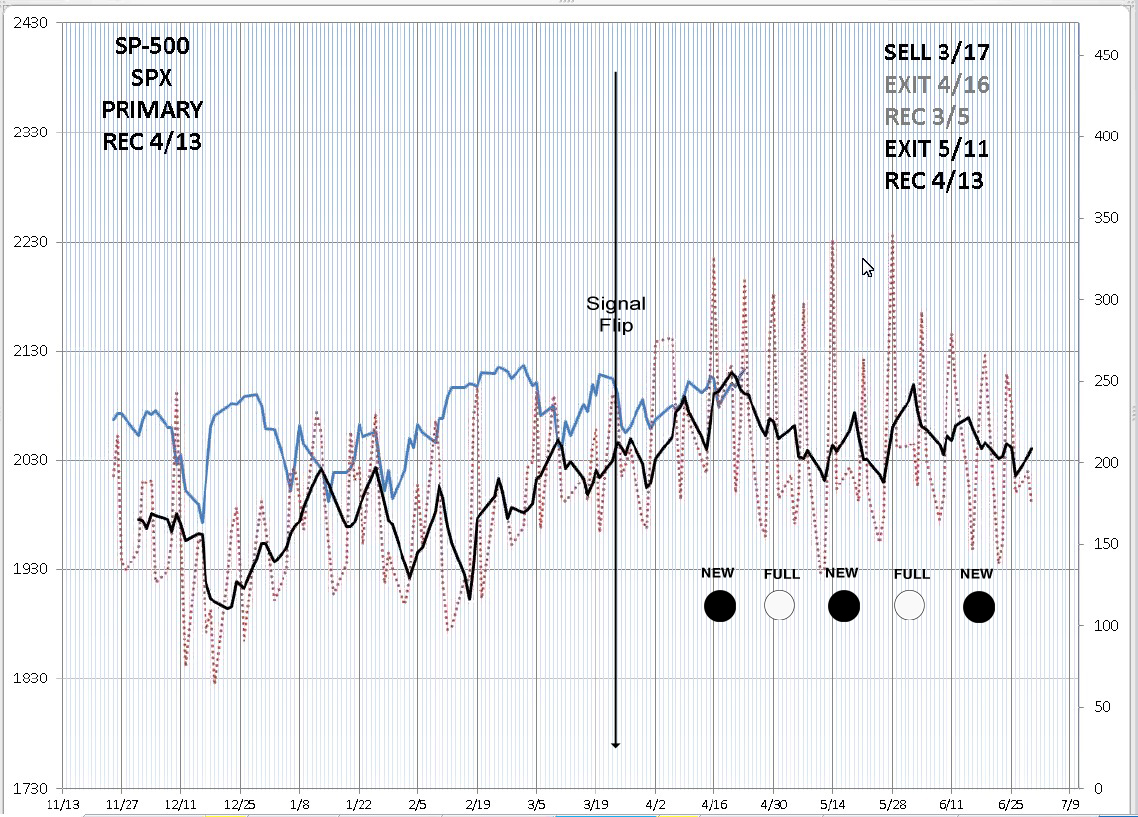
This algorithm derives for tracking 3 planets (Mars, Venus, Mercury) and uses 2-300 years of data to predict the turns in a variety of assets. The chart below is from last Thursday (April 23, 2015). It’s predicting a drop is imminent.
The red dotted lines are the planetary signals. The black line is the predictive path (it’s a 5 day moving average of the red signal). The blue line is the actual SP500 rate of change. (I’ve overlain the moons myself manually.)
The key to this signal is to watch for an inversion, which is a well documented characteristic of planetary signals. We seem to have had one at about March 20 (the equinox). If you can compensate for the inversion, you can see how well the signal matches the actual SP500 rate of change.
Steve Puetz
Steve Puetz in his exceptionally well researched book on cycles, The Unified Cycle Theory: How Cycles Dominate the Structure of the Universe and Influence Life on Earth, identified “The Turning Point Distribution Principle” (TPD). If you don’t have his book, I highly recommend getting it.
The TPD point where geomagnetic waves line up to signal a major market turning point. Mr. Puetz cites two causitive agents:
- An extensive period of speculation and leverage must precede a sunspot maximum
- The sunspot cycle maximum must synchronize with either the 6.36 year or the 19 year cycle.
Now, let’s look at some recent dates:
According to Steve, the top of the 172 year cycle (which predicts a market crash historically) was January 27, 2007. (Steve’s major cycles are harmonic—divisible by 3 to get to the next lower length—172 years, 57 years (Kondratieff), 19 years (real estate and market panic), 6.3 years, 2.12 years and 258.11 days. All of them topped on January 27, 2007.
Let’s go back to those two causative requirements: The first one is a no brainer—this is the largest bubble in history— and the second one is just freaky—6.3 years plus the previous US market top of October 11, 2007 takes us to January, 2014, which is the highest point in the most recent sunspot maximum. So the most recent sunspot cycle maximum synced perfectly with the 6.3 year cycle.
Let’s dig deeper:
The top of the US market in 2007 was on October 11 of that year. That was exactly 259 days after the cycle top of January 27, 2007. That’s amazing on its own!
If we roll ahead two cycles of 6.3 years + 2.12 years (a total of 8.5 years roughly), we land on this month in 2015.
The DOW low in 2009 was on March 6. We’re almost exactly seven years later this month. The seven year period seems to be separating market tops over the past couple of decades.
The Panic Phase and the TPD
In his book, Steve writes, “The TPD principle involves the eclipse cycle as well. The eclipse cycle normally peaks on the first new moon before a solar eclipse. Following that reversal point, it takes six weeks for sentiment to shift from euphoria to panic. Then on the first full moon after a solar eclipse, a panic-phase begins. A panic phase usually last two weeks—ending at the time of the next new moon.”
The dates:
March 5, 2015 – First New Moon before the Eclipse
March 20, 2015 – Solar Eclipse and Spring Equinox
April 4, 2015 – Full Moon
April 18, 2015 – New Moon (start of panic phase?)
May 3, 2015 – Full Moon
May 17, 2015 – Full Moon
June 2, 2015 – Full Moon
So … there’s a lot happening in the area of cycles. Couple this with the ending diagonal Elliott Wave pattern and I’m I think a top is imminent.
I truly believe using geomagnetic cycles together with Elliott Waves give you an exceptional ability to make more accurate predictions of the market and virtually anything else that happens on Earth. So, lets see what happens over the new couple of weeks!
One more note on Steve Puetz: I interviewed Steve via Skype late last year and this week, I’ll be posting new videos with excerpts of our conversation. You can sign up on the right to get a notice when they’re up.


