
Now that we’re at the very top of wave four, let’s look at what a textbook projection for wave 5 look like. There are alternatives (based on the length of the first wave down) and I’ve provided a couple of other projections for the eventual bottom.
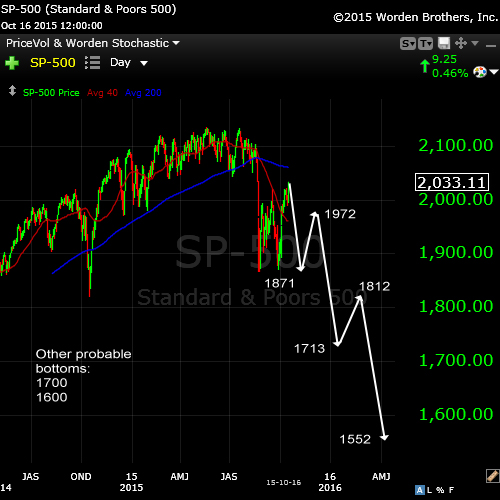
The typical wavelengths for any motive wave are:
- wave 1 typically travels to the end of the previous 4th wave
- wave 2 retraces 62% of wave 1
- wave 3 travels 1.618 the length of wave 1
- wave 4 retraces 38% of the length from the beginnng of wave 1 to the end of 3
- wave 5 travels 1.618 times the length of wave 1
The above projection supposes that wave 1 of 5 down will end at the previous fourth wave.
There are other possibilities because wave 1 may not exactly trace to the previous fourth. Wave 5 may also be 1 or 1.618 times the length of the larger wave 1 – 3. I’ve provided those possible ending points on the left portion of the chart. We’ll have to see what wave 1 of 5 produces.
Keep in mind that waves are fractal, so there will be second, third, and fourth waves within each of the waves I’ve shown on the chart.
The retraces should all be in 3 waves.


