
Four or Three?
Last weekend here, I predicted that we had one more wave up to go before we hit the top of the third wave:
“… the market made it very obvious we’re not quite done with this third wave. All boats have risen to a new high, but the market has signalled one more wave up … and this is across most currency pairs and US indices and futures.”
We indeed went up one more time to a new high. On Wednesday in the Chart Show, I predicted the turnover would happen within hours after Yellen’s announcement, but that it might not happen until the next morning because very often after after a Fed meeting announcement, the market moves in one direction to finish off the day, only to move in the opposite direction the next day.
Sure enough, that’s what happened. ES moved down about 25 points on Thursday. I now place us in wave four.
However, with a market at bullish extremes, and an EW expectation that it will take perhaps ten weeks to trace out all of wave four (a projected SPX length of 175 points), it’s likely to be a choppy and difficult path down. (That works out to 17.5 points a week).
It won’t be much better than the difficult market conditions we’ve experienced over the past several months. Plus, it’s summer. Expect wave four from hell.
Last Weekend: Predicting the Top of Three
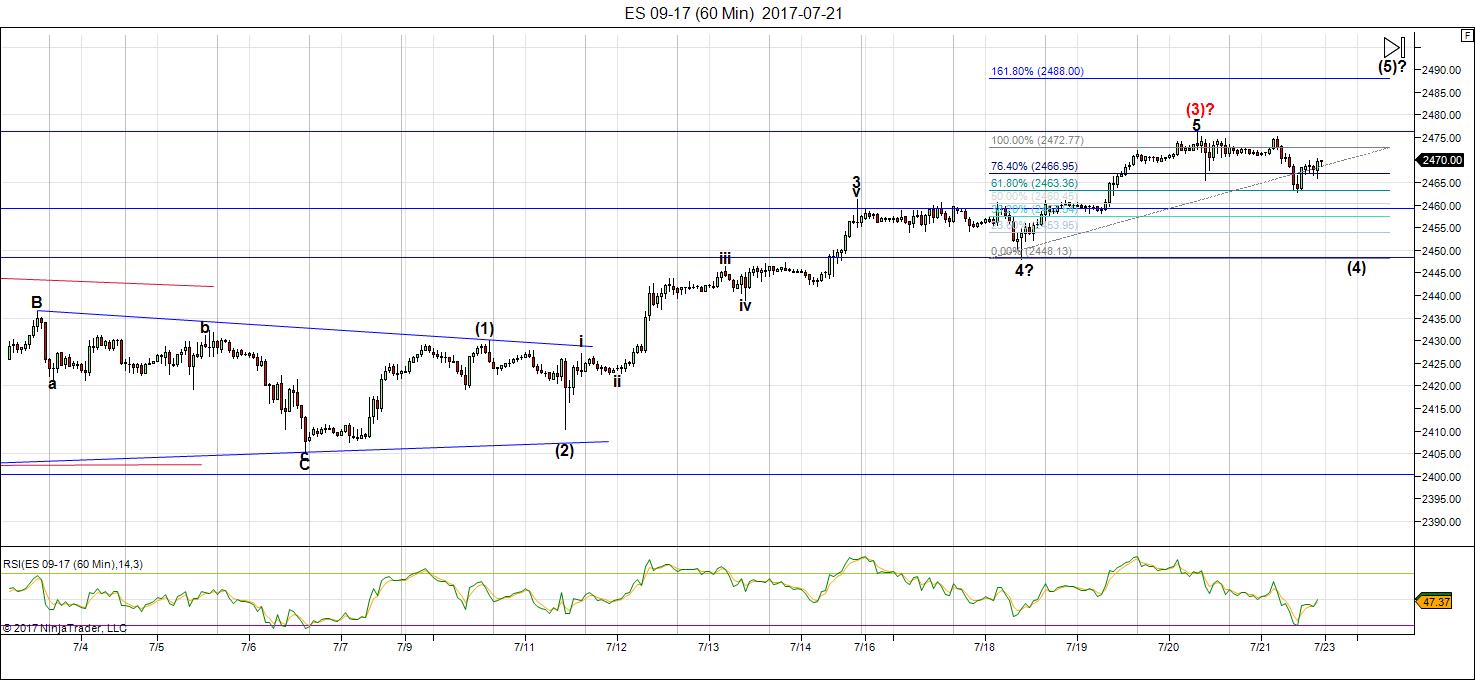
Above is the 60 minute chart of ES that I posted in from the Traders Gold subscription area on July 22, 2017 (last weekend).
I predicted (as per the fibonacci tool overlay top right) the if the fifth of the fifth rose to its full allowable length (1.618 X wave 1) that it could reach 2488. It topped on this past Thursday morning at 2481.
I had also predicted a top for NQ at 5990 for the same reason. NQ topped out at 2997 on Thursday morning, as well.
_______________________
A Rare Event: The Market at Extremes
You don’t have to have even a medium level understanding of Elliott Wave wave movement to know the market is at extremes. But if you do, you know that we’ve had some rare extreme movements in key assets, most notably the US Dollar and Euro (which move counter to each other).
An impulse wave in EW moves in five waves in a very strict manner, with wave lengths that are highly predictable. We have an impulsive wave at an end in the US Dollar (the chart follows below).
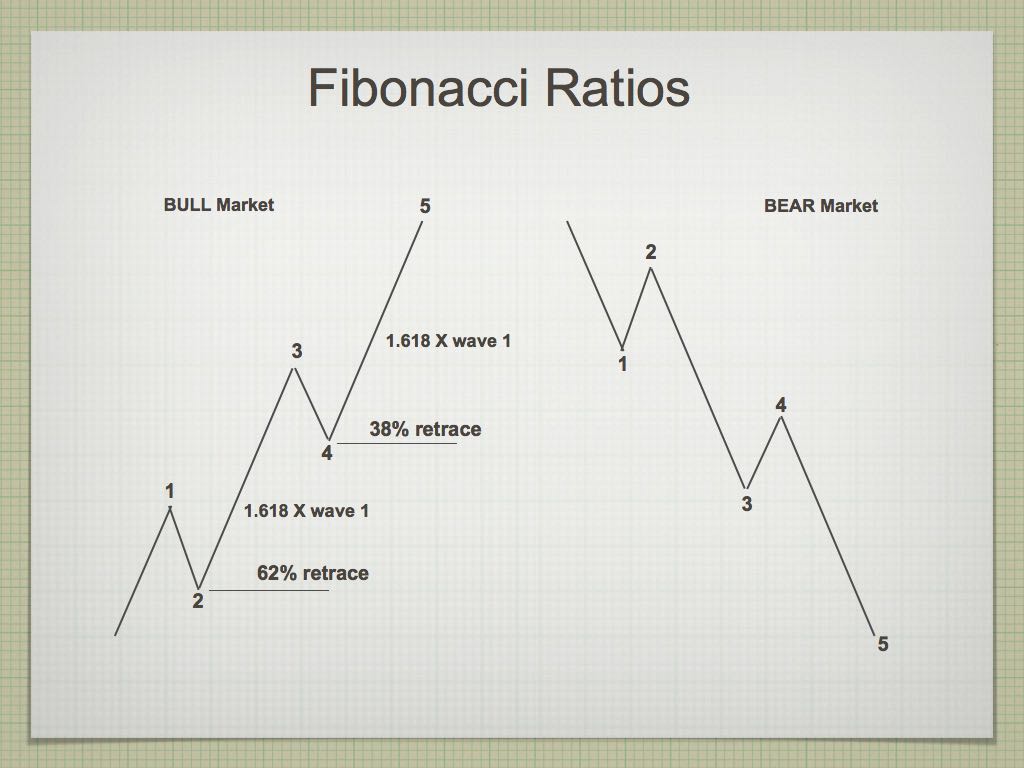
On the left is the typical measurements associated with an impulsive wave, with the expected fibonacci lengths of the trending waves (1, 3, and 5) and typical retracement levels of the countertrend wave (2 and 4). Typically the third wave reaches a length of 1.618 X the length of the first wave of the sequence (the Golden Mean).
Quite often, you’ll find that the one of the waves (most typically the third wave) extends to double the normal length (2.618 X wave 1). The five wave can also extend to that same relative length. However, it’s extremely rare to see both waves extend to 2.618 times the length of the first wave of a sequence.
In the current market, we have that rare phenomenon at play in both the US Dollar and EURUSD. In the USD below, which is the main mover of the market (related currencies all follow it, and the US indices have been reacting to it for months now, to a greater degree as time marches on).
This weekend, the US Dollar is at extremes. Both the third and fifth waves have traced out those extreme fibonacci lengths. A reversal is imminent.
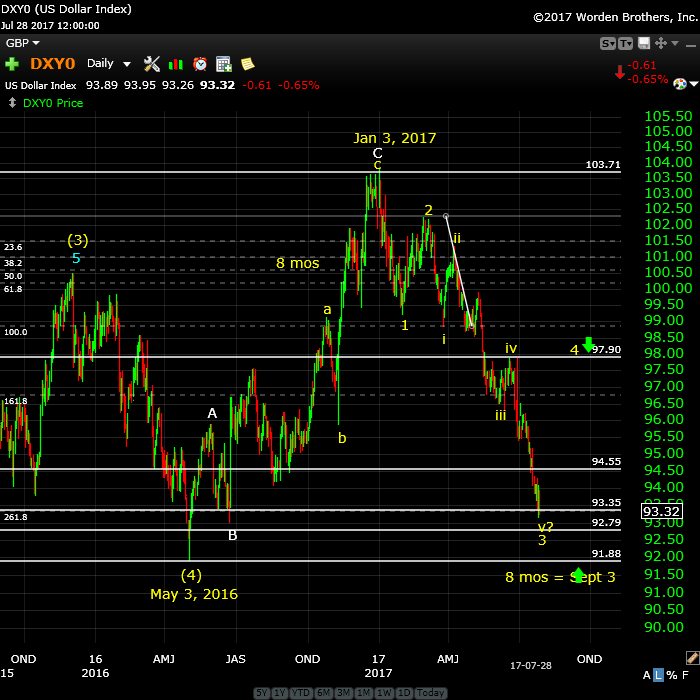
Above is the daily chart of the US Dollar. You can see quite clearly the impulsive wave down to our present level of 93.32. If you concentrate on the subwaves (and were to measure them), you’d find that wave iii is 2.618 times the length of wave i, while wave v currently has exactly the same relationship with wave i.
A turn to the upside is imminent.
Watch the dollar and you’ll know where the USD currency pairs and the US indices are going to go.
______________________________
the real deal SM 2
The real deal …‘Educational, insightful and thorough market analysis for all levels of traders. It’s Elliott Wave at its best….Peter Temple is the real deal’ —SM |
Have not had a losing week RW 2
Have not had a losing week …I have been with Peter almost a year. The only thing that matters is have I made money with his service. I think I have finally turned the corner using Peter’s EW. I have not had a losing week in the last 5 months. Thanks Peter, for your amazing amount of hard work. —RW |
The best of them JL 2
The best of them …Last couple of years, I subscribed to several ‘market traders’. You are by far the best of them and the personal contact is awesome. Daily and daily updates are very well written! Besides your expertise in EW, I also like your cycles analysis. Best investment I ever made! —JL |
A true expert in Elliott Wave FL 2
A true expert in Elliott Wave …You are a true expert in EW analysis. What you provide is not available anywhere and is priceless. Subscription on your services is the best thing I have ever done. Many thanks for your effort to make me a better investor. I now have more trust in my investment decisions. I hope you will continue the excellent work! —FL |
Get an upper hand … JC 2
Get an upper hand in trading …Seeing all the different currency pairs and the wave structures and hearing you explain why this has to do that on a nightly bases gives one a upper hand when trading. Elliott Wave applies to all stock and indices and can be applied to any candlestick chart. If someone ask what you want for Christmas – Tell them a membership to Peter’s “Traders Gold!”—JC |
Rise above the rest … SM 2
Rise above the rest …I have only ever met a few people who, in their chosen fields (astrology, medicine, music, martial arts, technical analysis), rise above all the rest and you are one of them…you have ‘the gift’…and that’s why I’m a Trader’s Gold member. —SM |
Couldn’t be happier … KK 2
Couldn’t be happier …The analysis and insight you provide is simply amazing! I’ve been trading the futures and equity markets for well over thirty years and usually average around 5% monthly. Since joining your Traders Gold Service two months ago, that number has better than doubled. I couldn’t be happier.—KK |
Tops in your field DZ 2
Tops in your field …You are tops in your field. Tried to follow Elliot Wave international for years. They were always behind the market. After discovering you, I perceive that you are an expert in reading the waves, which puts you way ahead of the rest of your peers. And you can read the Waves like you are reading tomorrow’s financial section. I pray you stay healthy. —DZ |
The Market This Week
Here's the latest daily chart of ES (emini futures)
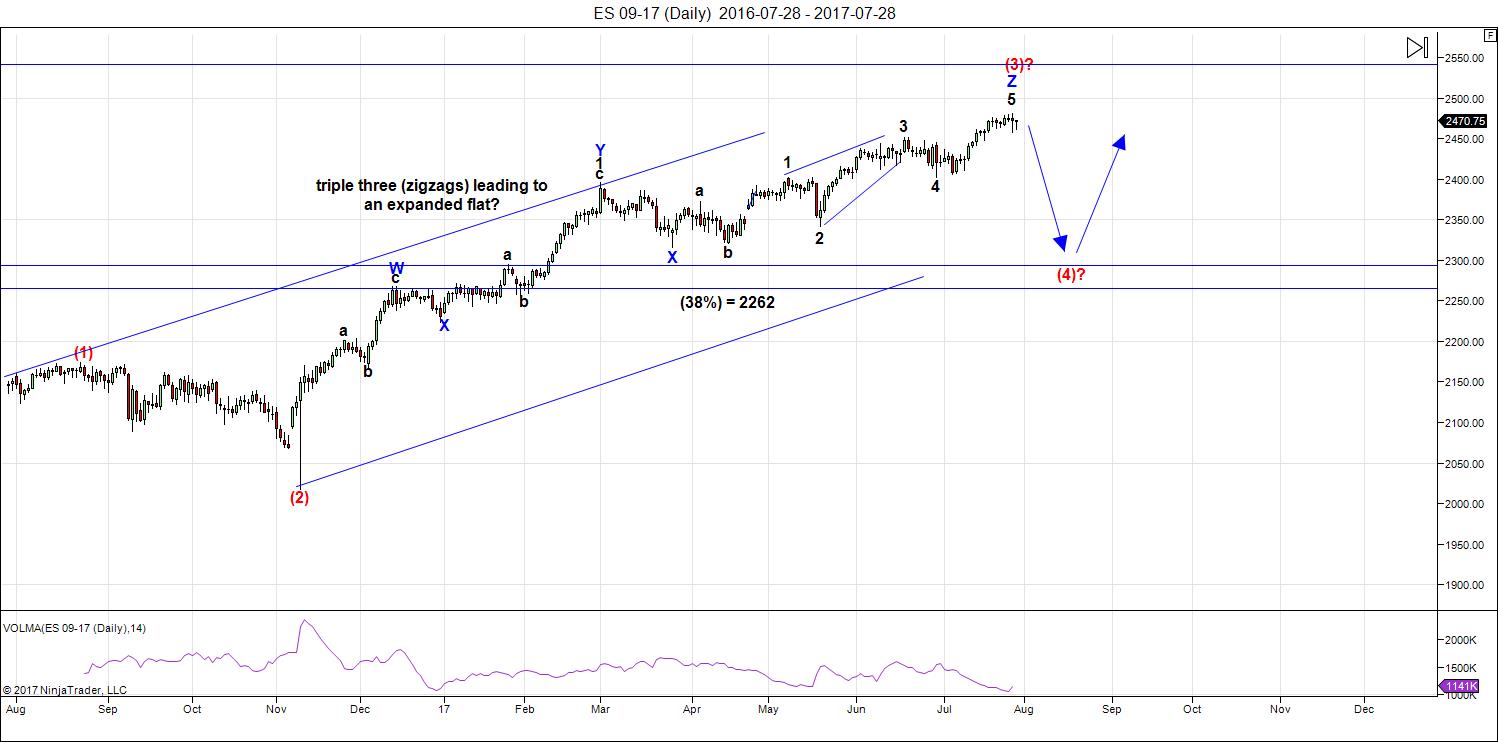
Above is the daily chart of ES (click to enlarge, as with any of my charts). Last weekend, one more wave up to a final top was due and led to a turn down into wave four. I provided targets in my Trader's Gold service for both NQ (5990) and ES (2488).
We exceeded the target for NQ slightly but didn't quite make the target for ES.
I now put us in wave 4, which will take weeks to unfold and drop towards a level of 2295 (which is the 38% retracement level SPX of the waves up from around 1992. That's a preliminary target and will be updated once we get an A wave of the 4th wave in place. On the chart above, I've left the level at 2262 until I have a more precise means of measurement (completion of the A wave).
There is still a possibility that we could see a test of the highs (a double top), but I consider that probability to be very low.
However, the count so far is only three waves down and so we still don't have confirmation of the trend change. We must register 5 waves down for solid confirmation. At the same time, there are several indicators that wave 3 is complete. They are:
- the waves up from the bottom of the recent downturn (Friday's market) are in 3's
- the larger wave three has a full count to the current top
- currency pairs are all at major inflection points and certain ones are extremely extended (USD, AUD, EUR, CAD)
- the DOW is at the very top of an ending diagonal with very little room to go higher. It's also at a measured fibonacci target
- NQ is leading the charge down, which is a very good sign of a top
- bullish sentiment is at an extreme, as I reported last week and ultimately followed by a post in zerohedge, with additional extreme numbers
- VIX has gone to a new low and was quickly rejected, which is a typical trend change warning
The large third wave up is an extraordinary wave. It's corrective, just like the entire sequence up from 2009. There are extensions of waves in currencies (USD and EUR, for example, but there are others), that are extremely rare (as described above). We've run out of wave 3 waves in terms of the Elliott wave count and the market should continue down from here.
Summary: Wave four is in progress. Expect a continued drop for several weeks to come.
After completing the larger fourth wave, we'll have one more wave to go, which could be an ending diagonal as a fifth wave. The long awaited bear market is getting closer.
______________________________________
Sign up for: The Chart Show
Wednesday, August 9 at 1:00 pm EST (US market time)

The Chart Show is a one hour webinar in which Peter Temple provides the Elliott Wave analysis in real time for the US market, gold, silver, oil, major USD currency pairs, and more. You won't find a more accurate or comprehensive market prediction anywhere for this price.
Get caught up on the market from an Elliott Wave perspective. You’ll also get Andy Pancholi cycle turn dates for the SP500 for the balance of the current month. There’ll be a Q&A session during and at the end of the webinar and the possibility (depending on time) of taking requests.
All registrants will receive the video playback of the webinar, so even if you miss it, you’ll be sent the full video replay within about an hour of its conclusion. For more information and to sign up, click here.


For what it’s worth
Despite the bad calls I respect Robert prechter
And I’ll add to it . He has actually been more right then wrong
After all these years . We can not pick if we choose so I don’t
Wish to debate yet overall he has Been an inspiration to me
And I say this without having any subscription to ewi in the past
8 plus years .
He has generally got it right and other than being human
He has been more right than wrong
http://www.zerohedge.com/news/2017-04-23/bob-prechter-warns-market-correction-larger-malaise-30s-looms
Prechter places supreme value on the idea that social mood always drives prices. I often wonder about the possibility of social. mood being divorced from reality, a basis I suppose of contrarian investing philosophy. The current situation is a stark example. When you llook around the world at looming geopolitical risks, you have to wonder how markets can be priced as if risk was non-existent. Nobody seems to be considering that the correction of this misperception could be sudden and dramatic,
contrary to the notion of a gradual shift in social mood. Think about the implications.
His comments about the failure timing cycles is thought provoking.
While I remain convinced of larger forces at work, we have to admit no one has been able to identify them with better than 50/50 consistency- akin to tossing a coin. It was remarkable Prechter says he no longer uses them. I have a theory about why they no longer work reliably. Think Heisenburg uncertainty princjple.
Liz H
how do you come up with those multiples ?
Very curious how you come up with that .
Another interesting consideration. The market has already done a number of things it has never done previously on the way up.
Who is to say it will not do the same on the way down?
I suspect that the same wsy it destroyed the bears on the way up, it will do the same to the bulls on the way down, and that it could hsppen in a way that is unprecedented
Still, I do have a small upside hedging position…just in case! ?
Joe,
https://worldcyclesinstitute.com/party-like-its-2007/comment-page-1/#comment-20169
8/2 swing low for IYT, XBI. 8/3 swing low IWM. Presuming there is a sell-off next week, will the recent lows hold? Was 8/4 swing high ?
Verne talked about someone who called for a supposed July 31st, Monday crash which didn’t occur, Valley is bearish this coming Monday. So I look at the calendar and right there staring at me lined up nicely in the Monday column for the month of August: 7, 14, 21.
Plus add the lunar eclipse on 8/7, total solar eclipse 8/21. We have a year ending in seven. So those days must be special?
Another thing to consider, presuming my day counting is correct:
Mon, 06/27/16 to Fri, 11/04/16 – Low to low, 92 trading days
Fri, 11/04/16 to Mon, 03/27/17 – low to low, 96 trading days
Mon, 03/27/17 to Mon, 08/07/17 – low to ?, 92 trading days
Mon, 03/27/17 to Mon, 08/14/17 – low to ?, 97 trading days
Something odd
monthly dow
beginning august 2009
august 2009 low
plus 24 month
august 2001 low
plus 24 months
august 2013 low
plus 24 months
august 2015 low
plus 24 months
august 2017
lining it up on the weekly chart
its not bad yet it isnt a perfection of nailing all the lows
that said you would have done well having bought
every 104 weeks over the past several years .
it begins
week of
aug 31 2009 no draw down
aug 29 2011 very little draw down
aug 26th 2013 very little draw down
aug 24th 2015 very little draw down ( important low )
week of aug 21 2017 is next
point being is that since this bull market began back in march
2009 buying in late august has been good to you .
but now it is looking like a low to low to high count.
verne
i think the debt ceiling deadline is sept 29th which coincidentally
i have as a swing high date . so a bit of a news event if congress and the senate
cant get anything done . we might actually see them screw that up and cause a panic . totally coincident to the swing date and not something id bet on .yet
that is the possible event to drive a panic is all im saying .
every once in a while i use this type of scenario to keep myself in check .
say its the middle of summer , its hot out around 90 degrees , no clouds in the sky and a beautiful day . a guy comes up to you and asks you if you want to buy an umbrella and some rain gear and a sweater . you look at him and laugh and he says its noon now but at exactly 130 today its going to pour like you have never seen ever in your life time and you only have an hour in a half before it hits
what do you do ???
If I’m herd, BUY!
🙂
Peter- are there any market forecasters that you think are the best in your field? thanks
Martin Armstrong (Armstrong Economics) is the best in my opinion…
roger- what is Martin Armstrong forecasting in 2017 for the stock market? thanks
A vertical market and Dow 38,000.
below is just one of Armstrong’s lousy market calls…people give him far too much credit…
“Can The Dow Correct for up to 5 Months?” – Martin Armstrong, January 6, 2015
https://www.armstrongeconomics.com/uncategorized/can-the-dow-correct-for-up-to-5-months/
Looks like a pretty good call to me… Did you actually read the article??
Concern is growing …
http://www.zerohedge.com/news/2017-08-05/interactive-brokers-raises-vol-product-margins-anticipation-vix-shock
Peter- the much bigger issue is the amount of money short the VIX- you combine that with the amount of passive money in index funds and margin debt and the fall will be so catastrophic you won’t believe it!!
One of the best articles I have recently read on the subject. I know a lot of folk tend to scoff at mentions of the implications of what happens with VIX at these extended low levels, and do not consider the fact that what happens is big funds end up with a massively distorted value at risk metric, and are permitted to achieve insane level of leverage. There is a event horizon for VIX increases ( I think the article mentions a 3% decline in the market) where the leveraged positions would have to be unwound. So it is not just a matter of shorting VIX, but also extreme leverage in long positions as a result. This explains whey VIX has been so relentless shorted at every little attempt to rise the past year or so. it has really been unbelievable.
The question in my mind is do these folk really expect the market to go up for ever, and for VIX to remain this low for the rest of their investing careers? What the hell is the exit plan when, and I don’t men if, VIX breaks free from the un-natural compression?
peter
this reminds me of silver in 1980 , you can only short it
but no new buying and they drove silver straight into the toilet .
they might actually create a spike in the vix by increasing margin
and in doing so could also increase the cost of put options
if the market turns down simultaneously.
i find the date dead on by the way .
They have reverse split UVXY many times , including last month
The adjusted reverse split high in 2016 was 6,000 and it sits at 29 and change
today . yea they should be worried .
interesting article . ill quote from it
In a notice to clients sent out late on Friday, Interactive Brokers admits it is starting to get a worried about the recent VIX record lows and as a result after expiration processing on August 19, “Interactive Brokers will put into place greater margin requirements for Volatility Products.
I have to wonder how this will effect the margin requirements
on this guys huge bet ???
sounds like this guy is going to have some margin to consider now .
verne your a spread guy what do you think ?
how will the margin increase effect his guy
http://www.zerohedge.com/news/2017-07-24/about-262-million-man-vix-option-play-analysis
Seems like he is betting on a controlled demolition. A massive 1-3 day crash would cause the VIX to spike over 35.
An interesting trade. The key to the trade is for VIX to trade substantially above 15 before expiration which allows him to exit the trade with a profit. The article writer s discussion of the potental loss above 35 is assuming he would remain in the trade if the 35 strike short calls go intrinsically in the money, showing a limited grasp of how these kinds of trades are managed. VIX also must stay above 12. Ordinarily I would rate his chances of a successful outcome excellent. At its core it is nothing more than a reversion to the mean type of trade. Price action in VIX however has become severely distorted due to relentless margin fueled short selling. Those positions will have to be unwound. The risk is no one knows when. I expect it will be some kind of exogenous shock no one saw coming and which the banking cartel cannot contain with liquidity injections and shorting volatility to distort value at risk assessment, something they have been doing sucessfully for quite some time . That will not work when the fear is palpable and not just merely perceived. After all, no lasting catastrophe accompanied prior VIX capitulation spikes! The length of time they have already kept VIX under 10 should be screaming at everyone that we are in uncharted waters. People now seem convinced risk has been banned in perpetuity. Can banksters and volatility bears abrogate the principle of reversion to the mean? They clearly are trying! ?
as always people think a alarm bell will go off to warn them of the brutal bear market to start so they have time to get out- VIX will keep going up in a stair approach to suck people in at each level thinking it will just fall as in the past–not this time folks-
It is going to be very interesting to see how all those traders accustomed to confidently shorting the VIX will react when it starts going higher. There are some smart traders who will recognize what is happening and will quickly unwind their short trades. I suspect a lot of others are going to keep shorting the move higher. If they can stand the pain they will probably be OK. I expect VIX to ultimately make a new all time low on the second wave bounce after the bear market starts. That will be the long VIX trade of several lifetimes!
On the SPY hourly I’m seeing a diamond formation that we just popped out of. Heading for wave 5 up imho.
I saw that too. We are still only days of a implosion and right before it will be like picking up nickels in front of a steam roller
verne
not sure if you read peters link above
they will begin raising margins august 19 th
so ill assume that guys has a lot of money to fund that trade
He probably won’t be affected unless the trade goes against him very badly – way below VIX 12 or above 35. He funded the trade with the sale of the VIX 12 strike puts and 25 strike calls and bought the 15 strike calls. Since he sold twice as many VIX 25 strike calls as the 15 strike calls he bought, he breaks even at 35 and looses money above. His ideal price if trade held until expiration is VIX at 25. The chance of him waiting until then to close the trade is just about zero. VIX spikes complete in a matter of hours and he will exit the trade as soon as it does, and probably well before it hits 35.
I think I am finally beginning to understand what Peter T has been saying about this entire move off the 2009 lows being corrective. It use to puzzle me since I consider the current move to be an impulse. However, if you look at the entire move off the the 2009 lows as a huge ABC move up with us now in the C wave, that still makes the entire thing a corrective move, with tremendous implications for what happens next.
Steve Sjuggerude of Stansberry Research has been beating the drum about comparisons with the 1999 market and insisting the biggest NDX gains came in the last six months of the bull market and expects at least another 15% run higher before the top. Is he right??!
A “hidden hand” that few investors know about, and that affect markets far more than people realize is the unregulated sol called “Dark Pools”. The fact of the matter is this unseen, unregulated market absolutely dwarfs the visible markets and the vast majority of traders and investors have absolutely no idea about what trades are being made by whom in this murky arena. The amounts are staggering, and this is the vast ocean in which derivative monsters swim. Just as was the case back in the last crisis, it is counter-party risk in this arena where the trouble will begin with whispers, and could happen while indices are still merrily making new all time highs. This is a little considered reality which in my view makes the financial market such a risky place these days. Everyone is assuming that when the music stops they will not be the one unable to find a chair…
LizH
I just saw your reply
and the 96 trade days you mentioned
I get it
your 8/7 14 21 ect .
8/7 is the lunar eclipse ( feb 11 i think was the last one just for reference )
feb 26th was last solar eclipse yet we had an early march high that lead to the march 27 low )
8/12 is when mercury begins moving retrograde which has the potential
to change this up in my opinion .
and 10 days after mercury retrograde is aug 22
there is also a short term low to low to high 9 trade days .
so we may see that sell off .
not claiming anything here just liking what you said .
what i found interesting was Christine laggards speech
about the 7 year cycle back in 2014 and if you look at the
us dollar index . anyways you made me think back because i watched that
speech and thought she was trying to leave a message
https://www.youtube.com/watch?v=QYmViPTndxw
that link above doesn’t show the real speech but you can find it .
back then i was thinking july 7 2014 ( 7th month 7th day and 2+0+1+4 being 7 )
the dollar took off in july 2014 .
this i think is the total speech
https://www.bing.com/videos/search?q=christene+laggard+speech+abot+7+years+&view=detail&mid=68B7B413BAA2E14292F968B7B413BAA2E14292F9&FORM=VIRE
Someone once said to never underestimate the gullibility of the crowd. I watched again with bemusement all the gushing commentary on the NFP report. A few were expressing surprise that it had so little apparent impact on the market. I am always keenly interested in the number that reveals how many of the jobs were theoretically attributed to formation of new businesses, and which in my view is a complete canard. Nobody points this out and I am not sure why. Perhaps Mr Market know this therefore the muted response to the touted number.
Verne
the issues i have with this guys trade on the vix is more
about premium risk as i see it not theoretic risk .
if the vix spikes to soon then those short 25 calls will
spike as well . also i think exiting the trade will be difficult .
he would need to buy the short 25 calls first in my opinion
and in doing so would spike the vix further and then sell the long calls.
i don’t think the market will let him out using limit orders in a fast market.
granted its electronic now vs a floor trader .
also i think the recent rise in margins is an attempt to screw him .
he doesn’t have a 10 or 20 contract spread he has thousands of contracts
if not 10’s of thousands or 100,000 contracts . no way he put that trade on
in a single day .
anyways thanks for your input .
we will see soon enough what the vix does
The way I would manage the trade in that situation is to first buy back the short 12 strike puts to free up buying power. Instead of buying back the 25 strike short calls outright, I would then use the freed up buying power from closing the 12.00 strike
short puts to roll the 25 strike calls ten points higher to 35.00, THEN, plan the exit from the 15 spread in accordance with the intensity of the VIX spike. I am sure this trader has watched how VIX moves on capitulation and has a well-thought out game plan with predetermined price targets. I assure you he is not out to leave anything to chance. I would also imagine just in case he has reserved some buying power in the event of a fast moving scenario as it cost him very little to enter the trade. A fast move up in VIX means the trade is moving in his direction and thus can be much more easily managed than the other way around. He is also justified in assuming that VIX downside risk is quite limited , despite the persistent trading under 10 recently which in fact has greatly increased the chance of just the kind of spike he anticipates. The deeper the 15.00 strike calls go in the money, the easier it becomes for him go adjust the short leg of the remaining spread to limit his upside risk, As a matter of fact, I suspect this trader is planning on making even more money AFTER the spike by reversing the trade and shorting VIX at capitulation.
Another interesting about that article is that it reveals providers of inverse VIX instruments hedge by shorting VIX futures and those that are ETFs must do daily rebalancing so you could really see some fireworks with even a mild correction. Is it possible that the situation with the degree of volatility distortion is why we have failed to see even a mild correction this year? The VIX hit a historic high of around 53 in August of 2015 and we had nowhere near the situation we have today. I traded that spike. This is why I do not believe we are going to get any more real corrections if they can prevent it. They will all continue to be extremely shallow and short lived until we put in a top, and that is because for an awful lot of positions, that is the way it has to be.
Verne
good points
i am seeing the same things take place with earnings announcements
and my assumption is the market prices it in before hand .
only a true surprise will move the market specially when that surprise
goes against the markets assumptions .
at the end of the day though the big money has an opinion regardless of the news and trades the news only to exit or enter. the decision to buy or sell
was already thought out ahead of time in my opinion .
everyone said the market will crash if trump was elected and it was a sure thing Hillary would be elected yet on the news of the event the market went up .
the actual election results did not matter in this case.
Joe, the problem is that it works only one way …
up.
When the market decides to go down there are ten possible reasons.
But when the bad news is a good one and the good news is a great one you need an “expert” to find what else hasn’t still been baked in the previous rally.
20 day oscillator on the dow did turn down slightly on friday
but is no where near an overbought reading .
we all have own methods yet based on this i cant justify
being short at the moment
http://imgur.com/bzTHvs0
everybody can use any method or theory trying to guess the stock market they like. the only thing that matters to me is that the VIX is entirely shorted out (97%) with margin and debt. if you think this will end without a bloodbath and happen very quickly you should go trade bonds.
Trying to figure out the short term direction of this market is to my mind an exercise in futility. I was thinking of Pancholi’s recent frenzied appeal for folk to buy his June newsletter and the implication that something big was imminent and we all know how that turned out. This market is simply not playing nice with would-be prognisticators, whatever their method. Harry Dent has been predicting doom since 2012! I remain confident is where this market will be 90 days out though, and am planning accordingly….
weekly chart shows a more oversold reading on the dow vs overbought
more or less the same as daily chart above .
maybe the dow lags and the NASDAQ and spx run higher ?
either way i cant justify being bearish at this juncture .
the longer term indicators are hitting extremes
its the shorter term daily and weekly im concerned with.
im done posting and will try my best to just be quiet until
Friday morning .
good luck everyone
Joe I have to say that you have so far been proven correct in you assessment of the importance of the timing factor as it applies to market direction. My target of 2480 was long met but here we simply hanging around barely below those levels. I recall you mentioned that it is possible for price requirements to be met but not time and that will prominently play into how the market behaves. I am starting to think you are really onto something. SPX is famous for putting in rounded tops and that would explain a lot.
Marc
even using the vix example of being shorted out is using an indicator.
we all have our own methods that work for us .
for me i cant justify being bearish at the moment .
i can be proven wrong but i must stick to my work and it says
we have room for higher prices on the daily and weekly charts
Verne
the way i look at the markets is to try as best i can to stack the data
in my favor . Nothing works all the time yet what i do use tends to work
more times then not in the broader sense .
It took me several years to create the indicators that i use yet all of them
i have tested back to the 1920’s . i only focus on what has been the most consistent yet who knows in the end .
the best thing i learned over the years is to let the market prove me right or wrong and not expect the market to do what i think or want it to do .
anyways see you friday
JOE- what signals would you have to see in your strategy to become very bearish? thanks
A new blog post is live at: https://worldcyclesinstitute.com/september-lining-up-for-a-great-fall/
Marc
I’d like to see a higher reading in the weekly and 20 day
Oscillators, I’d like to see the 5 day and 10 moving averages
On the NYSE advance decline into their respective upper ranges
I’d like to see the 10 day moving average on the daily trin
At or below 1.00 and I’d like to see the 5 day sum ( 5 daily closes added together )
Of the trin at at least 4.5 yet I’d prefer that to be 4.00 or lower
Obviously expecting all of that to come together at the exact
Same time I’d asking a lot . Yet more or less that’s what I’m looking
For and ideally mid August is where I’m looking .
At the moment I’m not seeing even the oscillator
At a decent level
Verne
Not sure I got all of the link but
Some of what he says tells me I’d avoid the vix etfs
http://www.zerohedge.com/news/2017-07-23/vix-acceleration-events-and-extreme-short-interest-signal-clear-path-some-uglier-sce
This website is for educational purposes relating to Elliott Wave, natural cycles, and the Quantum Revolution (Great Awakening). I welcome questions or comments about any of these subjects. Due to a heavy schedule, I may not have the time to answer questions that relate to my area of expertise.
I reserve the right to remove any comment that is deemed negative, is unhelpful, or off-topic. Such comments may be removed.
Want to comment? You need to be logged in to comment. You can register here.