
Here’s a little lesson on wave measuring for all my loyal blog followers. In the short little exercise, I’ll show you how to more accurately determine a target for the end of an abc wave structure.
What I show below is the final wave of today’s DOW 4th wave retracement. You can see that I’ve marked 3 wave ABC wave retracement ending at the C. The last part of the wave isn’t formed yet. The C wave of an ABC structure is very often in five waves (very typical structure). Of course, the wave have to be large enough to make out the sub waves.
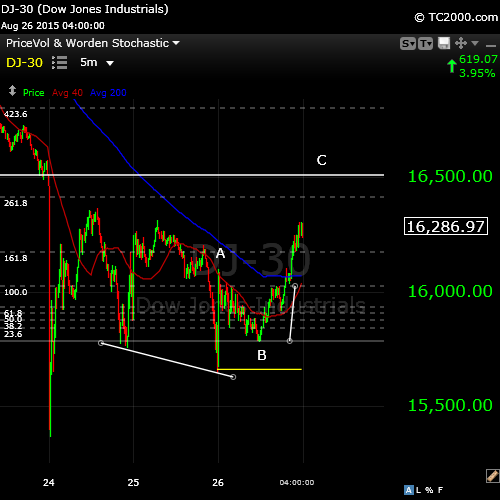
First Step: Take your fibronacci retracement tool and measure the length of wave 1 of C (as I show above).

Second Step: Then you move the measurement tool up to the bottom of wave 2 where I have it (above). You can then estimate the length of wave 3. Wave 3 should be 1.6 times the length of wave 1. You can see that it is … exactly!
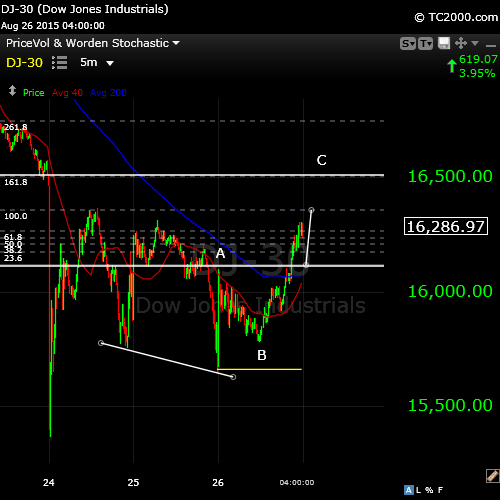
Third Step: This one is in two parts. You need to measure the length of wave 1,2 and 3 together (as one, starting at B) and find where the 38% retracement level is. I’m not showing the measurement here but I’ve drawn a new horizontal line at what would be the 38% retracement level (wave 4 always retraces 38% of wave 1, 2, 3).
Wave 5 hasn’t traced out yet. But we know that wave 5 is usually 1.6 times the length of wave 1 (or the same length as wave 3). You can see that I’ve measured from the line (the 38% retracement) and the 1.6 point (161.8 on the chart, or 1.618, or phi) comes right at the higher line, which is actually the 38% retracement point of the entire higher degree wave 3 that we’ve been trading for the last couple of weeks. Now, tell me the market moves randomly!
Anyway, that’s where the end of tomorrow’s wave should end before it turns down. You can do this exercise with all the other indices.
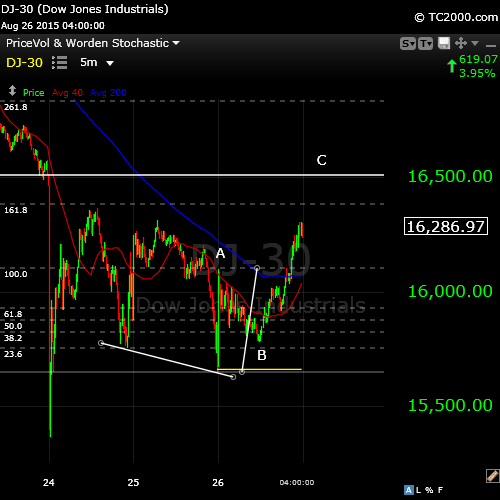
Here’s an alternative. You can measure the length of wave A with your fibonacci retracement tool. Then on the next chart example …

… lay that measured distance on top of the C wave. We know that C waves are typically 1.6 times the length of the A wave. Well, there you go! It measures right to the same spot—the 38% retracement line of the entire higher degree third wave down.
Cool ways to use math and the structure of Elliott Waves to make money!
What Actually Happened!

What actually transpired was a little different that what I expected and an even better lesson on what to look for! This is the top of the 4th wave on August 27, 2015.
I had expected the third wave to be 1.618 times the first wave, as per the charts above, but it extended to 2.618 (right where my green arrow is). The lesson is that if it extends, it’s most likely going to go to another “signpost”—my way of saying another fibonacci ratio. At the same time, it telegraphed that this entire structure would be a flat. A flat is a 3-3-5 wave combination (3 waves up, 3 waves down, and finally 5 waves up—the 5 waves is in the C wave).
Let’s focus on that C wave. You can see the small first wave of the C wave starting at B. Then we have a tiny second wave and then wave 3 up, which morphed into a length of 2.618 times the A wave, as I said. Then we had a fifth wave of the 3rd which extends from the arrow to the horizontal line (if you measure that 5th wave, you’ll find it’s exactly 1.618 times the first wave). That completes wave 3 of C.
Finally, we can look a the larger ABC sequence. It needs to be 5 waves, as well. The A wave is the first wave. At the end of the C wave, we now have the fourth wave and small 5th wave to end the wave and create the top. Everything ended at the horizontal line. A large fourth wave typically ends either at the 38% retracement level or in the area of the previous 4th wave, which I’ve labelled to the left with another green arrow.


