
We are witnessing a turning point in history. I can’t overstate the importance of the next couple of months to your future; to the future of the world.
The theme of this week’s blog post is “Wound Up Tight.” I’d originally intended for it to refer only to the market as a whole. I’m seeing triangles in oil, major USD currencies, and of course, the US indices. I’ll address the market and where we are currently a little further on below.
But first I’d like to talk about the bigger picture. I tend to be a big picture thinker. There are many of us who sweat the details, like engineers and accountants … and thank goodness for them, or the world would be in a far bigger mess than it is now. But my skill, if you like, is discovering patterns.
When I make that statement, I drift back to my teenage years when my father wanted me to be a doctor or lawyer and I knew (after a year of failed university) that it wasn’t my forté. There are many of us who’ve had that same kind of clash when we were young, before we really understood the importance of personality styles. Luckily, I revolted and went with my heart … and I like to think, brains (but probably not so much). 🙂
In any event, he put me through a battery of tests, but the one where I went “through-the-roof” was in “spatial” (I call it “mentally manipulating three dimensional objects in space”). In other words, being able to imagine patterns in three dimensions at various angles. So I went back to university to study television, which I eventually excelled in, because I could always envision the best short from various angles in my mind, yada yada yada (for all you Seinfeld fans). I became a writer/producer/director and have spent most of my life taking complicated subjects, breaking them down, and presenting them in the video medium.
It’s why I like Elliott Wave. I see it as a big three dimensional puzzle, for I’m constantly thinking about how a variety of assets (precious metals, currencies, US indices, etc.) relate to each other. So, I’d like to talk today about the bigger picture, what I’m seeing, and then drill down to the coming weeks, if you don’t mind.
The Spark
My change in direction for today’s blog was sparked by this morning’s story of Clinton’s health in regards to the 9/11 ceremony. She left early and because of her ongoing health issues, it’s very big “news” just about everywhere (I put the word ‘news’ in quotes due to the fact that today we have very little objective, in-depth news coverage. It’s mostly editorialized and to a large extent, manipulated).
I typically watch NBC’s “Meet the Press” on Sunday morning for a head’s up on what the US financial/political media are concentrating on. There was a news bulletin in the middle of the program and then the remainder of the show focused on this tiny story. And I thought, “Wait a minute, you’re completely missing the bigger picture!”
We often can’t see the forest for the trees. I tend to concentrate on the forest (as I mentioned above). So here we go …
Hilary Clinton represents the “old world order,” the elitists, the fraud and manipulation in society, the oligarchy in the US, and the warm-dry climate that we’re leaving behind. Donald Trump, on the other hand, is the much simpler new world that will be more authoritarian initially, but that is breaking down, much as I outlined in my post on the parallels between the fall of the Roman Empire and the US today.
As an aside, I just finished the book, “Hell to Pay, the Unfolding Story of Hilary Rodham Clinton.” It’s an unauthorized biography, a page turner, and I urge you all to pick up or download a copy.
We have the US election unfolding just as the US market reaches a top. I predict the top will happen before the election and have a dramatic influence on the outcome.
We see the world breaking down around us on a daily basis. If you’re a frequenter of zerohedge.com, the examples of this are absolutely overwhelming. A major story this morning is the voter fraud in Austria: Another example of the elite attempting to influence politics. We have a psychological war on our hands. The elite (the one percent) will lose and the revolution will take on even larger proportions. We’re “All Wound Up” and I’m expecting a very volatile outcome very soon.
I reflect back to Dr. Raymond Wheeler and his prediction of how this 500 year turning point stacks up against the previous ones:
Current events show that another world convulsion is occurring second only to
- the emergence of rational thought in the sixth century BC,
- the fall of Rome and other ancient civilizations in the 5th-century and the beginning of the medieval world based on feudalism, and
- the final collapse of the Middle Ages in the 15th-century.
The current convulsion is comparable to the birth of Christianity in the first century and to the birth of the modern nation as a feudal principality in the ninth and 10 centuries.
Cycles
Cycles, of course, are the things that fascinate me. Although I often cite the work of Dr. Wheeler, and how climate tends to foretell the changes in the psychological thinking of the people of the Earth, I believe changes in climate are a physical manifestation of an underlying influence over us that emanates from the same source: The Universe (more specifically, electromagnetic waves from revolving planets).
There is no question that when climate changes (we’re in the beginning of the cold-wet phase, with a larger colder-dryer phase on the way), the economy changes and so does our overall way of thinking. We are heading down the same path we have so many times before, in this case, at the 500 year milestone that I describe in my Global Cooling video.
There’s a man-made cycle that parallels the natural cycles and this has to due with elite classes taking advantage of everyone else. The natural cycles help push the man-made cycle “over-the-edge” and they reverse together in what amounts to a major social revolution. We’re witnessing the decline of the United States and the probably rising of China. The power shifts at the tops of the these cycles from West to East and back again (an observation by Dr. Wheeler) every 500 years. Over and over, it happens again and again, with money tending to be at the root of the man-made version. The Bible warns us of the dangers of money and the merchant class.
But what’s interesting about this time around, is the fact that we have the power of money interfering with the natural cycles, if you will. And that’s the point I really want to make. I see many of us attempting to justify the top of this market based on natural cycles, but I personally feel that these natural cycles have been overwhelmed by the man-made influences (central banks and their failed attempt to inflate), that are the largest in history. Human influence has had a stunning short-term effect on the outlook of the population, enough to delay the onset of the financial crash. It won’t last, but it helps explain what I’ve seen going on in the market.
The Market – The Elliott Wave Story
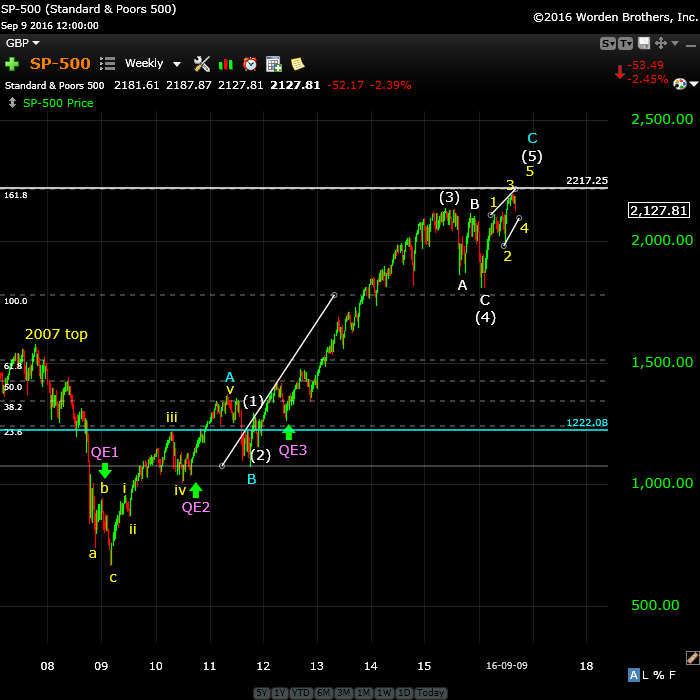
Above is a weekly view of the SP500 taking us from the top of the market in 2007 to today.
I put the top of this major cycle at the 172 turn date (18 years after the uranus-neptune conjunction: the year 2007), which is the cycle turn identified in Dr. Wheeler’s work (in particular in the Drought Clock) and that is statistically supported as a major cycle in Steven Puetz’s book, “The Unified Cycle Theory.” I talk more about this important turn in my video in “The Major 172 Year Cycle Spells Depression.”
Looking at the above chart, you can see the top of the 2007 drop on the left. The drop looks like it came down in 5 waves, which is a motive wave sequence and would usher in additional waves down—the expected crash. However the final wave at the end of 2008 was in 3 waves. Lo and behold, QE1 was introduced at the exact same time the wave changed form. This signalled that the entire wave down was now corrective and would retrace.
If you hadn’t notice that subtle shift (I didn’t at the time, as I was on the road training and not doing daily analysis of the market), you would have expected the market to turn over again and head down after retracing 62% (the blue line on the chart). It almost did, but QE2 was introduced right at that point (fall, 1010), and so the market took a new gulp of breath and headed back up instead.
So, we had central banks change the course of natural history twice to move the market in an upward direction, the most massive injection of cash and most gross manipulation of the market in history. QE3 propelled the market up even higher.
The resulting wave up from the low of early 2009 is in three waves. It’s an exquisite example of an Elliott Wave zigzag (it will completely retrace) and is ending now in an ending diagonal. We’ve had an (blue) A wave up in 5 waves, a (blue) B wave, and an even longer (blue) C wave up in 5 waves.
If you measure the (blue) A wave length, you’ll find that the top of the (blue) C wave at 1.618 X the A wave, should be at ~2217. We’re not quite there yet, but our eventual top should be around that immediate area. (I may be slightly off on this target, as this is a visual measure using a fibonacci tool that may have a bit of inaccuracy built in, but it should be minor, considering the magnitude of the rise).
What is fascinating to me is that with all this obvious manipulation of the markets, we still have a mathematically perfect corrective wave signalling a top, with the ensuing social signs all around us.
It’s a wave and a time for the record books.
A Corrective Wave Up to a Triangular End-Game
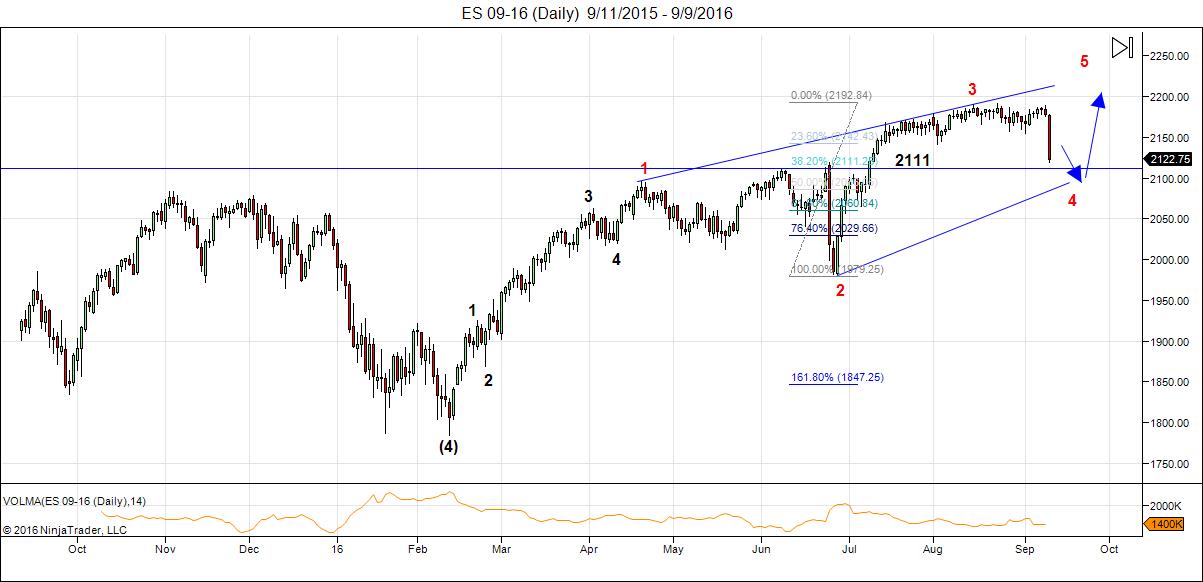
This brings us to today. What you see here is the daily chart of ES (the emini SPX futures).
I’ve been projecting an ending diagonal end to this final wave up since around April of this year, and it continues to play out more or less to my vision. The pattern is clear in terms of the forecast. We’re in a fourth wave of the ending diagonal. We should have a bit more downside, but the limit is when the lower trendline ceases to converge with the upper trendline. So we really can’t drop much below 2100.
We’ll then have a turn up into the final fifth wave (a “blow-off” wave), which will go to a new high (perhaps around the 2215-2220 area) in three waves.
We have a Fed announcement slated for the 21st of September and I would project a B wave possible (of the final abc fifth wave up) at that time. I would expect the remainder of this 5th wave up to take us into October and result in a final top during that month.
Ending diagonal are part of either a C wave (in the fifth wave position) or fifth wave of a final motive wave. In this case, we have the former. It speaks of a very weak market. It’s essentially a corrective wave (in either instance) that’s not able to format a full motive wave in 5 waves. It will end in a dramatic reversal.
And that brings to close my “big picture look” at the role of cycles.
My message in that regard it to temper your major natural cycle predictions with the fact that we’ve had the largest human intervention in the market in history. The gods in the heavens must be reeling. However, they hold the ultimate power and will win in the end.
The bad news is that the downturn is going to hurt everyone it shouldn’t very badly for a very long time. The good news is that we’ll have a much better world when it’s all over. The work of Dr. Wheeler tells us that. Democracy is advanced at the end of every great revolution. The people always win.
_____________________
_____________________
IT’S BACK!! Subscribing to Comments
You’re now able to subscribe to comments on individual posts. That triggers an email that will be sent to you instantly whenever there’s a reply to that comment. You’ll be able to subscribe to any replies that follow individual comments you make and you can subscribe to all comments on a post, so that you don’t miss an important comment during the week. You can also subscribe to all comments without making any comments yourself. Here’s the option just under the submit button:

You’ll also be able to unsubscribe at any time or change your subscription options. Remember, it’s per post. I do a new post each weekend, so if you want to subscribe to all comments, each week, you’ll need to re-subscribe each week to the new post. You should really need to worry about unsubscribing to old ones, as once a new post is live, you wouldn’t expect to get replies to old posts (as they’re not as readily available – although it could happen).
That’s not a worry, as you can change your overall subscriptions at any time. There’s a link in the email you receive to let you do that.


Peter thanks for new post. If market tops in oct. So that will help hilliary to qin election
That’s interesting. I would say exactly the opposite. Incumbents always lose in a negative economy. As we really don’t have an incumbent situation here, my leaning is towards a turn away from the previous government. There are arguments either way. Clinton represents the establishment, the elite, the one percent.
You must be a speed reader, btw! 🙂
Thanks for such a rapid reply. My keyboard is still warm.
“We’ll then have a turn up into the final fifth wave (a “blow-off” wave), which will go to a new high (perhaps around the 2015-2020 area) in three waves.”
2215-2220. Most readers I’m sure will understand your intent anyhow.
pedro,
Thanks for catching that. Corrected now. 🙂
Very interesting article! Love the way you use your wisdom and knowledge about natural cycles to predict the market. Pretty intensive weeks coming up.
Thanks … agree. 🙂
Wow, Peter, your posts are so informative! I am a believer in much higher equity prices going forward due to CB equity purchases (switching from debt to equity as core holding) and energy/materials/AI/robotic evolution, tho’ that will require absurd valuations. Given the relative size of the bond market to stock market any shift of money from bonds to equity will have outsized effect.
Hi Valley,
I’ve taken the stance over the past few weeks that my posts have to move towards being sections of my book. I’ve been wanting to tie together the bigger picture for awhile now. The challenge I have is that this post doesn’t touch on the complexity of the changes going on throughout the world. This post this morning gave me some time to think through where we are a bit more in terms of what I see going on. How do you record all the stimuli from so many sources? So this is very high level (in terms of simplistic).
I did an analysis of 30 year bonds in my last chart show (hour long program that I do each week) and TLT is at the top of an ending diagonal, as well, so we’re likely to see it descend with equities. Put that in your pipe and smoke it … haha. I don’t mean that in any detrimental way, or to you directly. It’s more to point out that our pre-conception of what might happen from a logical standpoint doesn’t necessarily reflect what’s going to happen this time, as we’ve never really been here before. For example, I don’t know that currencies have ever moved lock step with the US equity market before, nor the entire world been connected financially to the degree it is now.
Anyway, that’s what the technicals are telling me, and I tend to listen to the technicals and pay lessor attention to logic. We’ll see what happens ….
Thanks, Peter! Your response is appreciated.
I am very much in your way of thinking Valley. How ever, I believe Peter will be correct over the next 2 months. Another semi high after this scare in the markets this week. I will be shorting the market after we retest the highs or slightly new highs in the next few weeks. We have a Gann date slated for Dec 6th. This is a very long term cycle date, so it can be out a week or two. From late Dec I will be going long for what I see as the mega top with the bond market pouring money into the stock markets world wide. Dow 24000 easily to be conservative. All the best every one.
The Dec 6th date is slated to be a low.
Thanks, Dave!
Great post Peter! Stepping away from the bark on the trees to see the forest is wise
Question now is can/will they do it again another QE at just the right moment.
Hi Ellen,
My thoughts on this are twofold.
1 – They’re pretty well out of fire-power. The Fed’s balance sheet is pretty much exhausted, and
2 – The problem is that successive QE’s are supposed to have increased inflation, which they haven’t. So even if they try, it’s not likely to have much affect.
And 3 (now that I think about it), EW tells me we’re all but done.
Peter, could you have a quick look at the Aussie market and tell us what you see. Has it completed its 5 up. Doesn’t look like its following the US. Looks to be in a world of hurt.
Red Dog,
Sorry, that’s info that I provide for my Trader’s Gold members, but there’s a clue in the beginning of the post. More than that, I can’t provide.
No worries mate.
What happens if we go below like 2090 in this correction now? Only ED pattern is logic now, I agree but what if somehow we see 2060 and go up again…? Somehow still not some kind of tweaked ED possibility Peet?
Cheers,
E
Trendlines would start to diverge at about 2070, so we could come down to about that level. But below that, we wouldn’t have an ending diagonal any more.
E = W of course. 🙂 Stupid telephone. 😉
That is what I was hoping for, that we can go a 1% lower than 2100 (fits my own target), ty Peet!
All the best,
W
Thanks Peter, excellent post as always. Some very interesting times coming up. Thanks very much.
To Steve and Philip Lee, who both commented on my ‘comment’ about Waves within human lives. I have responded to those in Peter’s previous post.
Thank you Purvez, I enjoyed your response, and have posted a reply in Peter’s previous post as well.
Philip, the questions you ask in your post are highly relevant but unfortunately with these ‘beginning’ thought processes and very little data they are impossible to answer. However they are very similar questions to the ones I have.
The most burning question for me is whether everyone starts out at the ‘start’ of a wave whether 5 or 3 (i.e. 22+ or nearly 14) or is it possible that people are born half way through a cycle. I currently have one situation where I was expecting a wave to end around the 59th year but it seems to be continuing. I can’t tell whether I have the start of the wave count wrong OR just like in EW waves can ‘extend’. ….THAT would throw a whole bunch of EXTRA questions!!
Philip, our family knew a Hindu chap who was a diamond dealer by profession but his real passion was ‘fortune telling’. Well…not in the ‘crystal ball’ sense but if you gave him some one’s date of birth and EXACT TIME of birth then he would use his astrological calendar of planet positions etc and map out a person’s ‘good and bad’ years. No specifics just which were going to be ‘good’ years and which were NOT.
At the time I was 11 and just pooh pooh’d the whole idea because there was no ‘scientific’ basis for what he said.
However the reason I remember him to this day is because one of my friends told him his date and time of birth and this guy suddenly clammed up. He would NOT tell this guy anything about his future whatsover.
My friend contracted typhoid when he was 19 year’s old and died within 3 months. I still get ‘goose bumps’ thinking about that incident.
Greetings, Purvez. I love your stories! This idea of yours definitely deserves some time spent on research. I will be sure to come back to you with observations after a period of study. Many thanks again!
Dow and Snp both have head and shoulders tops in place. Friday was the volume/volatility breakdown. Afterwards, any rally back is supposed to stop around the neckline. How does this fit with your ending diagonal??? Obviously the head and shoulders could be wrong, but the volume pattern seems to be correct. Anyway, a change of direction is beginning.
Andre’ Do you ever watch the u.s. bond market ? There is trouble , as rates rise.
Just a short answer will do….nick
No, don’t look at bonds. I trust my indicators. That there is trouble I know and if you read my weekend post it’s all there. For me 9/19 is the final turn. Also said that in my system the bearmarket started 4/27. So time is running out.
The T-bonds were sold last Friday together with equities and don’t participate in rally today.
This rally is very strange.
This ‘rally’ is a countertrend move. The turn will be violent.
Well I um..ah..um.. have had my um..um.. fill of um financial ah … ah BS by watching … ah .. um Brainard’s um Fed um speech and ahhh..um interview .. in the last ah, um hour.
Good commentary by Peter Temple ladies and gentleman! 😛
If you’re not watching her, she’s brutal.
Or rather, if you are watching her, she’s brutal.
I do not watch ‘news’. 😉 Still, this move surprised me… I would think the wave down hasn’t finished yet but this crazy move up tells us otherwise???
Yah, it seems like they don’t want this to fall for more than 1 or 2 days before they prop it up again.
My cycle dates said a low on 9/12. Next time in Spanish?
What does it mean by “low”? looks like it’s “up”.
Jas, the upmove usually comes after a low, so I think I don’t understand your remark.
Thank you for your answer.
if you take the take the January 1973 high and August 1987 high 100 % in time gave the March 2002 high then fell for 6 months 7th month was low in price, 200% in time is next month.
Espanol porfavor! 🙂
😉
Today looked more like a correction than a W(1) of the final wave.. Tomorrow I will be watching the 1st 30min candle. a break above or below should set the tone for the rest of the day.. I think we have more downside to come..
Short term projection: Tuesday market will bottom at about 1PM E.s.t., then rise until Friday. Next week will be the shorting time.
Valley, the machine says that 9/14 is a strong date. So I expect 9/14 low, 9/19 high and then 9/27 low.
Cheers,
André
Andre, before you said 9/14 and 9/15 are strong, then 9/15 are low too. Right?
Jas,
I said 9/14-15 strong and will cause the ABC. So probably 9/14 in late trading. With 2 strong dates the market will use the midpoint, The vribrational cycle is up so I expect a higher low before the jump up into the weekend.
Don’t forget we are swimming against the tide. Once the market starts trending again (soon) trading will be much easier and retraces less deep.
Hope this helps.
Thank you!
Bought SPY call at 1PM E.s.t.. Thanks, Andre’!
“machine says that 9/14 is a strong date. So I expect 9/14 low”
“9/14-15 strong and will cause the ABC. So probably 9/14 in late trading…expect a higher low”
2119.90 “higher” low at approximately 3:25PM…nice call…be well!
Hi Valley, I was also going to liquidate my shorts this morning As I was about to, I had a nauseating feeling in my gut. I have to go with my gut feeling, although my intellect mind says to sell. All the best to you and every one else.
http://www.zerohedge.com/news/2016-09-12/tent-cities-full-homeless-people-are-booming-cities-all-over-america-poverty-spikes
Crisis? What crisis? Gives a new meaning to the word ‘recovery’.
One technique I have is trading day timing. Using the 2015 high thsi timing gave a high 8/23, This makes a lot of sense as 8/23/15 was a major low and the mipoint of 2 long term vibrational cycles. So 1 year later should be a sensitive date and the trading days gave 8/23. This same system now gives a low 10/17. The midpoint between those 2 dates is 9/19.
My power dates gave a high 9/19 and a low 10/14. Just a little additional confirmation.
Trading days are calculated on price. So the 2015 price holds the key to vibrational timing. Time is price vv.
The ATH 8/15 was 2193,81. The square root on this price is 46,8. Add that to 8/15 and we have date 1 : 9/30. Now we take the square root from 46,8, add 1 and resquare. Now we see 61,5. Add that to 8/15 and we get 10/15.
So the ATH price gives 10/15 and the 2015 price gives 10/17. There is order in the universe. Hope you see now that the market is just one reflection of the vibration.
Ps. Adding 1in the calculation is 180 degrees in the square of nine. So 45 degrees is 1/4th of 180.
If we divide 46.8 by 4 we get 11,7. Adding 11,7 to 8/15 (and keep adding) we get:
8/15
8/26
9/7
9/19
9/30
See? 9/19 is a very significant date.
Interesting info on Hilary and her health (from my astrologer).
https://vivacombusta.com/2016/09/12/quickie-observations-on-hillary-clinton/
Valley,
Great call! You absolutely “nailed” the 1pm EST low on the S&P…
Thanks, Ed! It is more fun to be right than otherwise =)
(trade was based upon PALS being positive, and daily moon pattern “usually” bottoming out at 1PM)
Insight time: If you’re watching the SP500, you’ll notice that we went into a 4th (B) wave and topped at almost 2136. Then we came down in 5 waves and then bounced to complete a 2nd wave (62% of that wave down).
That tells me that we have a third wave of the C (of C) ahead of us.
You also likely noticed that the SP500 bounced at the previous low, which is a major inflection point (support). Very often you’ll see that we’ll get a bounce and go into some sort of third wave to be able to plow through the support. That appears to be what we’re doing. You’ll see this kind of action a lot when we get into motive waves down (after the final top).
that means you are expecting a move lower…is that correct?
Oops. I posted in the wrong blog post – a present, if I’m right 🙂
Yeah, I’ve been expecting a new low.
thanks!
More interesting Hilary and her health: http://www.zerohedge.com/news/2016-09-13/former-hillary-secret-service-agent-explains-why-her-fainting-video-really-scares-me
There are several wedges over multiple sectors broken to the downside and checked back. I am in the camp of this being a W4 but as long as SPX under it’s 50 SMA i will look to short every pop. Everything looks really bad and has me second guessing this being a 4. To me SPX 1900 looks like the target then bounce.
This weekend I explained how price can’t give the real cycle as price is noisy. My cycle dat gave 9/12. The 9/13 low was just 3 points (S&P) lower than on Monday. That was noise; not significant. So Monday up was a first wave and Tuesday down a second. Now up into the strong 9/19 date. Next week we will see the same thing. Monday will be the cycle peak, but Wednesday the price high.
After that everything is down into march 2017. There will be highs in between but from then on the highs will be lower.
This weekend some details on the roadmap into 2024.
Cheers,
André
Morning Andre, what do you mean by “now up into the strong 9/19. You think this Thursday and Friday are also up and no ABC?
Jas,
That is exactly what I mean. The Tuesday low was the bwave down. 9/19 will be the high.
Thanks!
https://worldcyclesinstitute.com/meanwhile-back-at-the-contrarian-corral/#comment-10715
“too many people are aware that the market ‘never’ makes a significant top during August and have cited various examples to include the top made on September 3, 1929…”
https://worldcyclesinstitute.com/a-storm-is-brewing/#comment-11237
“Mid-September, 1929…The market fluctuates wildly up and down.”
One reason the 1982 bottom was not believed was major bottoms never happened in August. It even fooled Joe Granville. Wouldn’t it be ironic if34 years later ——?
?
André,
I think the top is in, and this rally this morning will reverse and head lower to take out S&P 2119.
Every wave has subwaves. This weekend I said the ATH stands. but 19/9 will be a high. That is what I think. We’ll see.
Failed to break 2119.. 3rd attempt.. Odds to go higher just went up..
You were right. 9/15 will be the low. So the upmove will come. But just a little later than I thought. Seems like price cycles lag the vibration/momentum timing. 9/12 + 3 = 9/15. 9/19 +3 =9/22.
I have got a different view we will decline into Friday/Monday and after that we will rally again till Sept 29.
there is some importance of sept 16-19 and sept 29-oct 4, some are saying setp 16-19 is top others saying bottom
Today wave down in SnP looks pretty motive
A lot of longs equities and shorts VIX.
Options expiration on Friday may be ugly.
Needs another 1.4% downside to hit the C wave target. Hopefully get it tomorrow otherwise I don’t know what’s going on. Might just go long for wave 5 very soon.
PALS market outlook: Thursday, open higher mixed from there, Friday, open higher than Thursdays open, mixed from there. Will look to short any market strength next two days for perfect short set up next week (according to PALS).
Sell off has occurred early. Won’t be shorting next week unless from higher levels.
Hi Peter
your post is spot on
id like to note, having been up and down the west coast between the Columbia river and long beach California over the past 43 days . i noticed a significant temp change ( cooling ) from mid august to now . it never actually warmed back up . initially it was warm out in the pacific ocean yet it appears to have cooled ( nothing exact just a simple walk around outside while at sea ) i found myself closing the door to the wheelhouse versus leaving the door open . another thing anyone can do to follow their own local climate is to look at their electric bill . it might not be exact science but you will see the average monthly temp for the month of the billing . i have kept track of it for the past 7 years in southern oregon . like clock work the average monthly high is in the oct nov time frame . im curious to see how this years temps fit into this or if this cooling i noticed out in the ocean shows up on my bill .
as for the cycles of this market im seeing the end of sept as important .
the dates of sept 16th ( tomorrow ) into sept 30th is the next short term cycle
there are a few concerns on direction , the key date in that range appears to be sept 23rd .( a 2 year cycle high is possible )
for the dow , 17875-17700 is support
18125 is short term resistance that must be broken to signal any type of low in place .
18380 needs to be taken out to signal any type of breakout coming
18760 is the key break out point signaling a continued rise .
Ive only dug into my close only cyclical charts so as of yet i dont have overbought or oversold readings to go by to judge this market .
ill say this the bearish case is very much on track as of today based on the cycles
i don’t see any failures as of yet .
the end of sept into early oct would be where id look for a low if the market continues to break down next week .
we are now into the worst part of the bearish cycles so this is no time to be complacent as people may just panic and sell with no intention of buying back in
any time soon ( to many unknowns do to the elections )
as for your political thoughts ( which again i agree with )
people don’t realize that the congress and senate are next!!!!!!
Joe
You really shouldn’t notice it the colder temps too much in your bill, as oil and gas are tanking and will remain low for a long time. Otherwise, you would. The first part of the colder cycle in cold/wet. You can see the wet part in all the floods around the world.
EW says the market can’t break down until the pattern is complete. We’ve had a really cool, wet summer in Calgary. I expect a very cold winter with lots of snow.
The market continues to remain difficult to trade …
Thanks for stopping in!
WEEKLY SOX ( semi’s )
this index on a weekly chart appears to have many subdivisions left
in the big picture . a new high into early oct is possible as the top of a 3rd wave
( wave v of iii )
whats left would be iv , v3,4,5
its going to take some time for all of the subdivisions to trace out .
early January would fit for the wave iv of 3 which would still leave
waves 3, 4 and 5 .
We may finally be heading down into 3 of c of C of 4. I see quite a bit of resistance in the 2151-2154 area of SPX from a fibonacci perspective. I also count 5 waves up from yesterdays low at the close which should mean the turn will has come.
If it completed at 2151.3, then wave 5 would equal the wave 1*1.618, which i see as 2119.92-2128.73
Ted,
the last wave up from 2123 SPX looks very motive but not complete yet. It should have finished the 4th and still has the 5th to go up.
If so, it may mean that the big wave down last Friday into Monday was corrective and we had the 1st up of bigger degree last Monday than 2nd until Thursday and we are in the 3rd wave up now.
Last post until i have gotten through all my data .
Question for andre
you talk alot about vibrations and today something just hit me .
The hourly dow chart . july 20th to date .
while this is not an elliot wave pattern per say count the points .
july 20 high to august 2 a sound wave or vibration measured by the dow .
the counter vibration up into august 15th being a wave “C” of a narrowing triangle
followed by wave D on sept 1 with final wave E 10 days following the mercury retrograde
start date . Kboom sound wave, “vibration”
my question now is where is the mid point of the waves A through E ? 50% =18,458.11<—–KEY
Your thoughts ?
sept 23rd ????
very curious
Joe
Joe,
I concentrate on timing and less on price levels. Not sure how you measure sound waves so hard to answer. Let me post my analysis this weekend and see it we can match dates. 9/22-23 is certainly very vibrational.
Cheers,
André
Not soundwaves Andre, but rather,speed of light. It is still a wavelength and it gives accurate future CIT’s.
This is because energy has 3 essential elements.
1. frequency;
2. wavelengths; and
3. colour.
Further comment a must !!!!!!
the triangle was a massive reversal triangle !
everything has subdivided even further
Wave D sept 1
wave E sept 8th
Wave D to Wave E was another narrowing final triangle .
18551.54 -18448.75=102.79 pts
18500.145 mid point .
so both the 18458.11 and 18500.15 Key .
thats my line in the sand where i abandon my bearish bias .
( thats also where im looking to establish bearish positions )
Now ill let my further research give me merrits to prove
my thesis .
These are the same bearish cycles as the 2008-2009 time frame.
Andre,
Your cycle/ vibration work has been “spot on”! Thank you for sharing!!
18500 target high with a 17572 initial downside target .
the vibration 🙂
Timing model updated .
its all bearish in my view but who knows
http://imgur.com/81Lnkn4
Thanks, Joe
fridays close at 18123 Unofficial close
thats 2 pts below 18125 which is a bearish close
i cannot rule out a further breakdown traveling many points .
we are now beginning the worst phase of these bearish cycles.
beginning now and again after sept 23 all cycles kick in pointing down.
joe
Last weekend I said 9/12 would be a low, that 14/15 were strong and would cause the retrace and that 9/19 would be a high. S&P made the low Monday, stayed flat until Wednesday night (midpoint 14/15 and started rallying on Thursday. Little retrace on Friday and green close.
Seems like vibrations do actually work. Found some other interesting stuff this week so I fear the post tomorrow will be lengthy.
What I can see now simply confirms what Peter said : the winds of change are turning into a storm. No, tornado. Hurricane!
In short : 2014 showed the first major weakness since 2009. 2015 saw another cycle turning down, causing the high in NYSE. Other cycles were up into august 2016. The last cycle I see points to this weekend.
Tomorrow I’ll show some of the cycles but they can’t change what I said before; this will be the longest bearmarket in history. Before this is over we will see another world. A better one, I hope.
André
From Dan Ferrera I learned about the crash angle. This is simply the angle between the birthdate of NYSE and the 1929 high. No assumptions, no theory, just listening to Mr Market. This is the most dominant angle we have and it sits at 122,143 degrees in the square of nine.
Last weekend I said I consider 4/27 as the start of the bearmarket (was 8,5 years after october 2007).
Using the crash angle on 4/27 was get dates. In the 6th cycle I get 9/17. Why is this significant? We all know the power of squares. But in a 3 dimensional world, a square turns into a box. And a box has 6 sides. That is why 6 times 360 degrees is very important.
So this system gives a rythm. This is just one of the systems I have. But it gives a midpoint 3/15/17. And it is an input for our long term roadmap.
Using this same angle on the 1929 high we see 5/21/15 was the midpoint of the 88th and 89th cycle. This is 14 times 6 plus 4,5 cycles or 270 degrees, Don’t underestimate this angle!
Square root on price is the most basic Gann technique we have. The 1974 low is significant as it is 8,5 years after the 1966 high. The S&P price in that low is 577,6 or the square of 24. Read ‘The universal clock’ and see why 24 is such an important cycle. So this price in 1974 was not just any price; it was coded from the beginning of time and that means the date is equally important.
This square root method should be used in 2 ways : calender days and trading days. In calendar days we get : 4/13/16 and 12/16/16. The midpoint is 8/15, the ATH.
In trading days we get 4/27 and 2/22/17. The midpoints in dates is 9/24, but as the square root method doesn’t give a straight line the actual midpoint is 9/22,
So 8/15 and 9/22 are major vibrations. The midpoint is 9/3. This gave the 9/6 high (after laborday). The midpoint between 9/3 and 9/22 is 9/12. This shows why 9/12 was so important to test and gave the low.
So this system (very different from the crash angle system) says that the market is stuck between 2 significant dates and that 9/22 is a capitulation date. I said that before, but now you can see why.
This is another system we can use for the roadmap.
Astrologers will say it is the equinox. I say the equinox (and the FOMC meeting) are expressions of the vibration. So this we way can predict there won’t be a rate hike; the Fed simply can’t. They don’t have a mind of their own; they are slaves to the vibration. And they don’t know it.
And now an analysis you won’t find anuwhere else.
From the 1974 low into the 2007 high was (almost) 34 years. When we assume this was 90 degrees we can calculate vibrational dates. My system gives 48 vibrations for 360 degrees, So every vibration has a number. Looking back, the 2nd gave 2/4/1983, close to the 1982 low. The 7th (+5) gave 3/25/2000; the 2000 high, The 12th (+5) gives the 2007 high. The 17th gives 4/21/15. This have the 2015 high (Europe gave the high in april).
This way we get a unique harmonical vinbrational timing.
The 18th vibration gives 2/14/18. The midpoint between the 17th and 18th is 9/17/16. This exactly the crash angle.
So april 2015 should have been the high, But the 34 from 1982 was up into august 2016 as was the Jupiter cycle and the dasha, So the market had to choose another point for the high. The general rule is that when the market doesn’t turn at the beginning of the cycle, it turns at the midpoint. This is a 17 (!!!) month cycle.
This analysis is objective, uses market dates, and signifies what is happening. Ever since 2015 we have been targetting this date. No wonder things have been quiet for months.
The 22nd vibration (17+5) gives 6/9/2032. This is what Armstrong gives for the low in the real estate market and it is 17 years after the 2015 high.
So the dominant cycle we are living in runs from may 2015 into june 2032. So it is early days for what is about to happen. Nobody can stop this,
2032 would be 100 years (squared number) from the 1932 low. Coincidence?
Does this mean we are down into 2032? Even I (;-)) can’t look that far in the future. But for a low in 2024 I have very strong reasons and when you consider what I show here that should be considered conservative.
Cheers,
André
A W E S O M E! 🙂
Cheers to you A,
W
Last one for today. David McMinn found that financial panic is tied to trines in the lillith-node cycle. And indeed, the 1929 crash was within days from a 240 degree angle. If McMinn is right, the midpoints of these cycles should have significance.
9/21-22 lilith will be exactly at 60 degrees; the midpoint of a trine. 360 degrees takes 6 years, so 60 degrees takes a year. 90 degrees will come 3/24/17, exactly 17 years after the 2000 high. Nice!
This website is for educational purposes relating to Elliott Wave, natural cycles, and the Quantum Revolution (Great Awakening). I welcome questions or comments about any of these subjects. Due to a heavy schedule, I may not have the time to answer questions that relate to my area of expertise.
I reserve the right to remove any comment that is deemed negative, is unhelpful, or off-topic. Such comments may be removed.
Want to comment? You need to be logged in to comment. You can register here.