
 This week, I’ll add to the similarities between the lead-up to the Great Depression of 1929-39 and the economic situation today.
Gold, Interest Rates, and the Great Depression
At the beginning of the depression, all countries were tied together by the gold standard, if you had high interest rates, people would move their money to your country, as they’d get a better return. But at the same time, money in the country with low interest rates is “cheap” to borrow just as it is today in most countries (in fact, we’re involved in currency wars). It leads to speculation in the stock market. It always does.
We’re not on the gold standard any more, so the value of currencies fluctuate; they’re not tied together (that’s the effect of fiat money). Governments today notoriously inflate to reduce the value of their own money so that their products are less expensive on the international markets. In that way, they sell more, resulting in more money flowing into their country. (If you can lower the price of your products, you sell more and become more profitable).
Because of “a deal” between Bank of England and the Federal Reserve to keep US interest rates artificially low, US dollars were inexpensive to borrow and this fuelled speculation in the stock market, the same phenomenon we have today. However the difference is the gold standard, which allowed manipulation of monetary value between countries. Today, currency rates float, so international market forces have a much bigger hold on currency values.
In spite of the manipulation, US Treasury rates eventually started to sneak up, particularly in 1928 and this forced the Federal Reserve to raise rates.
It’s the same situation today. Exactly. And we’ve seen the Federal Reserve react and pretend that they’re in complete control of the economy. However, they have no idea where the economy is going and are simply reacting to market forces. Obviously, behind the facade, they have to be scared to death.
Politics and the Economy
It’s much like politicians taking credit for the economy. They have virtually no affect on it, but they’ll take credit for it, like President Trump is taking credit for the stock market rally. And when it turns around on him, look out! We always vote leaders out when the economy turns down.
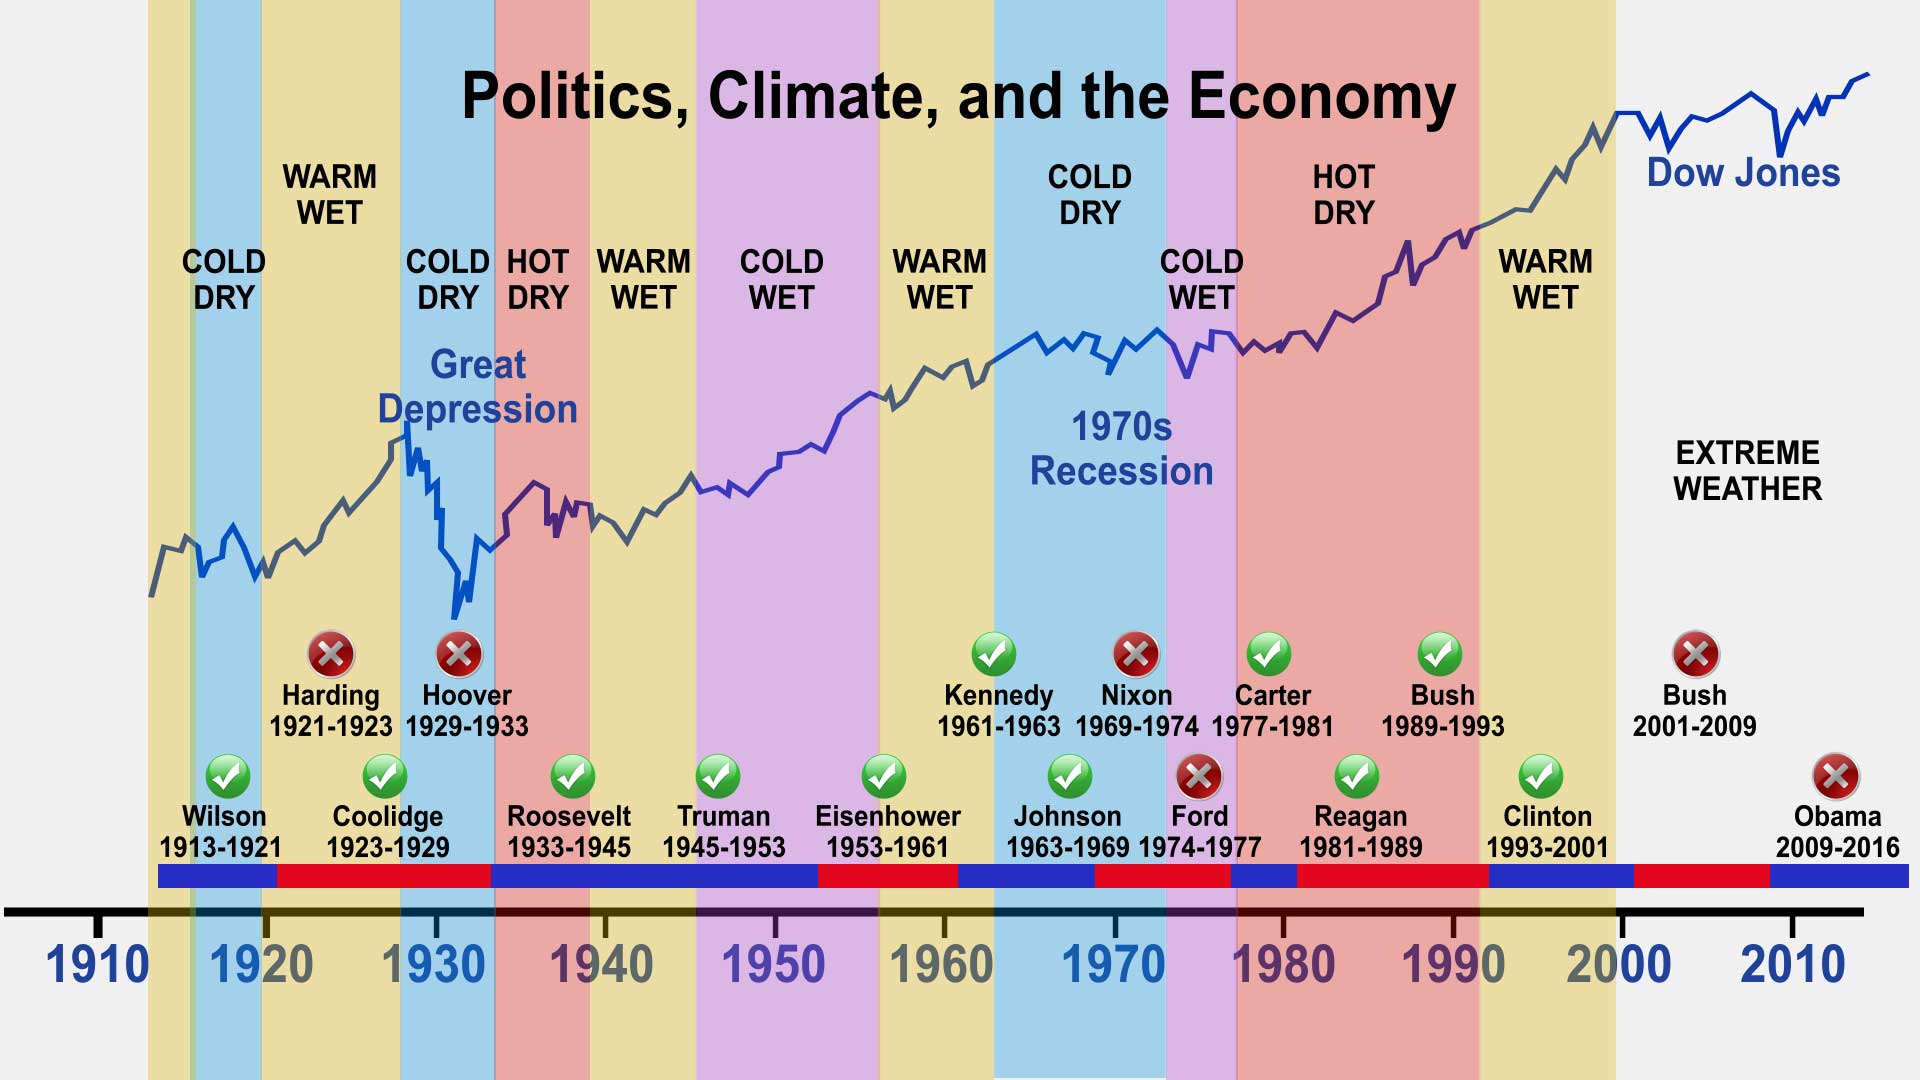
Above is a chart of the US Presidents from 1913 through 2016. You can see the politicians who were liked and are considered “good leaders” by historians (green circles and check marks). The there are those we dislike (red circles and x’s) and threw out of office because “they destroyed the economy.” Well, of course, they didn’t, but if I were a politician, I’d be very careful about when I ran for office.
The chart above shows the impact of the stock market (the DOW is the blue line). There’s an underlying parallel with the climate. You can also see this on the chart. At some point soon, I’ll put together a video on this topic. However, I do have one on how the economy parallels the ups and downs of the DOW. You can find it here.
Interest Rates Before the Great Depression
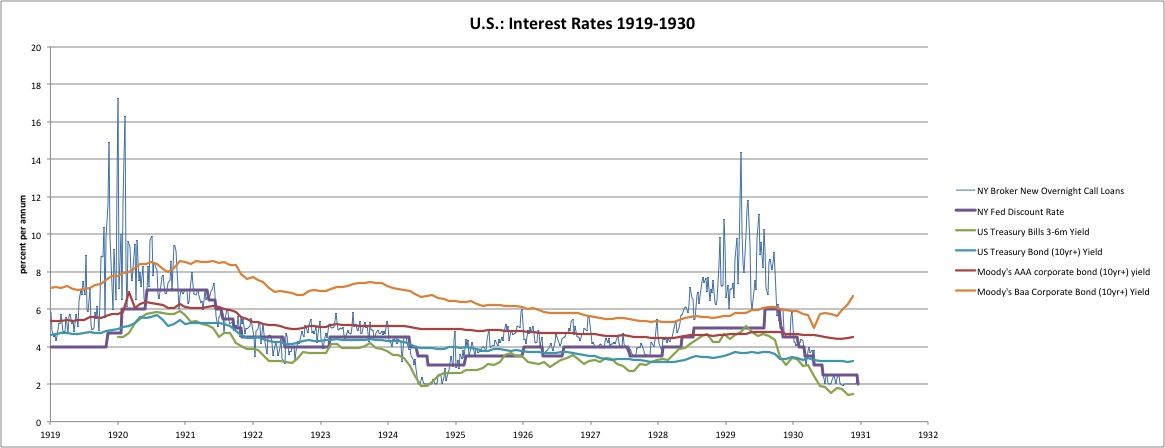
The above chart comes from New World Economics and tracks the US interest rate during the 1920s, leading up to the Great Depression.
What’s important in the chart above is the fact that the Federal Reserve does not raise rates “on their own.” In fact, when Alan Greenspan was asked on CNBC, “Did you keep the interest rates too low for too long in 2002-2003?” blurted, “We didn’t raise rates. The market did.”
You can see on the chart above that the green Treasury Bond (10yr+) yield began to rise going into 1928. The Federal Reserve was bound to follow (purple line) and, sure enough, it did.
Treasury Rates and the Economy
The U.S. Treasury sells bonds at auction. It sets a fixed face value and interest rate for each bond. If there is a lot of demand for Treasurys, they will go to the highest bidder at a price above the face value. That decreases the yield or the total return on investment. That’s because the bidder has to pay more to receive the posted interest rate.
If there isn’t a lot of demand, the bidders will pay less than the face value. That increases the yield. The bidder pays less to receive the stated interest rate. That is why yields always move in the opposite direction of Treasury prices.
When there’s not much demand, then bond prices drop. Yields increase to compensate. That makes it more expensive to buy a home because mortgage interest rates rise. Buyers have to pay more for their mortgage, so they are forced to buy a less expensive home. That makes builders lower home prices. Since home construction is a component of gross domestic product, then lower home prices slow economic growth.
Rising Treasury rates then, are deflationary. As rates rise in the market we’re currently in, at some point, the market is going to head south. What will that point be? That’s the big question. I don’t know the date, but through Elliott waves, I’ll be able to tell you the market price point.
Low yields on Treasurys mean lower rates on mortgages. Homebuyers can afford a larger home. The increased demand stimulates the real estate market. That boosts the economy. Lower rates also allow homeowners to afford a second mortgage. They’ll use that money for home improvements, or to purchase more consumer products. Both stimulate the economy.
The Current 10 Year Treasury Rate
So rather than watching the Federal Reserve and interest rates, it makes much more sense to watch the TNX chart below and you’ll have a much better idea of what’s going to happen at any of the coming Federal Reserve meetings.
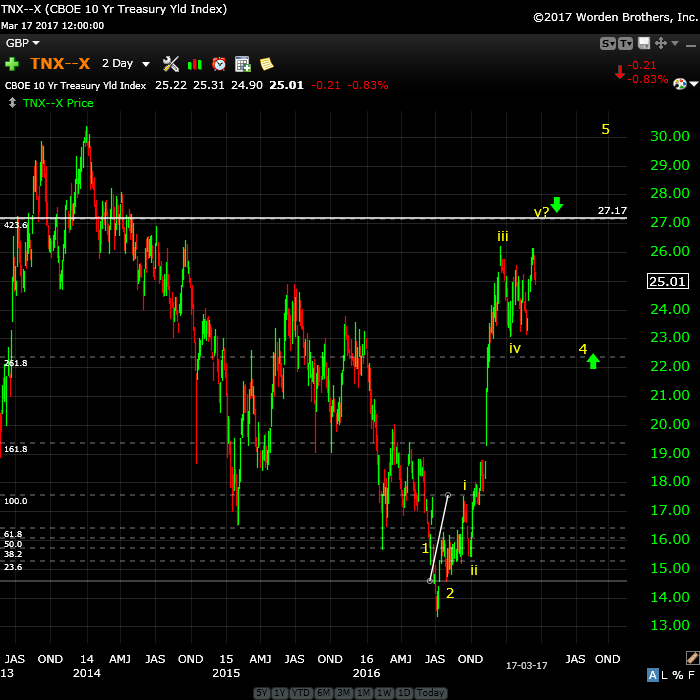
Above is the two day chart of TNX (the 10 year Treasury yield). Treasuries have bottomed and are sporting a very nice motive wave up. We’re currently in a fourth wave of the larger third wave at the moment.
I’m expecting a retrace lower to around 22.00 or so and then a large fifth wave up to a new high. After that, we’ll get a 62% retrace and then a much larger wave (1.618 X the first wave) to an even higher high. Sometime during this process, the pressure is going to grow on the stock market and it will top.
We’ve been there before, we’re here again now, and it’s just a matter of time until the larger market tops … and drops.
What’s important is that it’s not the Federal Reserve that determines the future of the market, it’s actually the market itself. However, humans don’t necessarily think that way and so you can have a really good grasp of the future by keeping an eye on Treasury rates. You’ll be ahead of the market.
__________________________
Herbert Hoover and the Great Depression
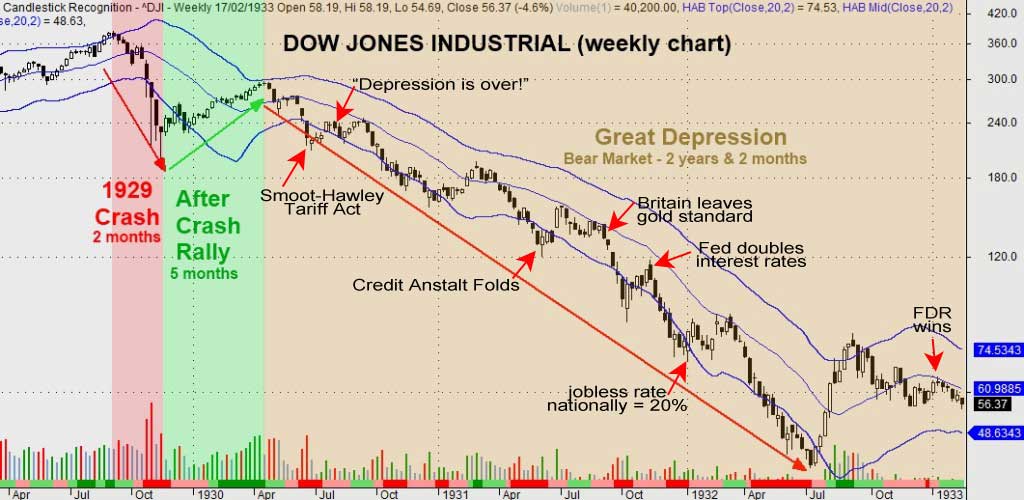
Above is a diagram of the depression era showing some of the major events during President Herbert Hoover’s time in office layered on logarithmic scale chart of the stock market of the day.
Leading up to the 1929 crash, US Treasury rates began to climb and the Federal Reserve raised the discount rate. They doubled them over a two week period in October, 1931.
On June 1, 1930, Hoover famously said in a major speech, “The depression is over.” It was the wrong thing to say and harmed his reputation. He was thought of by many as “out-of-touch” with what was going on in main street America.
The bankruptcy of the the Austrian bank, Credit Anstalt (originally established by Solomon Mayer von Rothschild) was a major blow to the economy as bonds, mortgages, and other loans were negatively affected. It triggered the closing of many more banks in America.
Hoover signed the Smoot-Hawley Tariff Act on June 17, 1930, which raised tariffs on 887 specific products. Hoover called it “vicious, extortionate, and obnoxious,” but signed it anyway. President Trump seems to be heading down the same path.
Franklin Delano Roosevelt came into office in March of 1933. It’s interesting to note that the bottom of the market was already in place by the time he reached the White House. He, of course, had his own problems and there was another stock market crash a few years later.
Britain and most other countries left the gold standard on September 22, 1931 but the US staunchly stayed on it, which was perhaps Hoover’s biggest mistake. This gave him virtually no control over the value of the currency as opposed to other countries, who could inflate their currencies and as a result, came out of the depression much earlier than the US.
________________________
Here’s the latest daily chart of ES (emini futures)
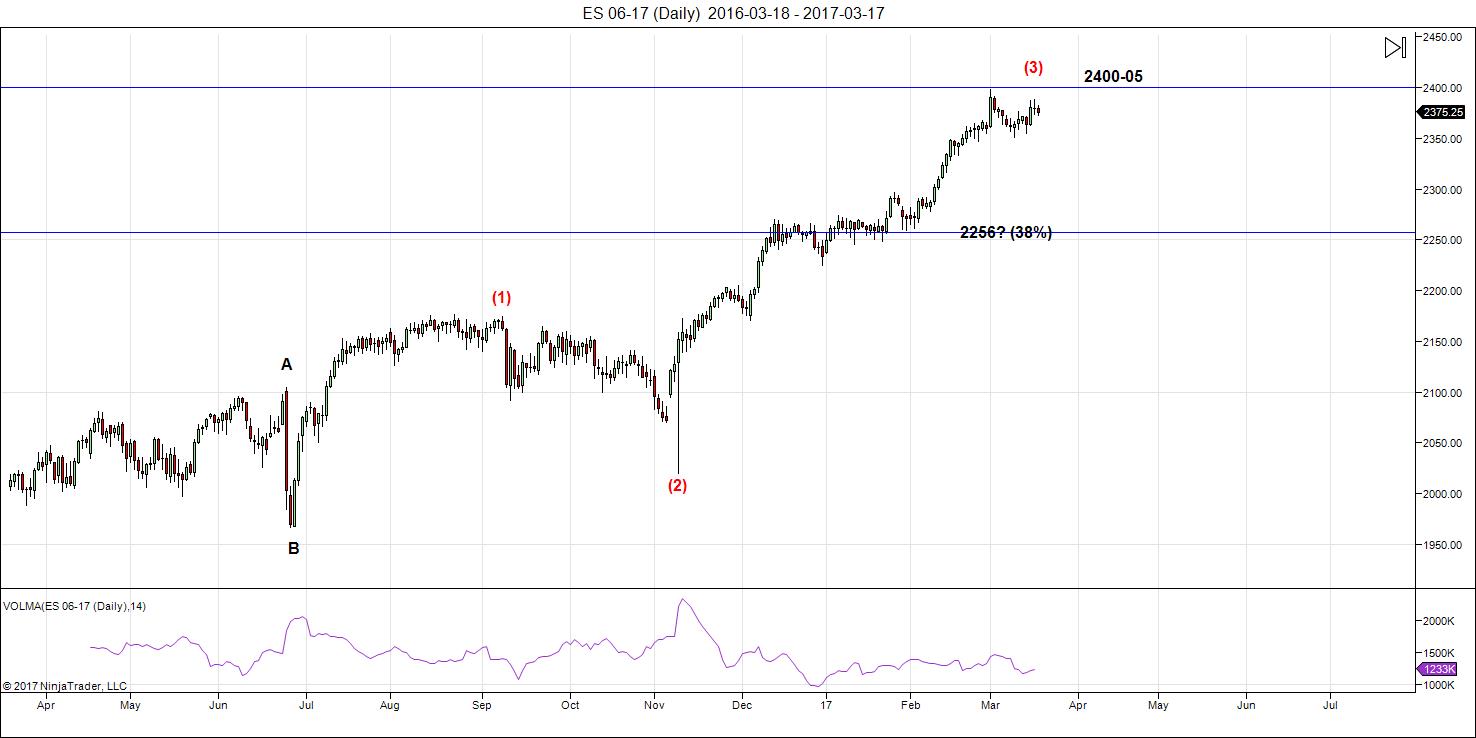
Above is the daily chart of ES. Nothing new here. The full wave up looks to be like a triple three (a combination wave) which is almost at completion (or will be with one small final wave up to about 2406—shown in the hourly chart below).
A short-term inflection point: Over the next 24 hours or so, we’re at an inflection point in ES. I expect the current wave down on a 5 minute chart to drop to 2364 and then bounce into the balance of the current wave up to a new high.
However, if we end up below that level, there’s an option that we’ll continue down in a flat and this could lead to the larger fourth wave. However, this is an alternate count, as the larger wave configuration showing a top after 3 waves up strongly suggests we’re going to a new high.
The bottom line is that we don’t want to be below 2364 as it would work against a continuation to a new high.
The larger 4th wave (after the top of 3 this week) will come down in three waves. After we finish the A and B waves, we should be able to project an end to the C wave of the 4th wave. Once we finish the fourth wave , we’ll get a final blow-off wave. I’m making a point of not projecting a final date for a top because the volume is so low, the markets are so erratic, and they’re moving so slowly.
Here are the path predictions going forward:
- Wave 4 will come down in 3 waves with any of the corrective patterns possibly in play.
- Wave 5 is likely to be an ending diagonal. In any event, it will be in 5 waves (not motive).
Summary: We’re at the top of wave 3 of the final larger 5 wave pattern, getting close to a turn-down into four with one more very small wave up to a new high. I expect all major US indices to turn this week. The larger wave 4 should come down in 3 waves (an ABC configuration to the target).
After completing the fourth wave, we’ll have one more wave to go, which could be an ending diagonal as a fifth wave. The long awaited bear market is getting closer.
_______________________
Sign up for: The Chart Show
Thursday, March 23 at 2:00 pm EST (US market time)

The Chart Show is a one hour webinar in which Peter Temple provides the Elliott Wave analysis in real time for the US market, gold, silver, oil, major USD currency pairs, and more. You won’t find a more accurate or comprehensive market prediction anywhere for this price.
Get caught up on the market from an Elliott Wave perspective. You’ll also get Andy Pancholi turn dates for the balance of the current month. There’ll be a Q&A session during and at the end of the webinar and the possibility (depending on time) of taking requests.
All registrants will receive the video playback of the webinar, so even if you miss it, you’ll be sent the full video replay within about an hour of its conclusion. For more information and to sign up, click here.


Thanks much Peter! It’s okay if markets closed; but not okay if folks like Peter, André , Valley, LizH, Tom stop posting. Thank you all for your selfless sharing. BTW, maybe it depends on your style, but André’s dates are invaluable to me.
🙂
I would certainly add Joe and LizH on that list.
OPPS, LizH is on that list.
Thanks Peter …….Nick
🙂
I second that! Thanks for posting that sentiment!
Peter,
You need to correct in the above commentary where you say …”Hoover signed the Smoot Hawkeyes Tariff Act on June 17, 2017″ …should be June 17, 1930.
Haha … Thanks. You simply can’t proof your own work. Appreciated!
Shouldn’t Carter be a red dot since he was booted out after one term and is widely considered to be a poor president?
Alan,
Well, that certainly isn’t the object of this exercise, and not my data. As I said, it comes from historians.
Hi Peter
Thanks for the update 🙂
We ended up with a delay and flew back from Honolulu
for a week off, Flying back Thursday for about a 16 day trip back
to the mainland . i have a few concerns with the Dow when looking at
it from a timing perspective only . Price wise 20827 on a closing basis
is what id call key support . March 30th is a key date . the advance decline line
did get a bit oversold into the march 9th low . The $skew is at new highs
which is a warning sign of a drop in the market about to come.
me being the bullish one on this page ill state what i see as the bullish
line ups from a timing perspective .
may 18-19th into June 30th keeps showing up as a low to high move.
march 30 to april 21 another low to high move ( end of qtr + 20 days = april 20th )
Sept 18th and oct 3rd ( oct 3rd being key ) to oct 10th <— Oct 10th is now
showing up as a key HIGH.
Oct 31 to Nov 28th with Nov 28th becoming the last key HIGH of the year.
Those are what i m seeing presently as i work through this years key dates.
id say 20827 is the important price for the Dow on a closing basis over the
next few weeks . Lower support now 20327 .
20614-20608 may get tested if we close below 20827 .
On a monthly basis looking at the OEX we are still in a 3rd wave .
a similar situation in regards to the NYA .
the SOX index is still continuing higher .
In the much broader picture i tend to think we are going to go sideways
for a while.
March 30 , May 2 , may 18 should be lows of sorts
( may 18-19th mentioned above)
Extreme support 19748 ( possible yet i doubt it gets tested )
The move from dec 16th to date may be becoming an ending diagonal.
Transports rose 50 % from there 2016 lows .
Im guessing the transports going to new highs and possibly peak into
the june 30th cycle high
the utilities still need another new high .
the dow will probably be the last hold out at the very top .
the NYA into the low 13,000 is a measured move based on a head
and shoulders bottom formation .
A Pull back in the bond market would most likely boost the utilities
The moving average on your weekly Dow chart showing the bear market
of 1929 to 1932 still applies to today's market .
This rally is not based on reality it is based on the assumption that trump
will get his policies pushed through .
Im beginning to doubt he succeeds .
Joe
Keen analysis on interest rates.
I am SO amused over all the jawboning about whether the FED will or will not raise rates, as if they were ever really in charge. I have always contended that the one thing that will jolt folk out of their market delusion was the bond market starting to collapse, which is going to be inevitable with rising rates, which in turn the FED can do absolutely nothing about. Folk who think the central banks can juice this market indefinitely….boy are they going to be in for a surprise.
DOW 40,000.00???!! Yeah…Right! Not in your deluded lifetime buddy. What nonsense I am hearing these days!!!
From time to time, I ask on many blogs this simple question. If we are indeed going to see a government bond crash, where is the money going to ? ( I am one of those who think we shall see a bond crash) What investment vehicle are the Billionares going to run to ? No one has tried answering this very question. i have seen so many Bears wiped out from 2009 bottom to date. As noted in previous post, I am a Bull. Not from the frame of mind that the economy is getting stronger or earnings are increasing. I simply see no other place to put my money besides the stock market to be a head of inflation. Yes, we shall see small corrections and many head fakes to get the bears excited for a short time. I am currently 42 % long and fully expect to be 75 – 80% after a possible 5% shake out . Will slowly reduce my large holdings into the summer months. Good luck every one !
I tend to agree with Joe…the rally is dependent on Trump getting his policies through! The word skeptical comes to mind!
77% of all Fed tightening cycles since the 50’s have resulted in a recession. https://twitter.com/jessefelder/status/843902240490471424 …
What money??!! 🙂 🙂 🙂
I think the collapse of the bond market is going to be so seismic that principals globally are going to zero. Some folk are going to be quick to protest: “Oh, but all you have to do is hold the bonds to maturity!”
Oh really now? And what if the issuer is no longer in business…..hmmnnnn??
Dave
i have asked the same question many times
where do you put your money .
The answer is always go to cash yet the masses have been in cash
or interest rate vehicles for a long time .
Pension funds have been killed by lower interest rates and Ive learned
they basically have to lie in order to keep their funds from being taken over
by the government pension guarantee corp . google search local 707 teamsters
union pension , it recently went broke. those that thought their pension was safe
are now finding out they will only receive 1000 per month .
what pensions do is lie about there return rate on investments, ( there is another word instead of return yet it means the same thing)
in order to keep the pension to appear solvent they make up the rate of return
and say its estimated to be 7 1/4 % yet later lower it which brings them closer to being technically insolvent . i recently spent some time picking the brain of a guy in regards to this , he claimed the rate now is 6 1/2 and i said how can that be ?
i said its probably closer to 3 1/2 % and he replied well we have had a 5 1/2 % return for the past 10 years and i replied well if you have had 5 1/2% over 10 years then how is it you expect it to be higher ? he misspoke and said if the real rate was quoted they would risk having the pension taken over by the government pension guarantee corp . so now what do they want to do ?
they want to close the present pension fund and go to a vap plan which shifts the defined benefit plan to a more 401 k style plan and in doing so the risk will be placed on the union member and not the union pension fund . in addition to this
they intend to use a 5 year average to hide the losses , presently calpers ( California public employee pension fund ) i believe is using a 15 year average .
almost all pension funds in the usa are technically broke right now today.
they are paying out way more money then the fund is returning . in addition
what they are really trying to do is to keep control of union members money
and not actually do what is right. this entire set up will destroy the unions .
they view the new ( not actually new ) plan idea as a way to say this new plan will never be underfunded ( its not longer a defined benefit and the risk is now on the member ) pensions will no longer be defined, the payout will fluctuate year to year based on the actual return. people with 30 years of service on a define benefit plan expecting 3000 per month will find themselves getting 1000 when these pensions are taken over. those with the new plans will see their pay out
drop as the market drops. this is going to be a big driver of deflation as the retired generation finds itself without the money it was promised .
Oregon state is 22 billion short on its public pensions and is trying hard to figure out ways to increase property taxes . they are becoming creative in way to circumvent the present rules on property taxes. the teamsters union default if you look it up will give you a glimpse of what is taking place today in this regard.
i am not a believer in unions yet i happen to belong to one and what has been taking place behind closed doors over the past several months is going to be shoved down by union i m involved with and myself as well as other member are going to lose big when this takes place. i work with people who are expecting 4000 plus per month when they retire and they have yet to really grasp what is being done. what will happen is once these new vap plans go into effect the money going into pensions will be put into annuities as well as the stock market.
in just my companies members alone and not including our total union membership that implies 900,000 dollars per year going into the stock market
and that 5 year average they will use to hide the losses ??? it wont work because they will be averaging from the high into the cycle low due in about 5 years from today . the older fund will at some point get taken over by the government pension guarantee corp , the states will attempt to keep their funds solvent by raising property taxes ( they want to effectively double them ) . the entire plan will back fire, higher property taxes yet lower income for retired people .
The other problem is these pension fund managers are trying to invest based on political correctness and not sound financial views . This is a huge problem and it is getting worse by the day . im living it and seeing it real time and it is happening right now as we speak .
The real crisis is not higher interest rates its THE PENSION CRISIS.
Socialism has died. No realizes it yet
pensions like social security was based on a life expectancy of 66 years.
you were to retire at 65 then die, then had no intentions of ever paying anyone.
its a pyramid yet the base has inverted , only a handful on the bottom with a very fat top . to many retiring and not enough on the bottom to fund it .
the claim is 1 person is support 2 plus people yet it has gotten worse .
i cant prove it but i m guessing its more like 1 person supporting 3 plus or more
and the return rate is a lie.
put another way , you go to work and buy a rental house , at the end of 30 years
the house is paid off and you collect the rent , when you die half of that rent goes back to the union and your wife gets the other half of the rent , when she dies the union gets your house. the entire pension fund on the surface looks great yet in truth its an illusion and they are actually stealing your wealth .
the money is gone i m telling you and the masses are going to find out very soon.
The mighty teamsters ? research pensions is going to be the heart of the problems were about to face
enough of my rant.
The insolvency of pension funds in the US is the dirtiest little secret that nobody wants to talk about. The largest, CALPERS, has made some of the riskiest, stupidest investments you can possibly imagine and will be hopelessly underfunded for the indefinite future. The perpetually low interest rates have spurred the money managers to make risky investments in a hunt for yield. I think CALPERS is holding a lot of bonds issued by the fracking industry. Need I say more? The price of oil and the direction it is headed spells a ticking time bomb for the vast majority of those bonds. Not only are the pension funds who made bad investments in serious trouble. The ones that were very conservative are in trouble as well. Why, do you ask? I’ll tell you. The criminals in Washington a few years ago quietly passed legislation that allowed money market funds to invest in risky assets that they should not have gone anywhere near. Few folk are aware that what they think are safe instruments are anything but, and that most, if not all of these money market funds are holding toxic instruments on which they are going to take serious losses. This is the teamsters Union Pension fund under Hoffa on a national scale. Look at what Obama did to the shareholder of Fannie and Freddie! When people find out what the politicians have done to them there will be blood in the streets no doubt. Bottom line is that many money market funds are going to “break the buck” and there will be no one to bail them out. The smartest thing people in these funds can do is take the money and run, while they still can. Pay the 10% penalty for early withdrawal, pay the criminal thieving cabal in Washington their blood money, and take what is left with the thankful realization that you are very fortunate to be getting any of it.
Very well put Joe. Another knife into the hearts of the middle class.
a taste of what we are facing
http://stump.marypat.org/article/675/when-multiemployer-pensions-fail-teamsters-local-707
what a pension would need to make its expected return rate
old article yet worth the read
http://davidgcrane.org/?page_id=702
portfolio adjustments today.
reasons Valuations or lack of growth ( sales or earnings )
Hal 42 % reduce Valuation poor growth
Amd 75 % reduce valuation
Msft 60 % poor growth
Orcl 50 % poor growth
xlnx closing poor growth
Aes closing poor growth
Cms 33 % exposure to utilities
Peg closing poor growth and exposure to utilities
total reduction 19 %
will bring me to : 50 % cash 50 % stocks
i am way lopsided on tech this is mostly risk reduction not a bearish
thought process.
the time line is this month in a very generic manner.
as peters headline says , We Have Been Here Before .
a little room for higher prices which is why im only reducing risk
yet putting my money where my mouth is and going to continue to
reduce my risk over this year.
traveling tomorrow and then out to sea . its do it today or leave the market
to manage my money ( that doesn’t usually work out so well )
http://imgur.com/Fmo5JR7
luri or purvez
i forget which of you 🙂
you may like this chart
its the same 8 stocks yet keep in mind its not an index
Joe
http://imgur.com/n58wHrD
aahhhh, joe – that “chart” you are showing infringes upon trademark protection. I am gonna have to “lawsuit” you into bankruptcy!! And seeing that satan himself – david rockerfeller, is no longer – someone – like me for instance – is gonna have to take his place!
BE WARNED…. :-)))
https://invst.ly/3i74w
Looks like at a minimum that W(4) is here as I thought..
I think this is the roll over but we have a long way to 2193.81 under that level will confirm the BOOM!!
jody,
BOOM!……. we will be below that level by the end of week…… BE WARNED!!! hahaa… you gotta love that “BE WARNED” stuff…… flashbacks of the “TERMINATOR” comes to mind when i use it…..
Then that would be, “BEE VORNED!”
tsssk….tssssssssk…..peter, peter, peter – that is only funny UNTIL SOMEONE GETS THEIR “EYE” POKED OUT!!!….BE VORNED!!
omg, talking about bees…did you see the latest propaganda by the maker of honey nut cheerios….they want to “SAVE” the bees by …..[please sit first]….by planting 100 million wildflowers…..
ahhh……honey nut people, try using NON GMO grains in your cereal, you know, grains that have no connection to glyphosates…… which is the real killer of our pollinating friends….!!! WHAT A LIBERTY!!!
Vat’s that??!!! 🙂
The neckline on that H&S pattern we have been watching since last week broke today as well..
target around 2300ish…. elevator down [cough….liz….cough]…
https://invst.ly/3i93v
Luri,
Yesterday afternoon I posted at another site and said the market would most likely to try to push it up at open but fade all day to print a bearish engulfing pattern. I didn’t post it here because I could see your lips licking in delight. Lol. Anyway, remember my hypo posted here https://worldcyclesinstitute.com/the-federal-reserve-and-the-great-depression/ ? I said May 21 may be the best pivot low for some window dressing towards end of month. But now I’m not so sure. I have to see what happens on the 23rd. And the fractal I’m looking at will cause Luri to spin in delight. But in between is 22nd which to Andre is some sort of high.
Yes that is the measured move..
liz,
for the public record, the saliva is slightly acidic, so when you “lick” your lips, and it drys, the acid has an overall “drying” effect on the skin…..winter licking people…winter licking…….
Chapping, and constant lip discomfort is parri passu to the lick.
My lips are lush and full and moist beyond belief..hehee….. and yes, i do remember your post…… liz, you are so much better at timing this market than i, so i walk everyday in your shadow,,,,albeit, with plump lips…. :-))
Robert McHugh – February 26, 2017
http://www.safehaven.com/article/43785/major-stock-trend-turn-coming-in-march
“There is another turn coming to stock markets sometime around mid- March 2017, and the following analysis suggests sometime between March 9th and March 23rd, a 7-trading day period, is approximately when it will begin…At this point it feels like this coming turn could be a top. This turn is coming coincident with a Phi Mate turn date, March 20th, 2017, so our confidence is strong as these are separate sciences identifying the same cycle turn possibility.”
Andre’
Was that the “W3 or W5” move you were looking for or a precursor? I think I know the answer, but want to confirm. Thanks!
I see a strong cluster of cycles that turn this weekend. So I think there will be a leg up into the weekend. Friday may be a panic day but Monday likely a low wit the final push into the end of the month. Then the real game will start.
But the longer term is already down as I have said before. And it will be down for years. So higher highs are unlikely.
Luri
the late george lindsay may put a dent in your lawsuit 🙂
i still think this is a pullback with a further rise yet
my semiconductor stocks as a group were up 100 % from the
lows in 2016 and follow the sox very closely , my entire tech sector
balance was way out and out of 47 stocks 11 of them represented
47 % and so this morning i dug through all of them and cleared out
what i felt was most vulnerable . im glad i did .
for now im leaving things as is and will see how this market acts
from march 30 into april 21 ( i still think of it as a low to high time frame)
the dow near 20600 would be ideal yet im not going to let things swing
like i have over the past several years .
in regards to that pattern , those stocks as a group not reach new all time highs
is a key to the pattern. Lindsay stated that a bear mkt rally following that pattern
you look for a failure to make new highs.
today’s drop looks like its broad based and as we get closer to the top we should
see individual stocks falter even though the index’s make new high’s .
the Dow needs to close below 20727 to signal a further drop .
i spent the last few hours re inputting everything into my quote window
i organize stocks into sector groups and have each sector add the stocks as a group so i can follow each sector . today was a clear it all out and re input .
now i m finished.
going to look at some old lumber that is sitting in a warehouse and check out
a 16 inch saw with a 3 hp 220 volt motor today . its 100 yr old 2 x6 tongue and grooved end grain doug fur, ill use the saw to cut it in half making it 3/4 inch thinkness, that will give me 1200 linear feet, guy told me i could have it for 150 bucks , the saw i found for 400, a bit of work yet i have the shop and the rest of the tools to make it work . 1200 ft of t and g end grain is a fair amount of wood
and once finished worth about 6000 bucks , im going to use it though so not about a profit its about my floor in my last room .
good luck everyone
ill be gone for about 3 weeks .
i have piece of mind knowing i lightened up today .
🙂
joe,
the collapse is upon us……. BEANS – BULLETS – AND…? [beans, bullets, and..] ok, i forgot what the 3rd prepping necessity was….. mani/pedi?….beans, bullets and mani/pedi.
run for the hills….no times for wood on floors….its all in the numbers!! :-))
BE WARNED!….. have fun with yer wood!
..and one last update ….the RUT has give the clearest patterns so far, and they continue to play out…
short term update….https://invst.ly/3i97y
medium term…. https://invst.ly/3i99d
the 5th wave ‘WILL” truncate…… BE WARNED!!!!
I am actually now starting to see a few analysts who are allowing for the possibility that we could had a major top in place. Consider that tightening cycle that is beginning, the incredible multi-decade level of optimism we have seen on this last run-away leg higher, it is hard to see how things can become any more extreme. Despite the market putting in a high back on March 1, the inverse VIX ETF SVXY, put in a new 52 week high on Tuesday at the top of what was clearly a second wave correction. The mania is this market, all things considered,. can only be properly described as insanity running amuck.
Andre’,
Thanks for you input! You say the big turn has happened…but could you help me understand your post and reply to Bret above?
You write perhaps an up into the weekend…and a “panic” on Friday. Are you saying perhaps panic buying?
Luri’s charts posted above seem to layout what you might be expecting. Would you agree with that? Thanks for your input…It seems to be doing what you have been laying out!
Ed,
Sunspots are important for analysis. Some researches say the rate of change in sunspots affects people.
The rate of change in a multi year tabel was highest december 2016. 90 metonic years from 1929 gave 12/28/16. So the sunspots confirmed the 90 degree analysis. 3 lunar months further brings 3/27. This is a 90 degreee overthrow.
Bayer said 80 years is a solar cycle and mercury 80 years ago gives a change in trend. 3/24 we have mercury -80 at aries. So this is a new Mercury cycle. This cycle is down ito 3/15/18. Erik Hadik sees a bearich cycle march 17 – march 18. This confirms the Mercury cycle.
3/24 is 17 years from the 2000 high. This explains why the market hasn’t tanked yet. After this weekend the longer term will resume.
1942 gave the high 2/1. This is another major cycle. The time price vector on 42-66 gave 3/21. This was the reason for thee decline. 80 year ago 3/22 was a low. My tides gave a high but we also have a low tide inversion; this inversion confirms the low. As long as as there is some upforce inversion are possible. But next week the upforce is a lot weaker. 144 td timing on 1942 gives 3/31. It is possible the market stays elevated to show nice results for Q1. But this is really the end of it. Mastertiming on the 10/15/14 low gives 3/29. This is also a time price vector but now on 29-42. 3/28 is an upagrahas.
I expect some more consolidation early next week with Wednesday and Friday the strongest dates.
Garret timing on 1982 torque dates gives a cycle down 3/22 – 5/16.
Already said the week HC mercury is in gemini. This give a high in the market. Today we enter the death zone that runs in 3/28.
3/23 Mercury at perihelion and 3/25 venus/earth conjunct. This creates some pull on the sun and are bullish. This is the interplanetary magnetic field. But after this weekend this is also gone.
I do believe we will see a major change in trend within days now. But it may come next week. Hope Tom can provide a longer term energymap this weekend to show what april will do. From what I see April will be very bearish.
Combined this shows the week is heavy.
Luri please look at ES one hour chart 9/9/16 and 9/10. Are we going to mimic the same price action?
9/12 not 9/10.
liz,
patterns are indeed very similar. there was big buying coming into market next day after sell off in 9/12. today – not so much.
my call based on 3pdh pattern, in which we are in a bull trap zone – which is why we are failing to see buyers overcoming sellers. We are post US election, and have yet to have ANY real sell off – thus the 3pdh pattern bull trap is where i am leaning.
https://invst.ly/3ijxg
the interesting thing, i laid the technicals over each other, and the technical similarities are scary.
liz,
also, the rut chart i keep updating has proven very useful. i would be tempted to go long once prices hit the bottom trendline some 20 RUT points lower, for a quick bounce. Here is where i need to “duck”, as others might be tempted to through popcorn in my direction – but i am convinced we truncate in 5.
https://invst.ly/3ik44
With gold and JPY up it seems SnP wants only reintegrate the bolls.
It was out at the open
dimitri,
every real “bull” move to the upside has had the RUT leading the way. the small caps always leads , and usually turns first before the dow and s&p. so the day was mixed with the RUT and the DOW red most of the day, and spx and ndx green.
usually means consolidation at the lows of the range to reset short term technicals. Consolidation at the lows of the range is a continuation pattern in the direction of prices – which for the time being is down.
ХОРОЩО?
Looks like I maybe wrong about a correction of 5% in the markets. LOL Gartman says US stocks set for 5% correction or perhaps something far worse http://cnb.cx/2n5Y22d Time to BTFD
Peter,
Do you now think its start of wave IV or you still think we reach ATH before going down. I know you said if we break 2364 we are going down.
Bill
Well, yeah, I said we were going down, but we still haven’t topped yet. So we need to finish this fifth wave of the third—that hasn’t changed.
Repeat of my post from march 1st on this site.
we should find out soon enough how this works out.
yesterday i lightened up . yet this next cycle is still
what is termed a venus bull market and it can go nuts
so good luck everyone im out of here for a few weeks
welcome to crazy ?
No comments as to the wave count .
Just details on this next cycle to kick in .
The term is a Venus bull market .
This link gives the dates .
Some times though when then cycle begins
You will see an initial drop folllowing mercury
Conjunct the sun. Other than that it is bullish.
Also when Venus and mercury are retrograde together
You will see a market or sector ( can be gold, commodities
Or the dollar or stocks ) some sector will go nuts
To the upside . If you notice , Venus is about to go retrograde
Also you will find that towards the end of Venus retrograde
Period , mercury will turn retrograde , and this will be happening
In a Venus bull cycle .
Point being : be careful .
That said , the oex is entering the target area I had for June
Yet it is only March . Much more upside is available yet my price target
As I see it is being satisfied right now.
None of this rally is based on fundementals , it is based on lunacy
That said it will rise higher despite any drop that comes .
The real question is when is the ultimate top ?
The pecking order
Big money = Dow
Hedge funds /institutions = spx
Little guy= nasdaq .
Follow the leaders , both the sectors as well as the individual stocks .
It’s looking a bit cloudy , it’s chilly , there is a storm coming
Yet it’s still a ways out
See you all in a month
https://www.google.com/amp/s/astrobutterfly.com/2017/02/27/astrology-of-march-2017-happy-new-astrological-year/amp/
Thanks Joe. Waiting here shortly to finally get fully invested by dollar cost averaging in. Safe sailing !
Luri, Joe thank you! ES could also be playing out 10/11 to 10/13 price action which makes tomorrow, 3/23, the swing low. I bought a few spy calls for next week just in case Joe’s Venus-Mercury dance will indeed go nuts to the upside on the 27th.
Oh … yummy!
http://www.zerohedge.com/news/2017-03-22/nunes-trump-transition-members-and-possibly-trump-himself-were-under-surveillance-du
Very short article (with a more important chart) on the 6 month cycle.
http://www.zerohedge.com/news/2017-03-22/sps-six-month-cycle-top-strikes-right-cue
If we look at the S&P high in Oct 2007 and connect to the high(s) in 2015
Then the March 2009 low touching as many candle bottoms as possible
The rising wedge is pretty clear
In Jan and Feb 2016 the (Under Shoot) predicted the over shoot of the upper trend line.
When we look at how far the under shoot dropped out we come up with 137 points
When we look at where the over shoot started 2263 and add 137 we hit 2400.
I believe the top is in. I will have further confidence if S&P drops below 2270 and @ 2160 will have confirmation.
Just in my opinion..
That rising wedge appears in a remarkable number of charts. Very strange that more people are not seeing it for it is, as you pointed out, abundantly clear. More importantly, in many of them the top boundary line has been decisively broken.
It could be that the persistent bullish sentiment is the ultimate contrarian indicator, recent price action notwithstanding….
Liz
Your welcome
I’m going to clarify a couple things just so you understand this cycle .
The Venus bull cycle runs from inferior conjunction with the sun to superior conjunction
With the sun , it is when Venus is considered a morning star .
When Venus has its superior conjunction with the sun you sell and Venus being an evening
Star is consisted the Venus bear cycle .
The trigger though is mercury , when both mercury and Venus are morning stars
You both a mercury bull phase with in a Venus bull phase .
Mercury is a shorter term cycle .
That said if you read what I said above I’ll get to the nitty gritty .
When both Venus and mercury are retrograde together there will be a sector
That goes nuts to the upside .
So to clarify this , we are begining a Venus bull cycle which should last about 10 months
That doesn’t change .
Venus is presently retrograde , March 4th to April 15…
Mercury will be retrograde April 9 to may 3rd .
This places the going nuts portian from April 9th to April 15th .
A very short window yet a powerful one to be aware of .
Mercury retro grade alone let’s consider the last one .
I tend to give the market a 10 day lag with mercury retrogrades ( just explaining
This as a reference)
The previous mercury retrograde was Jan 1st to Jan 9th . We saw a low
Jan 19th ??? I can’t recall , yet I had been calling for a Jan 20th low because of the mars
Uranus cycle yet mercury dove tailed into it .
Lastly and no detail here , I don’t have time or I’d go into it .
If we do see a nuts period upside in that window ? April 9 to April 15th ?
And if we include the 10 day lag of mercury retro ,
Instead of April 9 to may 3rd
We use April 19th to may 13th ? And we include the Maris Uranus cycle dates which
I don’t have time to explain ?
Mars Uranus calls for a low March 30 and a swing swing high April 21.
The next cycle low from mars Uranus is may 2 nd and then may 18 .
I have mentioned the may 18-19th a few times saying it should be an important low .
Which then points to a high on June 30 .
I have probably not explained this all as well as I should have yet I thought I’d clarify it
So you understood why is all .
Back to mercury retrograde and mars Uranus .
Mars Uranus cycle high of April 21 , end of quarter plus 20 days April 20
Mercury retro Venus nuts period April 9th to the 15th
Mercury retro with 10 lag being April 19 to may 13.
Mars Uranus cycle low may 18-19rh
Then it’s Chris carolans work , from his spiral calander.
I’ve covered more then I intended yet you can do some research and see what you discover
The mars Uranus cycle I just dont have time to explain yet you look for a top
In the market when mars and Uranus are in opositiin to each other .
Combombining both the mars Uranus cycle and the Venus bull and bear cycles are
Extremely helpful .
Lastly koval words , when the market rises in a Venus bear cycle, when the Venus
Bull cycle comes you ain’t seen nothing yet .
This combination is bullish and can be exyremly bullish
Yet the nuts portian I referred to is only a small window .
Good luck
Joe
To finish this off
April 20 should be a high of sorts and may 13th – 19th a low
A bearish period being April 20-th to may 19 as a guideline
March 30 to April 20-21 as a bullish phase
And some sector wild bullish in the retro phase which I posted the dates .
Sorry mind overload 🙂
I’ll be out in the ocean and no phone or net and won’t be home til probably April
12 so can’t update as this takes place in real time
That’s all I can offer but hopefully you grasp it .
🙂
Joe,
Thank you for the explanation. I appreciate it very much. ?
do yourself a favor, invest the approximately 1:10 to watch this video…timely, interesting, and potentially important insight…
Kimble Charting Solutions Premium Member Webinar – March 7, 2017
http://tinyurl.com/n7evxlf
Thanks , very helpful ……..Nick
“S&P hits 161% Fibonacci extension level and stops on a dime. Short term, it is now breaking below bearish rising wedge support.”
https://twitter.com/KimbleCharting/status/844916548888399877
“Fund flows of this size could mark a top, says Joe Friday”
https://www.kimblechartingsolutions.com/2017/03/fund-flows-size-mark-top-says-joe-friday/
Liz
Your welcome
Rotrot only watched a few minutes of it but looks to be a great video
Up early for me
Night night 🙂
Joe, see past 8 Mercury retrograde windows. One of my favorite aspects to watch. At a minimum the first half of Mercury retrograde could be weak? http://imgur.com/Q9Mx7fZ
Think about this one, when the #SPX makes a new high at some point in March, the full month of March has been red only once the past 50 yrs.
We are retesting the neckline of the H&S pattern from the bottom.
This is very common and we should fail here @ SPX 2359ish
if we drop below 2346 again we should see the selling accelerate..
Jody…Great call!!
Sold my calls! Time to go shopping.
Andre’,
Last week you posted that…”3/24 is a dark day (Carolan)…that should be a high”.
Is “dark day” synonymous with a down day? Yet you say 3/24 is a high!
Any thoughts?
In Carolan’s work a dark day is a high. Just read his work and you’ll see.
André
Thanks Andre’! I learn something new everyday. I think you posted that Olga Morales saw a “dark day” back weeks ago…and I totally misinterpreted that post!
This weekend you will learn some more. I never wrote about Olga’s dark days.
Energy stream update for the week
how did we do compared to the Dow?
Note: there is a 1/4 day forward time shift from my original chart posting
nailing the exact start time is very difficult but I do my best to find it
https://s27.postimg.org/xcjaoaodf/March_20_to_24_Energy_stream_backtest.gif
Tom,
Will you be able to show next week(s) this weekend? Really appreciate your contribution.
Long term energy stream
with same time shift applied as this week
no guarantee it plays out that way over the long run
https://s2.postimg.org/6u15g9bwp/March_25_to_April_18_Energy_stream.gif
Awesome Tom,
I like it verry much.
Thanks.
Tom, I like that very much. I think we see bottom today or Monday into a corrective rally into 4/6, then down from there. Thinking something like up to 2380, then down to 2280-90. Like this: http://imgur.com/a/uzpD1
Mastertiming om dec 28 gives 3/27 and 4/6. This about the period Tom’s chart shows. No clue how it is created, but I recognize the dates so it is a strong confirmation as it is unlike anything else I know.
Tom amazing! Thank you for sharing. Steep declines on March 31, April 2, 4. Wow look at the 27th and the 12th but Joe’s bullish nuts period is April 9th-15th. Maybe there will be a flash crash on the 12th and a huge bounce since that’s Holy Wednesday? Usually Holy Thursday is the strongest day during the Holy Week. However, last year, I think Holy Wed was the strongest.
Tom,
Interesting work you have done. Obviously you are onto something. Question about the weekends/holidays, the fact that the energy is there but the market is not. Do you have any insight on whether the energy ‘accumulates and builds’ into the market, or does the market act like it is not even aware and only processes the energy when the market is open (e.g. Sunday evening). I hope that I have articulated my question in a way that makes sense, and thanks in advance for your thoughts,
Steve
The energy stream is not the stock market but the energy; the chart documents, emotionally affects the people who trade the market and thus the markets are a reflection of the energy stream. I hope that helps.
Tom,
Thanks for the insight. Yes, I took the ‘Energy Stream’ to reflect the emotional energy (based on light, quantum electro dynamics,…or other) which effects all individuals. However, what I am curious about is if you have seen any tendency as to how this emotional energy steam manifests itself (if at all), when the market reopens, over the weekend when the market is closed. This is difficult for me articulate, so let me take a shot at it using light (which I believe QED establishes emotions). I am in a room on Friday, and the light is on, I leave for the weekend during which time someone turns the light off, and then before I return to my room on Monday somebody turns the light back on. As far as I am concerned the light has been on all weekend and there is no change at all. Alternatively, if I am aware that someone has been turning the light on and off over the weekend I will have a different view of emotional reality. Clearly my analogy is not perfect but, in the same way, when the markets open on Monday, do the markets incorporate the changes in the ‘energy streams’ that occurred when the markets were closed (the lights being turned on and off over the weekend), or does the market remember where it was on Friday and adjusts for the energy in force on Sunday night (Monday) without any care for the energy that transpired from Friday through Sunday evening. Of course ‘beats me’ is also viable answer. Hope the preceding is clearer than mud,
Steve
if there is a weekend residual affect I am not aware. I’ve seen streams fall all weekend and turn up sharply on a Monday open with no over hang on the markets. Each new day stands on it’s own merit IMHO. What I have seen is the media or the FED play up a market when the streams were about to fall hard. This man made manipulation is a sad attempt by banking crooks to counter the affects of the streams on traders. I’ve seen this trick played out many times over. The banking crooks have access to this same data and they will crush the VIX just prior to the market falling or they will allow the VIX to climb into a close only to crush it in the morning like they did today.
Cool stuff Tom. What is the energy stream chart based on?
hmmm, it looks via the charts that the Trump vote fails?? we shall find out. jody, a new head and shoulders potential. target 2270ish
https://invst.ly/3j0ia
https://invst.ly/3j0ji
Good catch..
So below 2335 i would have to believe that 5 wave up to finish-out W(3) theory would be dead. Maybe Peter could enlighten us..
I am not on my quad-screens today just on the laptop and I totally missed that Luri.
Thanks for the share!
There is a potential reverse H&S on the SPX above 2356 will see more buying come in.. Keep an eye on that if your short right now..
Jody,
That’s essentially it. Count could to either way right now. We’re in a fourth wave. My issue is still with the count at the very top—the final wave up, I still count as a “3.” So either it is or it isn’t. If we go down, we’re in larger wave 4 and it isn’t. If we go up to a new high, it is. However, the corrective wave up from 2332 in ES says we have to at least bottom here.
I agree..
The reason I am thinking lower is because the H&S broke to the downside then tested the neckline and failed.
However SPX above 2356 we can throw that out the window and we will get that wave up your looking for.
Thanks for the update.
SPX has to get above 2356.54 to see the up move continue.
I am looking for failure here @ 2354 and the sell off to resume.
In my opinion..
Today was a dark day and the market made a high. Light days (my concept) are the opposite and give lows. Will give you the next light day this weekend. Darks days give highs, hope this is clear now. The 1440 delta gave a high Thursday as did Kronos in station direct. According to Tim Bost this should give highs.
With a high thursday an Friday we needed a low in between. 19 yoga years gave a high Thursday and a low Friday. So we saw a low and a high.
I have some strong timers in the weekend so that should do something. Monday is a very strong day and delta says it should be a high. 25 we have venus conjunct earth, a spiral date on SPX and some other stuff. This we have a low in the weekend and then a high on Monday. As Wednesday is also very strong we need a low Monday/Tuesday. From 29 down into 3/31. If this is a lower low I can’t say as I expect early april to give a more significant turn down. Tom chart also suugests energy is positive into early april. But today we had a turn in some long term cycles so I expect next week to show more volatility. Will explain all this weekend.
Andre’,
I agree Monday should be up. Am guessing Venus effect has already occurred and next three months will be on upward track (probably slow grind up until June).
Just broke through another support..
SPX 2335 is the line in the sand.. If that does not hold watch out!
Interesting how we bounce hard off 2335.
It could act as a double bottom.
However as stated earlier – if we break that 2335 level on the Bigger H&S Luri pointed out the measured move will be down 2274.
If we drop back into the rising wedge @ appox SPX 2265 it will be a failed break-out and I will be certain at that point the turn is finally here.
Watching next week to see if we are red again -At the end of the week I will look at the monthly candle as a “Dark Cloud Cover” if we are in fact red. I would like to see 2285 or lower for that set up.
On the flip side If we get above 2350.37 then I will discard my bearish outlook.
The fact remains though we broke the neckline, tested and failed on the smaller H&S I pointed out last week. The measured move is SPX 2313. We have not reached that objective so I can not be bullish until the down trend sloping line is breached to the upside @ 2350.37
Looking at the Weekly RSI, MacD and Stochastic gives a very bearish outlook so to assume we are going to go up is a long stretch but anything is possible i guess.
Have a great weekend.
About delta timing. We all know the classic delta system with 4 days. 116,354 and 19 years. A little addition by me is Gann delta. This uses 90. 180, 270 and 360 lunations, assuming a lunation is 1 degree.
Keep in mind 90 lunations is about 7,5 years.
90 degrees gives 3/26
180 degrees gives 3/26
270 degrees gives 3/26
360 degrees gives 3/27.
The 666 lunation cycle (=54 years/Kondratieff) gives 3/26 and 4/2, The 333 gives 27/29/30, The 111 gives 25/29/31,
The 19 year cycle gives a high 27 with 2 and 4 times 19. The 3 times 19 gives a high 3/24 and a low 4/1
3 different delta systems all give a high 24/27 and a low 3/31-4/1.
HC merc is still in gemini and we are still in the deathzone. 24 was 17 years after 3/24/2000 and Trump failed to replace Obamacare. He should have know not to discus this matter om 3/24.
3/26 is also a very strong date. So this weekend could be a trigger.
The square of 9 on 1942 gives 4/25 and that gives 2350 on SPX. That is the level SPX was testing yesterday. Could be a goodbye kiss. Mercury conjunct Uranus should spark some volatility. April 5-6 -ish will be tested but I doubt is will be a higher high. The market really looks very weak now.
29 likely capitulation with a drop into 31. I have one cycle that gives a low by the end of june before we make a serious pullback into the fatal august/september time frame.
22 was a very strong date in other systems. The equinox was 20 so the midpoint 21 was chosen. We will be down at least into late april but may and june don’t look so good either.
Perigee is moving closer to earth into may, increasing the tidal pull. This is bearish. Mercury was at perihelion 3/23 and venus conjunct earth 3/25. This gave a short term bullish IMF force. But after this weekend this is also gone.
So next week some more volatility with Wednesday likely some panick added to the mix.
Will do some more research this weekend. Will share when I find something.
Andre’,
My research suggests that the three months following Venus conjunction are usually bullish based upon last 15 events.
Valley,
A long term trend was up into the end of 2016. So bullish effects of venus are very likely. But I think the long term trend is down now, so we’ll have to see what Venus does now. 3 months down would confirm my expectation. We’ll see. Will be a learning experience either way.
Great work, Andre’. Very original and clever. Thanks!
http://www.zerohedge.com/news/2017-03-24/canada-passes-blasphemy-bill-silence-critics-islam
Feel really sorry for Peter.
I talked about musical vibrations in the past. But that isn’t really about music; it’s just that music reflects something fundamental as everything in the universe does.
So there are many different ways to try to find the same thing. As there are many roads that lead to Rome. Many roads; one Rome.
Recently Peter said – in my words – that there is something fundamental beneath elliot waves. I know he’s right. It;’s just another road.
Let me give you an example.
16 metonic years, or 200 lunations, give a low 3/27 and a high 4/6.
Mastertiming on 12/28 gives 3/27 and 4/6
The 28 week cycle gives a low 3/27 and a high 4/6
Tom’s energy chart gives a low 3/27 and a high 4/6.
4 different techniques all give the same. But we are all headed for Rome.
Does this mean we are up next week? No, as other cycles are down this week. So 1 up and one down. This makes me suspect Monday Tuesday will be quiet. But then the market senses time is running out and will make a swift test down into Friday, before heading up into 4/6, As 4/2-4-6 are all strong, this suggests abc up, or a retrace in a longer term down trend.
All roads lead to Vancouver, if you are in the Junior Miner space. =)
The delta system uses the sun-moon angle or sun – moon. Yoga is sun + moon; so kind of the inverse ( mathematically a negative moon).
Anyway, when we build a delta system on Yoga we see strange things.
90 yoga cycles (= lunation but then in yoga) Give high 3/21 low 4/1. This is also my fibo cycle,
180 yoga cycles give High 26, low 29, high 4/2, low 4/5. I suspect this is inverted, so low 26, high 29, low 4/2, high 4/5.
270 yoga cycles a high 3/27 and a low 4/3
360 yoga cycles give a high 26, a low 4/1, a high 4/2, a low 4/3 and a high 4/8.
So, with a litlle imagination we see 21, 26/27, 29, 4/1-2 as turndates. This is the same as the Gann delta gives. Indeed; many roads lead to Rome…
Thanks Andre’!!!
The wallstreet cycle.
Dewey mentions 2 dominant cycles (http://www.bibliotecapleyades.net/ciencia/cycles/cycles.htm#Contents) ; the 40,68 month cycle and the 9,2 year. Combining this with Vukcevics formula and using the 2015 high as start date I see a peak 3/29. Then a low 4/11 and a high 4/25. 4/25 is 45 degrees in the sqr9 on 1942. 111 yoga cycle give a low 4/11.
No forecast, just trying to trigger some reponses 😉
Sounds about right for a b wave up starting on Monday, then a sharp c down to conclude the current corrective and probably fourth wave. I went long at the end of the spike down on Friday as these intra-day reversals have been the pattern of late. They keep doing it and trapping folk trying to get short on these final waves down so it must still be working. I would not be surprised to see a spike in futures Sunday evening, despite the failure of the healthcare legislation. I do not intend to hold my long trades past Monday. I will be shorting any moves higher with proceeds from my long position, should the prove profitable on Monday.
Verne, I think something like this. At least a corrective B wave rally into first week Apr?
http://imgur.com/Bk9w87Z
https://www.youtube.com/watch?v=MxK8SpnseMk
A new post is live at https://worldcyclesinstitute.com/the-cycle-turns-on-canadian-banking/
This website is for educational purposes relating to Elliott Wave and natural cycles. I welcome questions or input about Elliott Wave, cycles analysis, or astrological input relating to any market. Due to a heavy schedule, I may not have the time to answer questions that relate to my area of expertise.
I reserve the right to remove any comment that is deemed negative, disparages the Elliott Wave Principle, is otherwise not helpful to blog members, or is off-topic. Posting trade specifics does NOT serve an educational purpose, is stongly discouraged, and such comments may be removed.
Want to comment? You need to be logged in to comment. You can register here.