
The 500 Year Bull Market
If often talk about the 500 year bull market. From my extensive research in economic cycles, the more specific measure is 516 years (3 times the 172 market crash cycles).
If the “orthodox top” of the market was in 2007 (which also coincides with a 172 market top (and the start of the current ongoing “recession,” the 516 year start was in the year 1492, which marks a major turning point in feudalism. You will also recognize the date as the euphoric top of the previous 516 cycle and the discovery of the “New World” (North America).
These cycles turns and periodic lengths are supported through the work of Stephen Puetz and Dr. Raymond H. Wheeler, Ph.D.
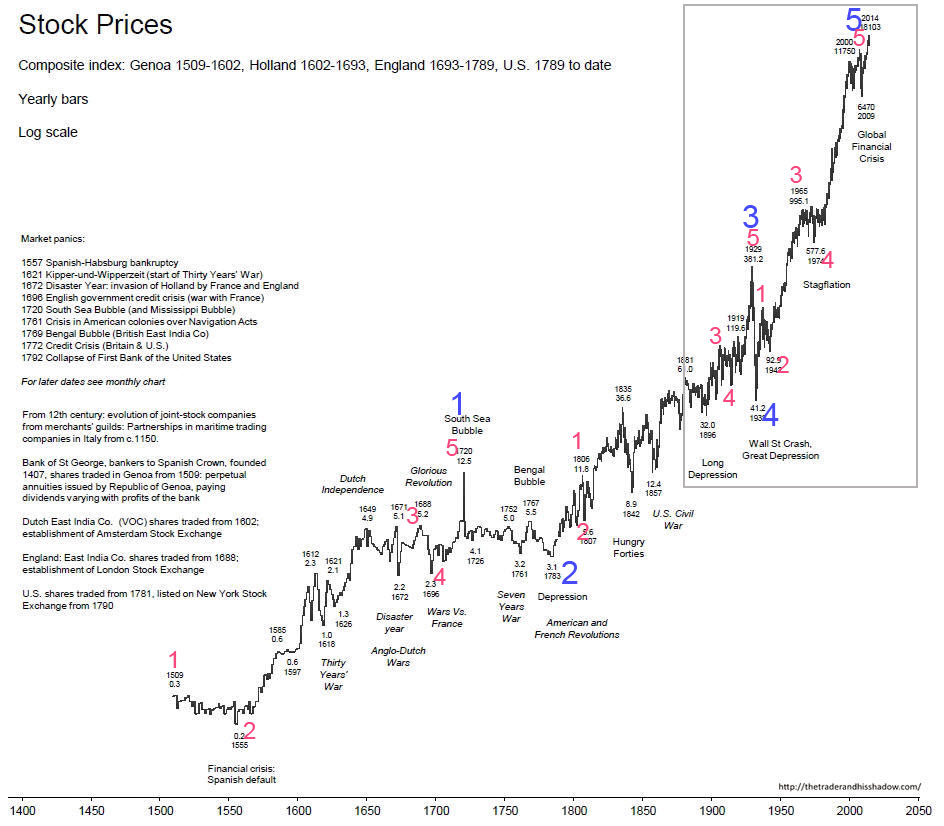 Above is a 500 year compendium of stock prices (click to enlarge) gathered from multiple sources to provide a guide as to the rise in prices from 1509 through 2014. You can find major events identified on the chart, including wars, which generally take place at the lows.
The above chart generally follows the Elliott Wave Principle in structure and places us at the top of a five wave super cycle, with an expected major downturn, crash, and depression to begin during 2018.
The labelling is open to dispute as I don’t have the ability to use the usual fibonacci ratio tool to confirm subwave levels, but the labelling about is simply a wave count based upon the usual Elliott Wave rules and guidelines.
The grey rectangle on the chart relates to the “zoomed in” chart of the DOW below.

Above is a quarterly (3 month bars) log chart of the DOW, stretching from about 1915 through to today’s date, with the Elliott Wave labelling of the final fifth wave up of the 500 year bull market (the price history relating to the grey rectangle in the 500 year chart above).
Near the top of the chart, I show wave (5) (the orthodox top) at the year 2007. The wave down from the top in 2007 was in three waves and ended at a low in early 2009. The final wave up from 2009 is a corrective B wave, and is almost complete (see my daily chart of ES below). I’ve shown this B wave count before and will again over the coming weeks as we near the final top (which I expect in the next couple of months, if not sooner.
Once five waves have been completed, the trend changes. The B wave is an anomaly, what I call an “unnatural wave” brought about by central banks ramping up enormous levels of debt with the result of fueling more inflation and the typical stock market speculation which has led to this extraordinary bubble.
The horizontal line at the 569.89 level identifies the previous fourth wave of one lesser degree. This is the typical target (the area of the previous fourth wave) that the market seeks out after a fifth wave top. Since the expected C wave down does not necessarily reach the target, I conservatively tell folks to expect the DOW to be under 3000 points by about the year 2022.
And there you have my analysis of where we are and, more importantly where we’ve been. History repeats. It’s important to pay attention to it.
_______________________
Elliott Wave Basics
There are two types of Elliott wave patterns:
- Motive (or impulsive waves) which are “trend” waves.
- Corrective waves, which are “counter trend” waves.
Motive waves contain five distinct waves that move the market forward in a trend. Counter trend waves are in 3 waves and simply correct the trend.
All these patterns move at what we call multiple degrees of trend (in other words, the market is fractal, meaning there are smaller series of waves that move in the same patterns within the larger patterns). The keys to analyzing Elliott waves is being able to recognize the patterns and the “degree” of trend (or countertrend) that you’re working within.
Impulsive (motive) waves move in very distinct and reliable patterns of five waves. Subwaves of motive waves measure out to specific lengths (fibonacci ratios) very accurately. Motive waves are the easiest waves to trade. You find them in a trending market.
Waves 1, 3, and 5 of a motive wave pattern each contain 5 impulsive subwaves. Waves 2 and 4 are countertrend waves and move in 3 waves.
Countertrend waves move in 3 waves and always retrace to their start eventually. Counrtertrend (corrective waves) are typically in patterns — for example, a triangle, flat, or zigzag. Waves within those patterns can be difficult to predict, but the patterns themselves are very predictable.
Fibonacci ratios run all through the market. They determine the lengths of waves and provide entry and exit points. These measurements are really accurate in trending markets, but more difficult to identify in corrective markets (we’ve been in a corrective market in all the asset classes I cover since 2009).
To use Elliott wave analysis accurately, you must be able to recognize the difference between a trend wave (motive) and a countertrend wave (corrective). There’s very much more to proper Elliott wave analysis, but this gives you the basics.
____________________________
Registration for Commenting
Want to comment? You need to be logged in to comment. You can register here.
If you register, it protects your information. It also allows you to comment without filling in your information each time. Once you’re registered, simply go to the home page and click on the login link top right in order to log yourself in. Usually, you’ll be logged in for several days before needing to be logged in again.
______________________________
Problem receiving blog comment emails? Try whitelisting the address. More info.
______________________________
Have not had a losing week RW 2
Have not had a losing week …I have been with Peter almost a year. The only thing that matters is have I made money with his service. I think I have finally turned the corner using Peter’s EW. I have not had a losing week in the last 5 months. Thanks Peter, for your amazing amount of hard work. —RW |
The best of them JL 2
The best of them …Last couple of years, I subscribed to several ‘market traders’. You are by far the best of them and the personal contact is awesome. Daily and daily updates are very well written! Besides your expertise in EW, I also like your cycles analysis. Best investment I ever made! —JL |
Get an upper hand … JC 2
Get an upper hand in trading …Seeing all the different currency pairs and the wave structures and hearing you explain why this has to do that on a nightly bases gives one a upper hand when trading. Elliott Wave applies to all stock and indices and can be applied to any candlestick chart. If someone ask what you want for Christmas – Tell them a membership to Peter’s “Traders Gold!”—JC |
A true expert in Elliott Wave FL 2
A true expert in Elliott Wave …You are a true expert in EW analysis. What you provide is not available anywhere and is priceless. Subscription on your services is the best thing I have ever done. Many thanks for your effort to make me a better investor. I now have more trust in my investment decisions. I hope you will continue the excellent work! —FL |
Tops in your field DZ 2
Tops in your field …You are tops in your field. Tried to follow Elliot Wave international for years. They were always behind the market. After discovering you, I perceive that you are an expert in reading the waves, which puts you way ahead of the rest of your peers. And you can read the Waves like you are reading tomorrow’s financial section. I pray you stay healthy. —DZ |
the real deal SM 2
The real deal …‘Educational, insightful and thorough market analysis for all levels of traders. It’s Elliott Wave at its best….Peter Temple is the real deal’ —SM |
Couldn’t be happier … KK 2
Couldn’t be happier …The analysis and insight you provide is simply amazing! I’ve been trading the futures and equity markets for well over thirty years and usually average around 5% monthly. Since joining your Traders Gold Service two months ago, that number has better than doubled. I couldn’t be happier.—KK |
Rise above the rest … SM 2
Rise above the rest …I have only ever met a few people who, in their chosen fields (astrology, medicine, music, martial arts, technical analysis), rise above all the rest and you are one of them…you have ‘the gift’…and that’s why I’m a Trader’s Gold member. —SM |
The Market This Week
Here's the latest daily chart of ES (emini futures)
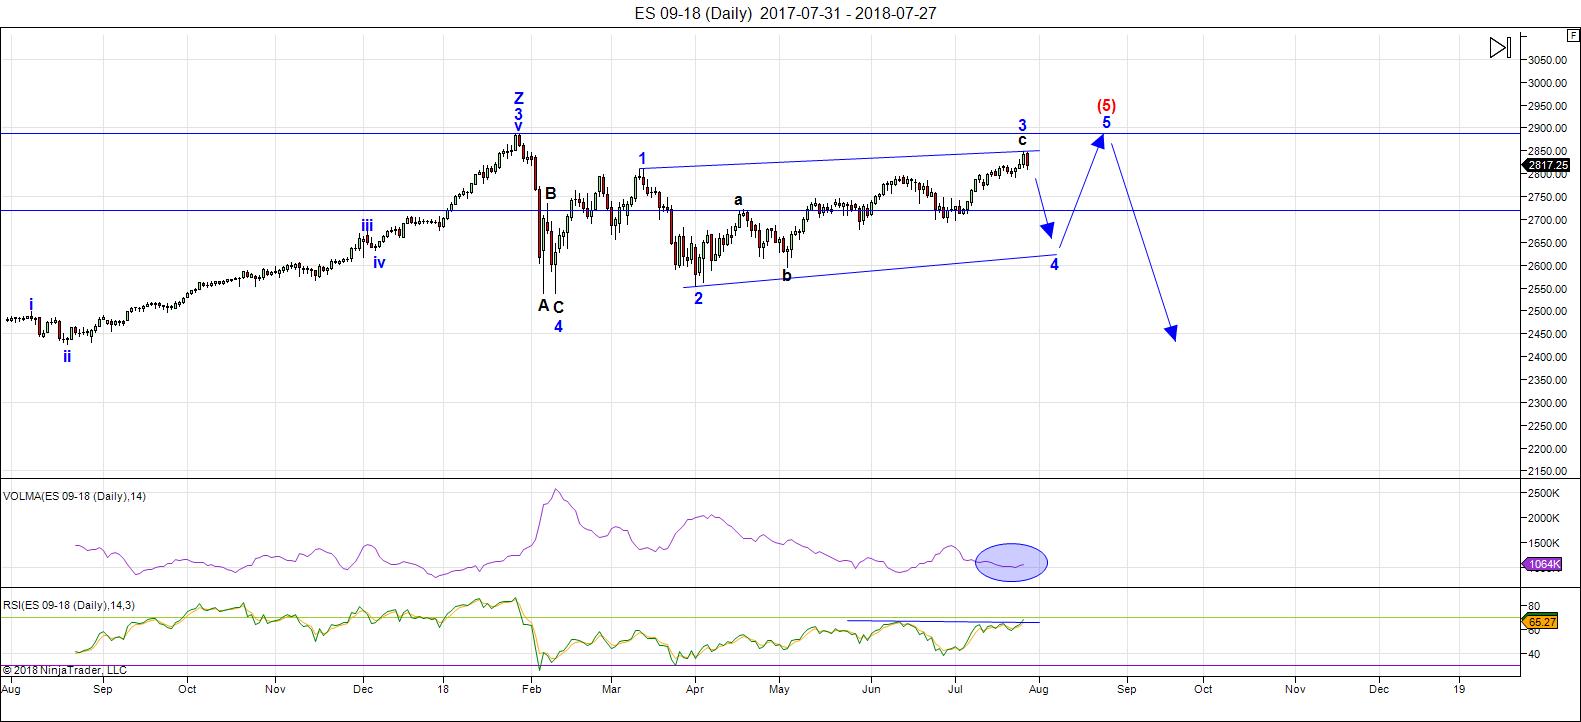
Above is the daily chart of ES (click to enlarge, as with any of my charts).
We're not quite done with this complex third wave of the ending diagonal. As I've mentioned above, it seems to be taking so long due to the fact that many (if not all) asset classes look like they're going to turn at the same time as the US indices. This week, for example, we now have NYSE heading for a new high, which when achieved, will put it into an ending diagonal. Wonders never cease in this market.
On Friday, we dropped down in a larger fourth wave, of this final fifth wave. We had a 1-2, 1-2 set up for start the wave up. That means we have to have a 4-5, 4-5 ending. We're in the fourth wave of that final 4-5 and we have one more wave up to go.
The third wave of the larger ending diagonal, which we've been in now since the beginning of April (17 weeks as of this weekend) is always the most complex and longest wave. Once it's complete, we're about 75% of the way through the ending diagonal. We have one more wave down (a fast one — wave 4) and one more wave up to a final high (these waves can be fast or slow, but they go up in three waves and cannot be longer than the height of the third wave).
In other words, we're getting close to being done with this final pattern. Time is the factor that is not a component of Elliott Wave and so I can't provide a lot of insight into the "when."
The US Dollar is also very close to a top and we may see that happen this week. It's making the overall market (certainly currency pairs) quite volatile. As I've been saying the low volume pays a large part of that volatility.
The coming wave down (the fourth wave of the ending diagonal) will have a target somewhere near 2600-25 (depending on where it finally tops).Then we'll turn up into the fifth and final high ... but a high that will have a definite maximum target (to be determined once the fourth wave is fully in place.
Summary: We're waiting for the final fifth wave of the larger third wave of an ending diagonal to top. Once it ends and turns down, we'll drop into the fourth wave of the ending diagonal in ES. Once the 4th wave (down) is complete, expect a final fifth wave to a new high. That fifth wave up to a new high will be the end of the 500 year bull market.
___________________________
Trader's Gold Subscribers get a comprehensive view of the market, including hourly (and even smaller timeframes, when appropriate) on a daily basis. They also receive updates through the comments area. I provide only the daily timeframe for the free blog, as a "snapshot" of where the market currently trades and the next move on a weekly basis.
______________________________________
Sign up for: The Chart Show
Next Date: Wednesday, August 8 at 5:00 pm EST (US market time)

The Chart Show is a one hour webinar in which Peter Temple provides the Elliott Wave analysis in real time for the US market, gold, silver, oil, major USD currency pairs, and more. You won't find a more accurate or comprehensive market prediction anywhere for this price.
Get caught up on the market from an Elliott Wave perspective. You’ll also get Andy Pancholi cycle turn dates for the SP500 for the balance of the current month. There’ll be a Q&A session during and at the end of the webinar and the possibility (depending on time) of taking requests.
All registrants will receive the video playback of the webinar, so even if you miss it, you’ll be sent the full video replay within about an hour of its conclusion.


The moonwobble period will end Aug 8, so mayby a big drop till Aug 6. (Joe’s date)
and also tide change.
Thanks Peter T for the update. Your time and efforts are greatly appreciated.
You’re welcome, Jeff.
Peter G,
Using PeterT’s ES chart above…If ES market declined to the 2660 level do you think Eliades would get a downside projection? Wouldn’t that be anecdotal evidence that Peter T and Eliades are onto something by looking for a top in this area?
Sorry, I don’t know the answer to that, Ed.
Thanks for the update.
I’m a bit surprised that the 3rd wave is ongoing.
These recent highs ushered in some of the steepest negative divergences I have seen in a very long time and imho point to an interim top of some significance. I assumed Friday’s dive was the start of the penultimate fourth.
Sunday futures should be very interesting! A decisive break of 2800 there means we are heading for at least 2750, I think.
For some of you, especially if you are option traders, this post is going to be quite useful, and perhaps even surprising. If it doesn’t make some lights go on, don’t sweat it.
As I indicated earlier, one thing I wanted to ascertain was whether or not option pricing models considered a lunar effect on market price. Since an event like a full moon is so repeatedly date specific, the usual cocern with option Greek metrics becomes a moot point. Things like theta, (premium decay rate), and rho, interest rate sensitivity) are completely inconsequential.
For the option buyer timing his purchase based on lunar cycles, the only thing that is of real importance is delta, the in- the -money expectation of the contract at expiration. Considering the well established correlation of market moves with lunar cycles, it is nothing short of astonishing that it does not appear that the pricing model prices in this phenomenon!
This does not mean market makers are completely unaware of the phenomenon. I have noticed for quite some time now that market makers will telegraph their expectation of an imminent increase in volatility, and with remarkable prescience, by dramatically widening spreads on VIX options, sometimes well ahead of the actual move. Nontheless, the actual delta of option contracts appear to not be affected. If what I have concluded is correct, it is one of the few trading scenarios, beside credit spreads, that gives the trader a clear and actionable advantage. Happy Trading! 🙂
Thanks for the update.
I’m a bit surprised that the 3rd wave is ongoing.
These recent highs ushered in some of the steepest negative divergences I have seen in a very long time and imho point to an interim top of some significance.
I does not look as if the third wave of the propsed ED has very much room to move higher before exceeding the point distance of wave one. Of even more significance, I think is that death-stroke from FB. I am certain margin calls have been triggered by that 20 plus haircut suffered by the stock. As margin debt recently notched historic highs, they will in all likelihood result in broad selling of more bloated tech stocks. The advance in tech heavy indices have been very narrowly focused in the so-called FAANG cohort and their breakdown has ominous implications for those indices, including SPX. New highs absent their recovery is going to be a very tall order indeed.
I assumed Friday’s dive was the start of the penultimate fourth.
Sunday futures should be very interesting!
Sorry about the double post folk. Something weird happened with my tablet.
Hi Peter,
Thanks for the article! :-)! Now I can explain to friends and colleagues how “the fork is in the handle”. Actually, I am going to refer to this article.
See for this week in detail http://www.prognoseus500.nl/
Thank you sir PETER. I added to my SPY calls position on Friday on the dip. Seems a good move based on your analysis! S&P should make a new all time high soon with this 3rd wave if NYSE does too? Is the target around 2875 or higher then a drop in the 4th? Am I reading that right?
S&P shouldn’t make na all time new high until the top of the fifth wave, which is a ways off, but I think you know that by what you wrote in the last line. I don’t actually have an accurate target for the top of this third wave, as final waves can be shorter or longer at the top and in ending diagonals, fib ratios seldom work.
Yikes! A BTF dipper! 🙂
Well, well, well…I was quite certain those 279.50 puts from my mini study would perish on the vine but they actuallly have a bid!
A nice dive into the close and they could return some nice coin, haha!
What was final tally?
IIRC you made 100% on calls plus how much loss on puts so net was?
Thanks,
C
0.75 profit on calls, 0.25 on puts for a total of just under 1K ( less coms and fees) for ten contracts of straddle.
Nice! I just bought the call side and cashed out with a double. Thanks for the suggestion. Adding to my Sept Calls every day on these dips. Locked and loaded for the top of this third wave then gonna buy some plunge protection puts. Think we hit a new all-time high for SPX in the 3rd wave or do we need to wait for the 5th?
I think the third wave of the smaller ED only has to go higher than the first.
Wave 5 of the higher degree pattern makes a new ATH.
I got 0.25 for those puts. Took the money and ran! 🙂
Looks like we have a 5 down in SPX and Nasdaq but not in DOW. Maybe a bounce in the coming days to around 2830 for a wave (ii) and then lower in August. There is a full moon and Bradley turn date towards the end of Aug. Would love to hear if Astro guys have other things lining up around that time frame.
I still see a possible low on August 6, midpoint Mercurius retograde (Joe), Mercury latitude at zero, a turn in the tides , plus A moonwobble ending near August 8.
That would put us on track for a new moon high on August 11.
If the alternating pattern holds, the next two full moons should be accompanied by market lows.
It looks like we may have the makings of a viable trading methodology here.
Peter T. see what you instigated with your moon influence post? lol!
I have a Steve Puetz video interview coming this weekend.
Where can we find the interview?
Charles,
It will be here in the free blog on the weekend.
Oooh! Goody! 🙂
Haven’t posted in a long while
hope everyone is doing well
here’s the S&P predictive model for Aug. 2nd
let’s see how close she tracks?
https://ibb.co/jTeLAe
today’s result
time shifted 1.5 hrs
https://ibb.co/hNpAfe
Thanks Tom, nice to see you back, do you have a chart for next week?
Third Quarter Moon
The moon is currently in Aries
The moon is 20 days old
I have been posting for months that the time frame
For a high runs between July 27 to Sept 9 .
With mercury now retrograde expect the market to go
All over the place .
The failure to ext end higher into Aug 6 th I view as
Another failure on the bearish set up ( a short term bullish sign )
Yet I continue to have a bearish bias into January 20 2019.
August 6 May end up as a swing low if the typical mercury retro pattern
plays out yet August 11 solar eclipse along with the bearish mars Uranus cycle
Should ideally turn the market down .
6 weeks from the July 13 solar eclipse will become another date to consider yet
The momentum move typically turns on or near the new moon prior to that
Full moon period that is 6 weeks after the solar eclipse .
This will give this up coming Aug 11 solar eclipse some added meaning
as well as the full moon August 26 th .
The next phase would be adding 6 weeks to the August 11 solar eclipse
Which is roughly early October , as a note come Oct 12 th a few bullish cycles
Begin yet come Jan 20 th we enter a technical 2 year bullish cycle as well as
A short term bearish cycle .
So far this year the major index’s have failed to break down in any meaningful way
Despite the bearish cycles . I take this as a larger bullish signal for next year .
The cash Dow has failed to poke above the 25800 level and it does not look like
It’s going to by my Aug 6 date . To me this is a sign that my potential triangle formation
Has or is going to fail ( I’ll give it until Sept 9 ) this failure leaves me considering a more
Bearish potential to below the Feb and may lows going forward .
If it’s not a triangle it’s a flat . Wave A and B can be considered in place and wave C down
Now in its early stages .
Right or wrong I must continue my bearish bias and let the wave count run its course .
I continue to take the view that this entire year of 2018 is a complex wave 4.
No new highs in the cash Dow are expected .
The year 2020 May end up as the final bull market top which is something I have only
Recently began to consider ( it goes against everything most consider )
Right side translations are crashes , left side translations are declines that just grind lower .
All for now
Joe
Joe I think the case for a flat in DJI is problematic. What would be the B wave moved lower than what would have to be the three wave leg down for the A wave, unless I am missing something….
Joe,
Probably a novice or question but could you explain “right side translations” and “left side translations?
Either we started a fifth wave up today or have one huge bull trap in the making…
Verne
Wave A down was either the Feb or may lows . From either Feb or may we began wave B up .
If this is a larger bullish triangle in the cash Dow then a poke above 25800 is a must .
If this is going to be a flat we are either still in wave B to above 25800 ( yet that 25800 is not a must )
And wave C would take the cash Dow to a new low below the Feb and may lows .
Ed
From a cyclical point of view you have an idealized cycle high on or near a specific date .
You also have a cycle low date .
From that cycle high date when looking at a chart you can see a print high either on the left
Side ( the high came early ) or on the right side ( the high came late ) yet the cycle low
Was pretty much on time .
When the print high comes early, many times the market will chop around and slowly grind
Lower . Yet when the print high comes late many times the market just crashes because
It was exhausted . Yet the low pretty much ends up right on time .
If you look around the web or do your own cycle work you will come to the conclusion
That the year 2021-2023 should be a low . There are many ways to figure this but I’ll keep
It simple with 1 example . Look back in history and see for yourself how many times years
Ending in 2 have been important if not major lows .1922 1932 1942 1962 1982 1992 2002 2012 etc…
I left out 1952 as well as 1972 . 8 out of 10 . Next consider how much time most bear markets last .
The steep declines may do a hell of a lot of damage yet how long in duration ?
The 2007 to 2012 real estate decline was 5 years in duration ( roughly )
Yet the bulk of that decline was roughly 2 years . How long was the decline in gold ?
How long was the decline in the US dollar ? Not just print high to print low but also just
The crash portian ? Take a look at a weekly chart of us steel or even Microsoft .
Sept 1929 to July 1932 or April 1930 to July 1932 . ( 2 bear markets or just 1 ? )
From my point of view ( using the late George lindsays methods ) the difference
Between the 2000 – 2002 bear market and the 2007-2009 bear market was 10 days .
They were both almost the exact same duration . Also I will add using his methods
The arguement can be made that we had a 12 year 8 month bear market from the year 2000
To Nov 2012 . Using those methods the cycle high in the Dow would have been in the year
1919 plus 12 years 8 months targeting the July 1932 bottom . 1937 high targeted the 1949
Low.. .July – Oct 2007 high plus 12 years 8 months a 2020 low . Hence many many methods
Target a low running from actually 2020-2023 yet even with 80 % odds nothing is ever a sure thing .
Years ending in 9 have high odds of being bullish years ( I don’t have the statistics )
Yet the year 1929 despite its bullish run into September was a down year !
A high in late 2019 ( my cycles are bullish for 2019 ) would make the case for a 2021 low !
I do not in any way disagree with Peter temple about the significance of this market top .
Where we may not agree on is when the top will be in place .
Peter temple has done an excellent job navigating this market using Elliott wave theory
He has stood by his ( Elliott’s rules ! )
He has also posted publicly when he thinks the bottom will come ( I don’t recall the exact year or date )
Yet I’m pretty sure we are both in agreement .
The end result will be a crash of epic proportions.
we ( my view ) are less than 3 years away from a major stock market bottom and while
It does make sense to be cautious the question to be asked is how high can prices go
Before they crash ?
Take a look at the nasdaq 100 for the year 1999 .
Yes it did crash but 1999 produced many 100 million dollar profits for several average individuals.
Never ever say the market cannot go higher when the trend is up
Never ever say the market cannot go lower when the trend is down.
The market is akways right and it’s up to us to stay on track .
This year despite my bearish bias I held onto what I felt was a comfortable amount
Of risk ( stocks ) I hedged myself and I’m still hedged . I’m sitting on a larger than normal
Amount of cash , I have also put away 1 years worth of after tax income and I have zero
Debt with the exception of 76,000 mortgage debt . I’m not concerned nor am I seeing
Any meaningful decline in the stocks I own as a whole.
When I look around where I live I see business improving , I have noticed this the past
2-3 years now .
This next year though ( 2019) I will have to decide what to unload and where to put
The cash I accumulate as we enter the year 2020.
Bottom line : I remain bearish this year yet bullish in a broader sense into late 2019 early 2020.
The wave count should be obvious by then and who knows what the political envirenment
Will look like at that point ?
I got long winded so sorry if it became a rant .
Thank you Peter t : )
Added thoughts
Look at the posted chart above and take note of the dates noted
For highs and lows . From the high dates add 12 to 14 years since
There not exact dates and see how many times it lined up lows .
It’s not an exact science but it’s worth a look since there is some
Long term data to look at .
Back to the daily grind for me
Joe
Peter T,
Do we have more UP to go …I thought we had finalized 3rd wave…do you this this goes to 2850 before turn down for wave 4 and go to 2625 area
I’ve given up trying to trade this market for now. If it gets to 2625 I’ll be happy to go long but nothing tells me to short at the moment. The bulls are in control and I’m not making money at the moment so I can’t afford to renew the traders gold subscription until thins start going right. Glad there is still a free members area until things start doing what they are meant to!
Hi Q-26
I do not want to persuade you to act. But if you follow this website http://www.prognoseus500.nl/
you see that the pivot points often come true. I only trade on the big pivot points and stay in the market for no more than 1-2 days. Often you see that on the graph (black dotted line) Take the profit after each pivot point of meaning that is my principle in a bull market.
OK be carefull with your trading and keep to youre principals
Willem
Monday I expect a high of 2847( or max 2858) the whole day they want to go higher but that does not really work and after closing a decline starts into Friday. But I sell my position at the end of the first decline (Tuesday ad midnight US-time) Then I prepare for the start of the rally from Friday early in the morning into next week. follow the website if you want actual info.
The bulls have clearly won the battle around the 2800 pivot so what we had there was price consolidation against a move higher. At only around 34 points away, a new high in SPX seems to me a foregone conclusion and that will fully and finally invalidate a third of an ED count. I could be mistaken but by my measurement that pattern has already been invalidated by the height of the third wave. I have never seen the bears win a protracted pivot battle. It always turns outmto be consolidation. When the pivots are not cleanly and decisively taken out on the very first impulse down, as was the case recently, that is almost always a sign the move down is corrective with higher highs yet to come. If I am correct, we will have confirmation of a larger move down underway when the first wave down cleanly takes out 2800, and the level becomes resistance. Above it my bias is bullish and that is how I Im trading it via bull put spreads.
Aug 6- Aug 11 is next week 🙂
Mercury retrograde July 26 th to Aug 19 th .
Adding 10 days to start and finish dates
Becomes Aug 6 to Aug 29 .
Aug 29 is approximately 6 weeks following the
Solar eclipse which was on July 13 .
Aug 26 th is the full moon . 3 days before
To 6 days after that Aug 26 full moon is Aug 23-Sept 1 st .
My previous posts I have said from July 27 to Sept 9
Is the time period for me to look for a top of importance .
That said I’ll admit it’s going to get tricky .
The reason I say tricky is this .
When mercury is retrograde and a high forms at its mid point
( Aug 6 th ) many times I have seen what I call a ” mini crash ” which
Bottoms 10 days after mercury has ended its retro grade period .
That now implies a mini crash can come begining next week and
running into August 29 th .
There is more to this though , the mars Uranus cycle turns down August 6 th
And accelerates lower from Aug 31 into Oct 12 th ( sub cycle ) yet also does not call for a low until
Jan 20 th .
If there was a perfect time for the market to head down that time would be after this next week.
Aug 6 to Aug 11 fits the mold for a high , I’ll still stand by my July 27 to Sept 9 time frame though .
I’ll give the Dow this next week to poke above 25,800 and I’ll give some thought to the upcoming option expiry
Yet based on timing alone I must increase my hedged next week and I must seriously consider having out right
Short positions as well . The focal point will be October as well as Jan 2019 for any put options and September for
Any futures contracts .
The perfect trade yet most risky would be slight out of the money put options basis August expiry .
Next week is going to be a very important week yet the following week is where the rubber meets the road .
Expect the option expiry week to be a 1 direction trade .
I may be totally wrong yet my bias is downward .
Peter t , I look forward to your interview with Mr puetz
Don’t feel badly, Very few analysts are accurately predicting market direction these days. One who has been correct, that I know of, with a consistently bullish count is Lara Iriarte who has a target of 2913 for a minor three wave up and has had this count for several weeks now. I am still seeing persistent negative divergences with these new highs and while surprised by how high price has gone, I do think we will soon get a good sized trade-able correction. I think a high next week would be consistent with the coming new moon based on the expectation of an August 26 full moon low. Tough market! Hang in there! 🙂
Joe,
Thank you for your explanation of “right side” and “left side” translations. I always appreciate you insights.
Thanks Joe. Really good insights on what could be going on in this market. I completely agree that traders in this market have to be open minded, flexible, and even willing to change horses in mid-stream when price so dictates.
If you are trading this market on the short side there is one thing you must understand…your trades are being targeted.
You have to be blind to not see how furious cash dumps are coming into the market to arrest and reverse every sharp decline.
Bottom line? You can still execute profitable counter-trend trades but you must take profits quickly! I sold triple Q puts at the lows on Thursday for 2.50 that were trading for under a dollar by the close. Trying to swing trade this market is going to frustrate you. You have to SCALP it. I believe the current trend is up, and will all of next week so I am deploying bull put spreads expiring August 17. Perhaps the moon will light the way!
Verne
One thing I noticed a few years ago watching the overnight futures
Was what thought to be computerized trading targeting orders.
I tested it a few times by placing orders both above and below the market
And I watched the futures turn around and target my order . I would then cancel
The order and watch my price of that order get hit then the market would turn
Around and go the other way . I also watched a video one day of a guy talking about
AI and how some of these computerized trading systems also monitor news events , earnings
Statements etc… The guys point in the video was about the time it takes a human to react
Vs a computer . These trading systems are extremely fast vs a human .
Ill agree with you on people trades being targeted as I mentioned above I have seen it and
Was suprised when I tested it.
My point of my post above though is we do now have a set up, right or wrong the set up exists
Next week for me, I’d prefer as up but option expiry week should ideally be down .
On further thought next week is a week I’m going to be careful since I have both Monday and Friday
as key dates yet Tuesday through Thursday unknown .
All in all though I am remaining bearish and looking to trade to the downside since that is
What my work says I should do .
I’ll add , I recently read something about the Bradley model which targets August 28 as an important turn date .
Not saying I’ll trade based on that but it’s another confirmation so to speak that the end of August will be important .
After this July 27- Sept 9 time period ends the market will prove me right or wrong and I’ll accept it .
Right now though I’m staring at a bearish set up and I’m not going to ignore it .
25800-25916 range with a possible yet doubtful poke above 26052 on the Dow . Above that I’ll admit I’m wrong .
Joe
Absolutely Joe.
One of the most frustrating conversations you can have is trying to explain to some people how can, and often is,
manipulated as in the examples you gave, and have them try to tell you there is no such think. I have learned to avoid those discussions. I simply realised most folk are talkers and not traders. No real trader, after seeing example after example of his stops being run with precision, only to have price turn around immediately afterward, could fail to see that this goes on. This is the reason some of the best traders I know do not place their stops in the market and NEVER execute market orders.
Right on the money with that post!
Another real danger in this market that no one seems to be considering is the possibility of a disasterous massive gap down.
Every one is so confident that this or that thing has to happen to tell the whole world, with Mr. Market waving the white flag, that a top has finally arrived! FB certainly didn’t before vomiting up 25% of its market value in a few hours!
Verne
I do not use stops in the futures market yet I do use market orders near key price levels.
My reasoning is to buy or sell without telling the market what I am thinking .
Buy stops or sell stops to enter or exit do get targeted because the brokerage firms are guarding the hen house.
They have the data and that works to their advantage .
I don’t call that manipulation though , I call it war ( or theft )
Trading has changed massively because of computerized trading systems .
It’s a while different game than 30 years ago .
It’s much more important to get the larger picture correct today in even very short
Term trading than before . Very little room for error .
I used to trade the sp 500 with 1/4 pt stops when it was $500 a point yet now
With the emini I need 10 pts ( 500 risk vs 125 ) yet I never place a stop!
The big dump in FB is another example of these systems monitoring the news .
It’s no longer about investing per say or even risk reward .
It’s about greed pure and simple .
What’s going to happen though if someone spoofs the news ?
Will these systems get faked out ?
A fake trump tweet perhaps or a headline news story etc…..( a bs headline yet hacked )
Anyone could do that and these so called AI trading systems would not know the truth from fiction .
We all just have to step up our game a lot more is all.
Fortunately even while trading has changed , many things have not from a broad picture point of view .
At one point in time I could place buy and sell orders over the phone then leave my house ( no cell phones )
And be in and out of the market in less than an hour and not even watch the market .
No way in hell I do that today because if I do I’ll be robbed .
The old addage lives on.
If you don’t manage your trades , the market will manage it for you and
You won’t like how it turns out.
The old rule of thumb was absolutely never use a market order when trading
On a new York market ( commodities ) well now that we have computerized trading
Systems vs floor traders I’d say
Never Take Your Eyes Off the Screen !
Yes indeed. Perhaps I should have clarified that I do use mental stops, as there should always be a number that says you are wrong, I just never tell the broker wbat that number is. I do use buy stop limit orders to enter a position using EW rules as they provide confirmation or negation of a particular wave count. Unfortunately, the choppy indecisive market action has left open the possibility of both bearish and bullish outcomes, making directional trades all but impossible. The market has indeed changed. One has to practically be a day trader, except for long time positions, to execute profitable trades. My own view remains that the the market is now so completely distorted that the next significant event is not going to be just a market correction. I think it will be worse, I just don’t when, neither does anyone else.
Verne
I agree, it’s calculated risk yet other than that we don’t know for sure what
The market will do .
The problem I see with some traders is they marry a point of view rather than
See what the market is telling them .
Admitting I’m wrong and being flexable as well as being open to changing my mind
Is more important to me than being right.
Amen! 🙂
A new weekend blog post is live here: https://worldcyclesinstitute.com/the-predictability-of-stephen-puetz/
This website is for educational purposes relating to Elliott Wave, natural cycles, and the Quantum Revolution (Great Awakening). I welcome questions or comments about any of these subjects. Due to a heavy schedule, I may not have the time to answer questions that relate to my area of expertise.
I reserve the right to remove any comment that is deemed negative, is unhelpful, or off-topic. Such comments may be removed.
Want to comment? You need to be logged in to comment. You can register here.