
Full Moons, New Moons, and Eclipses
Most of us are aware that the Moon has an influence on the market. I thought it would be interesting to see how the Moon has affected this sideways market since the beginning of the year. To do that, I’ve overlain arrows showing the Moon events since January 29, 2018.
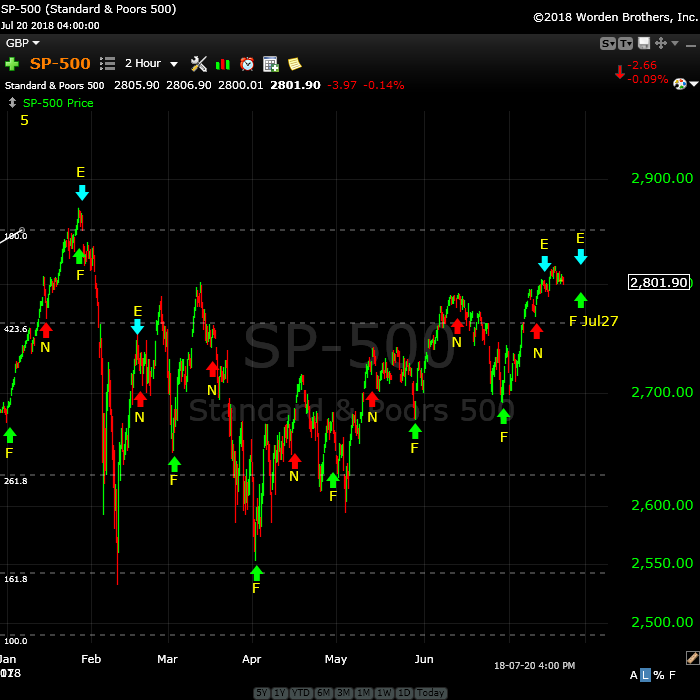
Above is the two hour chart of the SP500 showing the start of the fourth wave (top of the third) at January 29 through today’s date.
What’s interesting is that the full Moon hit turns each and every time, the bulk of them lows. It seems to be a reliable marker of turns, and the turns are, for the most part, turns to the upside.
New Moons were not reliable. They tended to mark a turn of some type, but they weren’t major tops or bottoms.
The first two eclipses hit turns, but they also marked a new and full moon turn, so it’s difficult to ascribe any real significance to them from this limited chart example.
New Moon (red arrow N)
- Feb 15: high
- Mar 17: high (of sorts, not the main high)
- Apr 15: low (not the main low)
- May 15: high
- Jun 13: high
- Jul 12: low
- Aug 11: upcoming
Full Moon (green arrow F)
- Jan 31: major high (top of the third wave)
- Mar 1: major low
- Mar 31: major low
- Apr 29: major high
- May 29: major low
- Jun 27: major low
- Jul 27: upcoming
- Aug 26: upcoming
Eclipses (blue arrow E)
- Jan 31: high — Lunar eclipse (total)
- Feb 15: high — Solar eclipse (partial)
- Jul 13: high of sort, not the main high — Solar eclipse (partial)
- Jul 27: upcoming — Lunar eclipse (total)
- Aug 11: upcoming — Solar eclipse (partial)
I’d be interested in your comments on this.
_______________________
Elliott Wave Basics
There are two types of Elliott wave patterns:
- Motive (or impulsive waves) which are “trend” waves.
- Corrective waves, which are “counter trend” waves.
Motive waves contain five distinct waves that move the market forward in a trend. Counter trend waves are in 3 waves and simply correct the trend.
All these patterns move at what we call multiple degrees of trend (in other words, the market is fractal, meaning there are smaller series of waves that move in the same patterns within the larger patterns). The keys to analyzing Elliott waves is being able to recognize the patterns and the “degree” of trend (or countertrend) that you’re working within.
Impulsive (motive) waves move in very distinct and reliable patterns of five waves. Subwaves of motive waves measure out to specific lengths (fibonacci ratios) very accurately. Motive waves are the easiest waves to trade. You find them in a trending market.
Waves 1, 3, and 5 of a motive wave pattern each contain 5 impulsive subwaves. Waves 2 and 4 are countertrend waves and move in 3 waves.
Countertrend waves move in 3 waves and always retrace to their start eventually. Counrtertrend (corrective waves) are typically in patterns — for example, a triangle, flat, or zigzag. Waves within those patterns can be difficult to predict, but the patterns themselves are very predictable.
Fibonacci ratios run all through the market. They determine the lengths of waves and provide entry and exit points. These measurements are really accurate in trending markets, but more difficult to identify in corrective markets (we’ve been in a corrective market in all the asset classes I cover since 2009).
To use Elliott wave analysis accurately, you must be able to recognize the difference between a trend wave (motive) and a countertrend wave (corrective). There’s very much more to proper Elliott wave analysis, but this gives you the basics.
____________________________
Registration for Commenting
Want to comment? You need to be logged in to comment. You can register here.
If you register, it protects your information. It also allows you to comment without filling in your information each time. Once you’re registered, simply go to the home page and click on the login link top right in order to log yourself in. Usually, you’ll be logged in for several days before needing to be logged in again.
______________________________
Problem receiving blog comment emails? Try whitelisting the address. More info.
______________________________
Couldn’t be happier … KK 2
Couldn’t be happier …The analysis and insight you provide is simply amazing! I’ve been trading the futures and equity markets for well over thirty years and usually average around 5% monthly. Since joining your Traders Gold Service two months ago, that number has better than doubled. I couldn’t be happier.—KK |
Get an upper hand … JC 2
Get an upper hand in trading …Seeing all the different currency pairs and the wave structures and hearing you explain why this has to do that on a nightly bases gives one a upper hand when trading. Elliott Wave applies to all stock and indices and can be applied to any candlestick chart. If someone ask what you want for Christmas – Tell them a membership to Peter’s “Traders Gold!”—JC |
the real deal SM 2
The real deal …‘Educational, insightful and thorough market analysis for all levels of traders. It’s Elliott Wave at its best….Peter Temple is the real deal’ —SM |
Tops in your field DZ 2
Tops in your field …You are tops in your field. Tried to follow Elliot Wave international for years. They were always behind the market. After discovering you, I perceive that you are an expert in reading the waves, which puts you way ahead of the rest of your peers. And you can read the Waves like you are reading tomorrow’s financial section. I pray you stay healthy. —DZ |
Have not had a losing week RW 2
Have not had a losing week …I have been with Peter almost a year. The only thing that matters is have I made money with his service. I think I have finally turned the corner using Peter’s EW. I have not had a losing week in the last 5 months. Thanks Peter, for your amazing amount of hard work. —RW |
Rise above the rest … SM 2
Rise above the rest …I have only ever met a few people who, in their chosen fields (astrology, medicine, music, martial arts, technical analysis), rise above all the rest and you are one of them…you have ‘the gift’…and that’s why I’m a Trader’s Gold member. —SM |
A true expert in Elliott Wave FL 2
A true expert in Elliott Wave …You are a true expert in EW analysis. What you provide is not available anywhere and is priceless. Subscription on your services is the best thing I have ever done. Many thanks for your effort to make me a better investor. I now have more trust in my investment decisions. I hope you will continue the excellent work! —FL |
The best of them JL 2
The best of them …Last couple of years, I subscribed to several ‘market traders’. You are by far the best of them and the personal contact is awesome. Daily and daily updates are very well written! Besides your expertise in EW, I also like your cycles analysis. Best investment I ever made! —JL |
The Market This Week
Here's the latest daily chart of ES (emini futures)
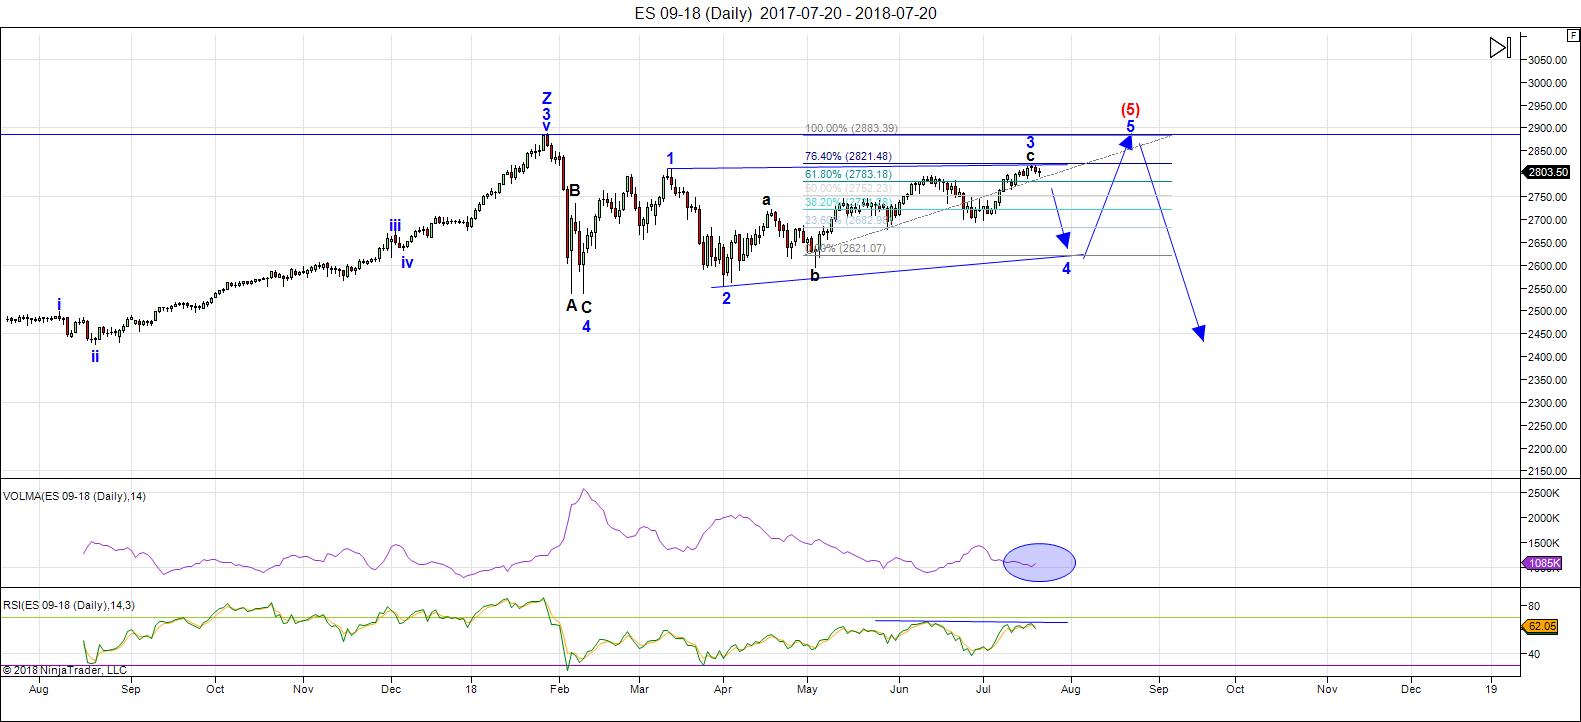
Above is the daily chart of ES (click to enlarge, as with any of my charts).
In the Chart Show this past week (Wednesdays after the market closes), I showed the ending diagonal that we're so obviously in on a 60 minute chart and was expecting a top very soon (in fact, the next couple of days).
Well, the market has chosen to stay up just a little bit longer, but I'm expecting an imminent turn down after a new high.
Ending diagonals most often appear at the ends of a fifth wave, a C wave, and can also appear at the ends of third waves. I would classify this small ED that we're in this weekend as the end of the C wave of the third wave.
The downturn will lead to the fourth wave of the large ending diagonal that we've been in since February 9, 2018.
Fourth waves of ending diagonals usually come down quite quickly. As a example, there appears to be one in progress on the hourly chart of USDJPY. I expect a bottom there very soon (perhaps Monday) around the 110.00. But the point is that it's come down very quickly. They come down in three waves.
The third wave of the larger ending diagonal, which we've been in now since the beginning of April (16 weeks as of this weekend) is always the most complex and longest wave of an ending diagonal. Once it's complete, we're about 75% of the way through the ending diagonal. We have one more wave down (a fast one — wave 4) and one more wave up to a final high (these waves can be fast or slow, but they go up in three waves and cannot be longer than the height of the third wave).
In other words, we're getting close to being done with this final pattern. The US Dollar is also very close to a top and we may see that happen this week. It's making the overall market (certainly currency pairs) quite volatile. As I've been saying the low volume pays a large part of that volatility.
This week, ES claimed its status as an ending diagonal as predicted (the pattern that extends back to Feb. 9). Everything is now in place for a turn to the downside.
The coming wave down (the fourth wave of the ending diagonal) will have a target somewhere near 2600-25.Then we'll turn up into the fifth and final high ... but a high that will have a definite maximum target (to be determined once the fourth wave is fully in place.
Summary: We're waiting for the final wave of a smallish ending diagonal (within a much larger one) to play out. Once it ends on the upside, we'll head down into the fourth wave of the ending diagonal in ES. Once the 4th wave (down) is complete, expect a final fifth wave to a new high. That fifth wave up to a new high will be the end of the 500 year bull market.
___________________________
Trader's Gold Subscribers get a comprehensive view of the market, including hourly (and even smaller timeframes, when appropriate) on a daily basis. They also receive updates through the comments area. I provide only the daily timeframe for the free blog, as a "snapshot" of where the market currently trades and the next move on a weekly basis.
______________________________________
Sign up for: The Chart Show
Next Date: Wednesday, July 25 at 5:00 pm EST (US market time)

The Chart Show is a one hour webinar in which Peter Temple provides the Elliott Wave analysis in real time for the US market, gold, silver, oil, major USD currency pairs, and more. You won't find a more accurate or comprehensive market prediction anywhere for this price.
Get caught up on the market from an Elliott Wave perspective. You’ll also get Andy Pancholi cycle turn dates for the SP500 for the balance of the current month. There’ll be a Q&A session during and at the end of the webinar and the possibility (depending on time) of taking requests.
All registrants will receive the video playback of the webinar, so even if you miss it, you’ll be sent the full video replay within about an hour of its conclusion. For more information and to sign up, click here.


I received permission from Peter Eliades at Stockmarket Cycles to give this small and talented technical group free access to his special report issued 2 days ago (maybe because he hit the S&P top so far exactly 2 days ago… 🙂 ). He did ask that in consideration of this free access that the link strictly not be shared with anyone else (read the message at the end of his report and please respect it!).
http://www.stockmarketcycles.com/2018specjuly25report.html
Thank you Peter G. Very considerate of you! 🙂
Great read. Thanks again Peter G.
I always find it interesting when a number of indicators converge, as some of us were looking closely at the current lunar cycle.
I also noticed this morning that spreads on VIX call options all of a sudden got ridiculously wide. That is usually a dead give-away that volatility is about to bolt higher and sure enough, after the corrupt cabal smashed it down below 12 with ludicrous long shadows on candles this morning ( probably an attempt to keep the risk parity trade from imploding), VIX gapped higher exactly as I expected. Not everyone agrees with my take on this but I think these kinds of events are seminal. I have long contended that when and if this market begins to fall in earnest, it will do so without the consent of the banksters therefore any serious decline is probably a sign of their loosing control of their ability to keep the market propped up. There are no sellers left. The market is falling under its own weight and that is a scary thought. The move down in Nasdaq should already have quite a few risk desks scrambling to reduce exposure and we know how those dominoes fall.
Great trades today on IWM, QQQ and UVXY.
Interesting days ahead and have a wonderful weekend everyone!
Here is Avi’s article if anyone is interested. I would be most interested in hearing some feedback as his view is dramatically different from Peter’s as to when the bull run will end, and which wave we are in currently.
https://seekingalpha.com/article/4189327-sentiment-speaks-will-impending-u-s-economic-collapse-usher-socialism?page=3
I just listened to an interview of Eliades with Cavuto and this guy is sharp. That link is well worth the time to read it folk.
Hi John. Just want to give credit where it’s due.
You were right about that wobble…! 🙂
A new weekend post is live at: https://worldcyclesinstitute.com/a-complex-wave-nears-an-end/
great work