
Full Moons, New Moons, and Eclipses
Most of us are aware that the Moon has an influence on the market. I thought it would be interesting to see how the Moon has affected this sideways market since the beginning of the year. To do that, I’ve overlain arrows showing the Moon events since January 29, 2018.
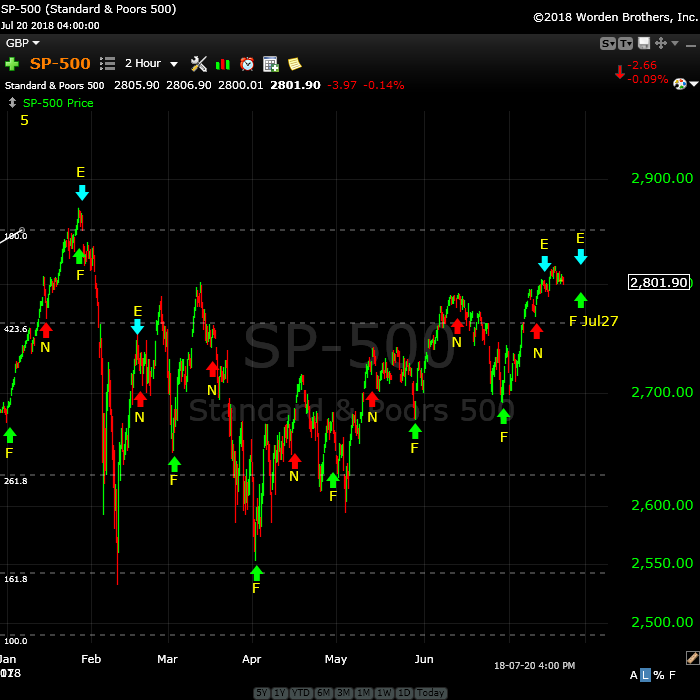
Above is the two hour chart of the SP500 showing the start of the fourth wave (top of the third) at January 29 through today’s date.
What’s interesting is that the full Moon hit turns each and every time, the bulk of them lows. It seems to be a reliable marker of turns, and the turns are, for the most part, turns to the upside.
New Moons were not reliable. They tended to mark a turn of some type, but they weren’t major tops or bottoms.
The first two eclipses hit turns, but they also marked a new and full moon turn, so it’s difficult to ascribe any real significance to them from this limited chart example.
New Moon (red arrow N)
- Feb 15: high
- Mar 17: high (of sorts, not the main high)
- Apr 15: low (not the main low)
- May 15: high
- Jun 13: high
- Jul 12: low
- Aug 11: upcoming
Full Moon (green arrow F)
- Jan 31: major high (top of the third wave)
- Mar 1: major low
- Mar 31: major low
- Apr 29: major high
- May 29: major low
- Jun 27: major low
- Jul 27: upcoming
- Aug 26: upcoming
Eclipses (blue arrow E)
- Jan 31: high — Lunar eclipse (total)
- Feb 15: high — Solar eclipse (partial)
- Jul 13: high of sort, not the main high — Solar eclipse (partial)
- Jul 27: upcoming — Lunar eclipse (total)
- Aug 11: upcoming — Solar eclipse (partial)
I’d be interested in your comments on this.
_______________________
Elliott Wave Basics
There are two types of Elliott wave patterns:
- Motive (or impulsive waves) which are “trend” waves.
- Corrective waves, which are “counter trend” waves.
Motive waves contain five distinct waves that move the market forward in a trend. Counter trend waves are in 3 waves and simply correct the trend.
All these patterns move at what we call multiple degrees of trend (in other words, the market is fractal, meaning there are smaller series of waves that move in the same patterns within the larger patterns). The keys to analyzing Elliott waves is being able to recognize the patterns and the “degree” of trend (or countertrend) that you’re working within.
Impulsive (motive) waves move in very distinct and reliable patterns of five waves. Subwaves of motive waves measure out to specific lengths (fibonacci ratios) very accurately. Motive waves are the easiest waves to trade. You find them in a trending market.
Waves 1, 3, and 5 of a motive wave pattern each contain 5 impulsive subwaves. Waves 2 and 4 are countertrend waves and move in 3 waves.
Countertrend waves move in 3 waves and always retrace to their start eventually. Counrtertrend (corrective waves) are typically in patterns — for example, a triangle, flat, or zigzag. Waves within those patterns can be difficult to predict, but the patterns themselves are very predictable.
Fibonacci ratios run all through the market. They determine the lengths of waves and provide entry and exit points. These measurements are really accurate in trending markets, but more difficult to identify in corrective markets (we’ve been in a corrective market in all the asset classes I cover since 2009).
To use Elliott wave analysis accurately, you must be able to recognize the difference between a trend wave (motive) and a countertrend wave (corrective). There’s very much more to proper Elliott wave analysis, but this gives you the basics.
____________________________
Registration for Commenting
Want to comment? You need to be logged in to comment. You can register here.
If you register, it protects your information. It also allows you to comment without filling in your information each time. Once you’re registered, simply go to the home page and click on the login link top right in order to log yourself in. Usually, you’ll be logged in for several days before needing to be logged in again.
______________________________
Problem receiving blog comment emails? Try whitelisting the address. More info.
______________________________
Rise above the rest … SM 2
Rise above the rest …I have only ever met a few people who, in their chosen fields (astrology, medicine, music, martial arts, technical analysis), rise above all the rest and you are one of them…you have ‘the gift’…and that’s why I’m a Trader’s Gold member. —SM |
Tops in your field DZ 2
Tops in your field …You are tops in your field. Tried to follow Elliot Wave international for years. They were always behind the market. After discovering you, I perceive that you are an expert in reading the waves, which puts you way ahead of the rest of your peers. And you can read the Waves like you are reading tomorrow’s financial section. I pray you stay healthy. —DZ |
The best of them JL 2
The best of them …Last couple of years, I subscribed to several ‘market traders’. You are by far the best of them and the personal contact is awesome. Daily and daily updates are very well written! Besides your expertise in EW, I also like your cycles analysis. Best investment I ever made! —JL |
the real deal SM 2
The real deal …‘Educational, insightful and thorough market analysis for all levels of traders. It’s Elliott Wave at its best….Peter Temple is the real deal’ —SM |
Couldn’t be happier … KK 2
Couldn’t be happier …The analysis and insight you provide is simply amazing! I’ve been trading the futures and equity markets for well over thirty years and usually average around 5% monthly. Since joining your Traders Gold Service two months ago, that number has better than doubled. I couldn’t be happier.—KK |
Have not had a losing week RW 2
Have not had a losing week …I have been with Peter almost a year. The only thing that matters is have I made money with his service. I think I have finally turned the corner using Peter’s EW. I have not had a losing week in the last 5 months. Thanks Peter, for your amazing amount of hard work. —RW |
A true expert in Elliott Wave FL 2
A true expert in Elliott Wave …You are a true expert in EW analysis. What you provide is not available anywhere and is priceless. Subscription on your services is the best thing I have ever done. Many thanks for your effort to make me a better investor. I now have more trust in my investment decisions. I hope you will continue the excellent work! —FL |
Get an upper hand … JC 2
Get an upper hand in trading …Seeing all the different currency pairs and the wave structures and hearing you explain why this has to do that on a nightly bases gives one a upper hand when trading. Elliott Wave applies to all stock and indices and can be applied to any candlestick chart. If someone ask what you want for Christmas – Tell them a membership to Peter’s “Traders Gold!”—JC |
The Market This Week
Here's the latest daily chart of ES (emini futures)
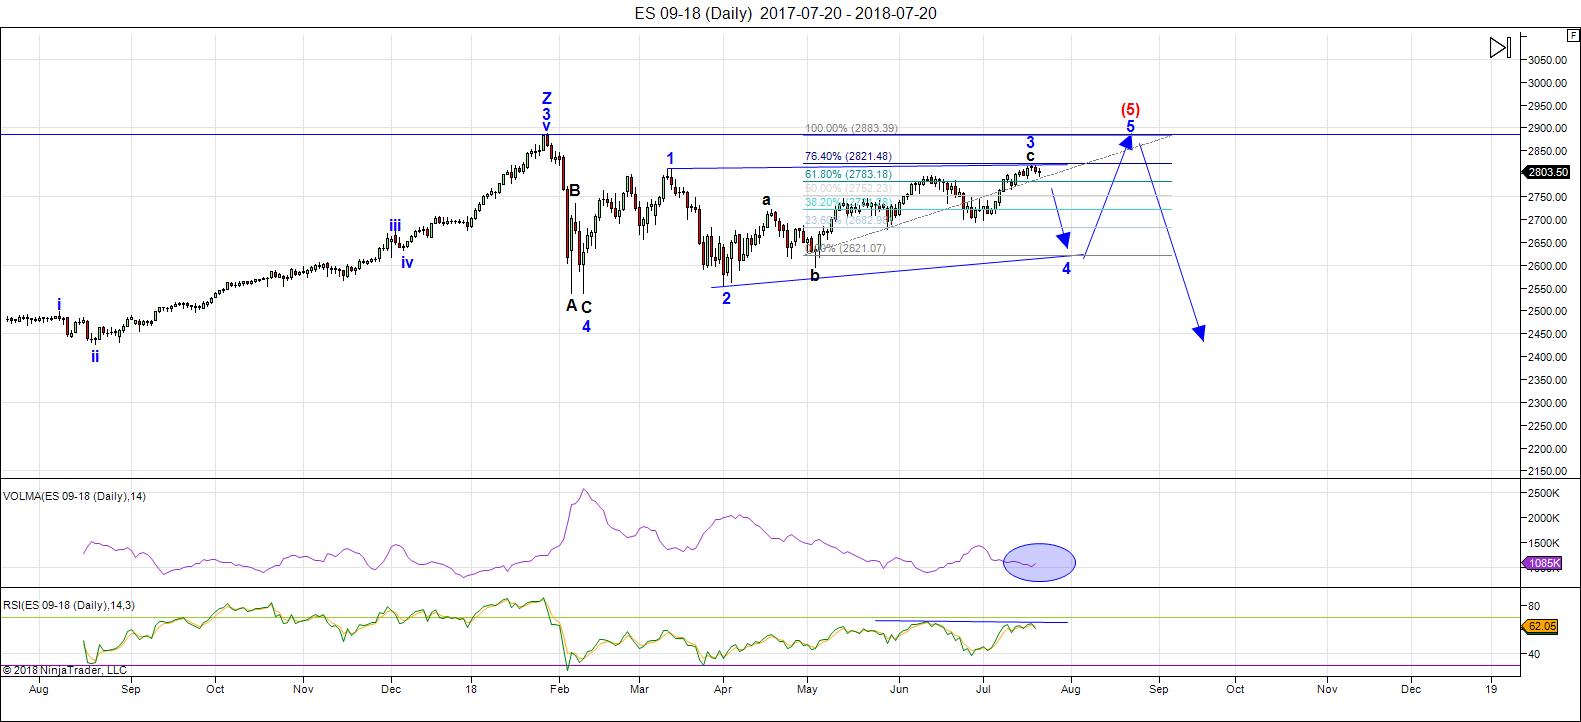
Above is the daily chart of ES (click to enlarge, as with any of my charts).
In the Chart Show this past week (Wednesdays after the market closes), I showed the ending diagonal that we're so obviously in on a 60 minute chart and was expecting a top very soon (in fact, the next couple of days).
Well, the market has chosen to stay up just a little bit longer, but I'm expecting an imminent turn down after a new high.
Ending diagonals most often appear at the ends of a fifth wave, a C wave, and can also appear at the ends of third waves. I would classify this small ED that we're in this weekend as the end of the C wave of the third wave.
The downturn will lead to the fourth wave of the large ending diagonal that we've been in since February 9, 2018.
Fourth waves of ending diagonals usually come down quite quickly. As a example, there appears to be one in progress on the hourly chart of USDJPY. I expect a bottom there very soon (perhaps Monday) around the 110.00. But the point is that it's come down very quickly. They come down in three waves.
The third wave of the larger ending diagonal, which we've been in now since the beginning of April (16 weeks as of this weekend) is always the most complex and longest wave of an ending diagonal. Once it's complete, we're about 75% of the way through the ending diagonal. We have one more wave down (a fast one — wave 4) and one more wave up to a final high (these waves can be fast or slow, but they go up in three waves and cannot be longer than the height of the third wave).
In other words, we're getting close to being done with this final pattern. The US Dollar is also very close to a top and we may see that happen this week. It's making the overall market (certainly currency pairs) quite volatile. As I've been saying the low volume pays a large part of that volatility.
This week, ES claimed its status as an ending diagonal as predicted (the pattern that extends back to Feb. 9). Everything is now in place for a turn to the downside.
The coming wave down (the fourth wave of the ending diagonal) will have a target somewhere near 2600-25.Then we'll turn up into the fifth and final high ... but a high that will have a definite maximum target (to be determined once the fourth wave is fully in place.
Summary: We're waiting for the final wave of a smallish ending diagonal (within a much larger one) to play out. Once it ends on the upside, we'll head down into the fourth wave of the ending diagonal in ES. Once the 4th wave (down) is complete, expect a final fifth wave to a new high. That fifth wave up to a new high will be the end of the 500 year bull market.
___________________________
Trader's Gold Subscribers get a comprehensive view of the market, including hourly (and even smaller timeframes, when appropriate) on a daily basis. They also receive updates through the comments area. I provide only the daily timeframe for the free blog, as a "snapshot" of where the market currently trades and the next move on a weekly basis.
______________________________________
Sign up for: The Chart Show
Next Date: Wednesday, July 25 at 5:00 pm EST (US market time)

The Chart Show is a one hour webinar in which Peter Temple provides the Elliott Wave analysis in real time for the US market, gold, silver, oil, major USD currency pairs, and more. You won't find a more accurate or comprehensive market prediction anywhere for this price.
Get caught up on the market from an Elliott Wave perspective. You’ll also get Andy Pancholi cycle turn dates for the SP500 for the balance of the current month. There’ll be a Q&A session during and at the end of the webinar and the possibility (depending on time) of taking requests.
All registrants will receive the video playback of the webinar, so even if you miss it, you’ll be sent the full video replay within about an hour of its conclusion. For more information and to sign up, click here.


You might be familiar with this site:
lunatictrader.com/performance
I didn’t know about this site, and will get a chance to review it tonight. Thanks PA3!
It seems based on the small sample size that the clearest and strongest correlation is with full moons. As you noted, the key bit of information is that it signals turns, and while it’s mostly off lows, that is not always the case so this poses a real challenge in explaining causation (different outcomes). My own scant reading on the subject said full moons were associated with market weakness which is vague. Your brief study provides much more useful information as we can tentatively coclude full moons signal market TURNS, and generally off market LOWS.
Coupled with other information this could be quite useful.
For example, based on price action Friday I would not expect the July 27 full moon to signal a low as it generally does, but the opposite. If price however heads lower on Monday and takes out last week’s lows, it would be then more likely we get a low by Friday. Markets do tend to fall more rapidly than they rise as we saw February.
Interesting stuff!!
For an option trader like me, this is a very powerful addition to the arsenal of tools used to ply the trade.
Strong price movement is the key to profitable option trades, and if one could reliably peg market turns even at a 70% accuracy rate, you could trade less frequently, trade bigger lots, and yes, be MUCH more profitable!
Thanks for the mini study Peter. Very helpful.
I will now follow up with a mini study of my own and select a few option trades based on this idea.
I will post entry, exit, and cost basis. The objective will be 100% return on the trade, and if indeed we are entering with good precision at market turns, we should see a very high rate of success.
Since we cannot be certain if a low or high is being signaled, to be objective I will open a straddle so we can crunch the numbers either way.
Will be interested to see how that study works out.
Here is annother very interesting tidbit. Are market makers aware of this correlation and even more importantly, do they price it into option chain? We can establish this with a fair degrer of certainty by noting how and if delta changes as a full moon approaches. Clearly it would take several months of data to draw firm conclusions but I am going to be watching the chains catefully this week, and especially the Thursday/Friday rate of change. I expect we should see some kind of similar correlation with VIX. If this correlation holds, and the Black-Scholes formula does not account for it, and/or the market makers are unaware of it, it would be one of the most unfair trading advantages as an options trader I have ever seen. Kinda like NFLX earnings straddles!
Peter we may wanr to continue this conversation off-line.
I hate when the SEC comes around asking about my trades!!
Just kidding! 🙂
I think you’d like to be referred to as “Big Blue” … lol (maybe not by the SEC, though).
Definitely not the SEC. They might consider that a bit….well, cheesy! 🙂
saw your Moon blog & couldn’t resist, Peter T 🙂
normally going into/around the NEW moon — markets tend to go up & going into/around a FULL moon — markets tend to go down.
There’s a saying :: BUY the FULL moon … SELL the NEW moon.
am a bit skeptical about THIS coming [ FRI July 27, 2018 ] TOTAL Lunar Eclipse/ FULL moon as being same as Jan 31, 2018 TOTAL Lunar Eclipse…cause of the word “South”…in North America”. I tweeted about my “concerns” & “favourite”/”likes” for quicker access to some of my tweets I consider important, to me. oh yea… I find IF the SOLAR/LUNAR eclipse — depending IF “TOTAL” / “PARTIAL” and WHERE seen — has some bearing on WHICH Stock Markets it affects.
“South … in North America” -July 27 [LUNAR – Total]
“NORTH in North America” – Aug 11 (SOLAR – partial)
cause Jan 31, 2018 TOTAL LUNAR — just “North America”
& Feb 15 & July 13 SOLAR eclipse (partial) – NO mention of North America @ all
https://twitter.com/buddiebuddiee/likes
follow up on eclipses ==>> http://www.astrologicalinvesting.com/html/articles_pages/articles-eclipses.html
signs of stock market crashes ==> HowToPredictStockMarketCrashesGreatDepressions.pdf
Traderaffiliates no longer blogs – but he did a study on moon phases & Puetz Theory https://www.google.ca/search?q=Stock+Market+Timing+:+Solar/Lunar+Correlations+to+Short-Term+Trading+Cycles&tbm=isch&cad=h#imgrc=4S_QsOixLWb1SM:
http://www.tradersaffiliates.com/CRASH%20OF%202008.htm
anyhow — GL all !
Thanks for all this info, Emily!
O.K here is the general approach. Since Peter’s data is based on SPX, we will look at SPY option chains going into Friday.
For several reasons I think the 280 strike is a good choice. Either we go higher starting Monday, before putting in a low on Friday, or we start a decline immediately. Evidence so far points to the former and we should get an idea from futures in a few hours. If the market makers are pricing in a full moon low, delta should be HIGHER on Friday than Thursday for calls. If premiums pop as evidenced by higher bid/ask with no appreciable change in delta, it means the pricing model is ignoring the full moon but market makers are not, particularly if we see a widening spread. Stand by….
Verne,
Spend time reading all of Danny’s articles on Lunatic Trader before getting too deep in other studies based on this. I have been following Danny’s work since 2014 or so. He is a good guy. A dolphin in a sea of sharks. Sometimes this lunar cycle is a dream come true… and then it’s not. I saw a correlation with other planets that seemed to override the lunar cycle. Good luck to all. This is certainly a valid cycle and part of the PALS system that someone was sharing earlier on on this blog.
Thanks Skippy. I will take a look.
Fortunately, Peter’s post was lucid enough to allow design of a simple trading experiment. The great thing about a straddle is that you don’t really care whether the full moon is heralding a top or a bottom, just so long as it is A top, OR, bottom. Sideways price action is the least desired outcome. Peter’s chart and correlation is compelling, and as I indicated, you do not need a 100% success rate to take advantage of what appears to be a high correlation indeed. The way Peter presented it was brilliant in its simplicity. Most of what I had read I found way too erudite, convoluted, or vague. Let”s see what that straddle does. The potential is there for a double or better on both legs. The idea would be to cash in the calls on a Friday low, add the gains to the put position and roll it out a few weeks. I like it!
Oops! I meant of course cash in on the PUTS, on a Friday low and add to and roll the calls…but you knew that…! 🙂
worth reading
https://mmacycles.com/index.php?route=blog/article&category_id=1&article_id=207
. I mean, this is a lunar eclipse that 1) is a day after Mercury turned retrograde, 2) while it forms a hard, fixed T-square with the Mars/Uranus square in very early fixed signs. Mars is 3) not only retrograde, along with Mercury, but Mars is 4) in an opposition to the Sun in the fire sign of Leo. That is, the fiery planet Mars is in a very hard opposition to the fiery Sun in the fiery sign of Leo, forming a T-square to the master of chaos, Uranus.
Sounds like…fireworks! 🙂
Moon Trade.
Buying to open, July 30 expiration SPY 279.50 straddle for limit price of 3.00 per option straddle a put and a call with
same strike price and expiration date.
Another interesting thing about this Friday is that the market has gone nowhere for months, and has been in this sideways coil.
These patterns almost always lead to a violent move out of them and the duration of this one suggests it could be powerful. Which direction, is the million dollar question!
Moonwobbles and the market:
Everytime when there is a moonwobble , we can see an effect on the market.
May 2017, July/August 2017, Nov 2017 and Jan/Feb 2018.
You can find them right here.
http://bathtubbulletin.com/moon-wobble-peaks-july-18/
The peak energy of the wobble now July/Aug 2018 is July 29 and will run into Aug.
So the market can drop this week and maybe next week.
Probably it will start Tuesday or Wednesday this week.
What is the effect of the wobble? Is it generally bearish, or bullish?
I went to the site and carefully read but could glean no information about HOW the phenomenon is supposed to affect market price. The author has plotted “strength” vs dates, which I assume are wobble dates but he has no units for strength so there is no way to understand, much less check the validity of his claims. That is weird as he claims there is a lot of available data. I guess I have been spoiled by the peer review process….
This week and beyond: So far so good. Monday morning the Low and then fast higher until the beginning of Wednesday. Then a (little) decline and up again. Thursday earley (after opening EU and before opening Wallstreet) THE HIGHEST HIGH and starts the decline into the weekend. But also THE TOP for a hughe decline into 10th of August.
The pattern the High 26 july. The Low on 2 August. High on 6 August. Lowest Low on 10 August early in the morning US.
Watch http://www.prognoseus500.nl/
Interesting! Your indicators are predicting an inversion from the usual full moon low with a high instead this Friday. That does not contradict Peter’s data as this occasionally is the case. It is your prediction vs the higher statistical probability of a low this Friday.
We will see if you are right! 🙂
I had to pony up a bit more for straddle. Ended up with a walk limit and had to walk bid up an additional ten cents.
Filled at 3.10…
Hi Peter, The Sun and the Moon
as a researcher I do not know anything about the sun or the moon. No you examine the past tops and the bottoms and also the panic tops and bottoms with the position of the sun and Moon. Then there remain certain indicators that you can use and these are available on the internet. But as you have already seen it, it costs you a lot of time. I’m still researching after 15 years and do not fully trust some indicators.
Hi Verne,
Perhaps there is the decline to 2780. I don’t think so. But could be. The indicators are predicting a hughe up. Be careful
Yep. It is a dangerous, treacherous market, no question. I expect the break, whatever the direction, to be quite violent as the sideways coil has persisted for quite some time. Seems to me a lot capital is being expended to keep prices afloat. If so, risk is to the downside. Just look at the downside candles! We also have open overhead open gaps.
A quick gander at the five hr chart is pointing to a move higher.
What we have seems to me to be sideways consolidation. Not sure how this jives with Friday full moon. Inversion?!
We really should close the gap from last Thursday at 281.06 to confirm the move up. A close below leaves open the possibility of a bull trap….
279.50 puts down significantly at over 30% but no significant movenent in 279.50 calls.
That plunge in the price of put contracts tells us market makers are not, at this point, expecting a low this week. Interestingly enough, neither is the pricing model. Fasinating!
“When the Moon”s in the sky
Like a big pizza pie….” 😀
No one is shorting the market as most hedge funds have scooped up their marbles in disgust and gone home.
There is no volume.
Who are the longs going to sell to when they want out?
Who is going to cover shorts to put in a bottom with no short sellers?
Why don’t more oeople understand how this HAS to end? Or is it just me? 🙂
Straddle down 0.30 at 2.80 at the close. A bit more movement on calls as day wore on. Let’s see what Tuesday unfolds…
ES made a lower low than Friday on Sunday so it would appear that the small fourth wave of the potential small diagonal actually completed this weekend. I calculate a rough maximum high for wave five to keep it shorter than wave three (about 53 points) to be about the 2840-2845 price range (The Sunday low was around 2793). That is only an eyeball figure and I am sure other traders can provide a more precise measurement. We could hit that target tomorrow. Getting close….
If the typical full moon correlation holds and this wave up completes today or overnight, since it is an ED, the reversal will be typically swift and brutal, retracing the entire ED in very short order. It is hard to believe that this would be the case for such a well-established correlation with full moons but so far, it appears market makers are discounting any such effect. The straddle will go well in the money today and if SPY goes above 283 I will cash in 279.50 calls, which would have doubled, and hold the 279.50 put, courtesy of the house. I will roll profits from calls into puts on any move above 284.5 or sign of a reversal.
“When the moon’s in the sky
Like a big pizza pie…” 🙂
Hi Verne,
The decline goes further then the 10th.
The pattern the High 26 july. The Low on 2 August. High on 6 August. Low on 10 August early in the morning US. High on 17th and a hughe decline from Sunday 19th – 23 and perhaps further. My indicators 2a and 2b support the Bleu line(my old index). So I expect it is a good prediction. I will adjust the website today
http://www.prognoseus500.nl/
So far, only a DJI high today….
Thanks Wilem. We should have a downtrend that corresponds with the time frame you are citing.
Sure looks to me like we have broken up-trend price channel. Cashed out 279.50 calls for nice double. Holding 279.5 puts courtesy of the house. We can complete our mini study at better than zero cost basis, and potentially a handsome return. And that ain’t no small cheese! 🙂
I expect Peter is going to be delivering a helluva chart show tomorrow! 🙂
Wave 3 now longer than wave 1 so that pretty much negates the ED. What say you PETER?
Hi Charlie,
I’m going to guess that you might be talking about either ES or the SP500. The third wave is about 4 points longer out of a move of 276 points, which is 0.02% (that was an SP measurement I did earlier today) I’m not that concerned. I’ve seen them overshoot by a point or two before. And I’ve thrown out enough caution in tonight’s video, that I think it takes care of it.
It would have to rise higher than that in such a low volume market to negate the pattern, as far as I’m concerned. The larger pattern can’t really be anything but an ending diagonal, particularly since so many other indices have them. It satisfies all the other requirements, so unless something else happens to negate ES/SP500 or one of the other ones, I wouldn’t get too concerned. Tonight/tomorrow should confirm the turns.
Yes PETER I was referencing the SPX market. Wave 3 is now 10 points longer. At what point does the length become “too much” for an ED to still be valid?
It is truly mind-blowing. All kinds of folk are blathering obstinately about how SPX and ES are in the middle of third wave impulses up with MUCH more upside. I am looking at impulsive reversals, bearish engulfing candles and thinking…Huh???
Oh, but you see, all the tech companies yet to report earnings are going to send prices to the MOON! Doncha know? 🙂
Normally a full moon would be a bottom, but on a lunar eclipse sandwiched in between solar eclipses?
No. I’d have to go back & look at the specific criterion, but we may have a Peutz Window here… Someone correct me if I’m wrong. Not at main PC & too lazy to look right now.
Very nice daily doji on SPX…!
Some of you may recall I posted a chart of a rising channel on SPX in January about a week before the all-time high that came close to pinpointing that high. Now we are confronted with a declining channel on the DJIA, one that perhaps few have noticed because it is based on closing prices rather than intra-day highs and lows (a typical bar chart). This channel suggests this advance is either in its terminal stages or the channel is about to be penetrated to the upside with a renewed advance. I doubt very much that will happen but I will watch. For those of you who like exactness, the channel line today is at 25,264, January 26=25,253, January 27=25,242, and next Monday=25,231. Don’t look for exactness but don’t be surprised by it either… 🙂 https://imgur.com/a/KqeiiSI Remember to click on the chart to make it full page!!
I think we should hit the 2840-2845 target sometime today, and probably the lower end of that range.
Good call! Looks like the ED broke. I went long once wave 3 exceeded wave 1 by 6 points
Nice!
There have been occasions where the full moon has heralded a high turn instead of a low one. I will have to conclude if we do not see a turn today that this will be the case for the one on Friday. I seriously doubt the kind of correction we are anticipating will unfold in only two day to give a Friday low of any significance. As a matter of fact it would also seem highly unlikely to conclude in three days, assuming we got a turn today. Price is what it is, and the mini experiment may have to wait for next month to get the first data point!
What we may get is just a wave 1 or a wave A down from this full moon. Then a bounce into early Aug followed by a low in Aug full moon.
How deep for wave A?
Around 2750 on ES. It is clearly getting late though.
Interesting! That was the last contested pivot so a reaction there would be a reasonable expectation.
Iteresting reaction of VIX to DJI run-up.
Booh-Yah!! 5 bagger on FB earninings straddle! WOW!
Next, Bezoz and company…Holy Smokes!!!
The 1865 straddle is close to 9k and factors in a 4.2% move. Think it will drop like FB?
I am expecting even more carnage there as the chart is more bearish. The premiums are are a bit rich, but I am biting the bullet and getting puts. Also loading a big bear call spread out 30 days.
Just taking one side then? The Friday puts seem like a good value if it takes a big hit. Wonder what the average% gain or loss has been after AMZN reports. Hope the faang stocks go to hell in a hand basket!
Pretty much. I have a small long position as a hedge with a higher strike price so it’s more like a strangle.
These banksters are tracherous. I would not be the least bit surprised to dump a few hundred million into AMZN even with an earnings miss. We are giving the AMZN trade a bit more time to play out just in case. Also looking for a DCB in FB.
A new low in NQ gives a clear 5 down….!!
A lot of folk are probably wondering about what they are seeing in NQ. Those kinds of candles are rarely produced by normal selling. What you are looking at, in my humble opinion, is LEVERAGED exits. How do you think we got these nose-bleed levels?
“Nuff said.
Peter G,
I feel relatively certain you meant July instead of January. That DJIA has been violated by say .6 of 1%…Would you say that perhaps that channel line could still repel the market lower?
I think it is now safe to anticipate, based on DJI’s frisky ramp higher, that the moon event this week will mark a maket turn at highs, instead of lows. I am getting positioned early with 255 strike DIA puts. I would not be at all surprised by a final spastic lurch higher tomorrow to keep early bears like me intimidated…lol!
DJI looks like it’s in a fourth wave triangle. One more wave up.
If the full moon this Friday ushers in a high, the pattern, since January, will have been a full moon high followed by TWO consecutive full moon lows. If the pattern holds, it looks like we could be heading lower into the August lunar cycle, with an expected low at the August 26 full moon. If that happens, it is going to really get my attention, even with the delay of our little experiment. After all, the only way to confirm the validity of any analytical methodology is to demontrate, repeatable, predictive value. Sadly, the vast majority of touted methods fail spectacularly on this score, yet people continue to employ them.
A market low around August 26 in my view would warrant further exploration.
Thoughts?
If we have nested 1,2 waves down in Nasdaq, the other indices cannot be far behind….
AMZN met on EPS, a now useless, meaningless, and outright fraudulent metric so far as stocks are concerned, but missed on revenue and guidance. Price bounced to probe FB gap down and quickly faded. The reaction will be delayed, but the open gap is bearish. Just a matter of time….
Today I learned that Mecury goes retrograde and what it implies.
Any insights from the astro experts?
Tech slides. Especially if there are harsh aspects to Uranus. That’s how I nailed the QQQ top last November (In addition to Gartman’s bullish tech call at the same time).
Thanks Mike. People are celebtating the fact that AMZN did immediately implode.
I suspect that may be somewhat premature… 🙂
I meant to say did NOT….
SPX looks to be completing some kind of fourth wave triangle, but not sure what degree. If correct, we get a final thrust up to complete the current wave. It is unclear to me if this would the fifth of a third with another 4,5 to come or a final wave. The latter would jive well with a full moon high.
current dow potential triangle
weekly chart :
https://imgur.com/d4d5pAA
same chart previously posted
https://imgur.com/zi4DDiH
note: the weekly low to low to high count does match up with Fridays lunar eclipse.
adding 10 trade days though to include mercury retrograde would call for
a high on or near august 6th .
therefor a high above 25800 on the cash dow is a must in order for this
potential triangle to have any merrit .
peter t focuses on the spx and es , my bias is the cash dow only .
counting 6 weeks forward from both solar eclipses as well as counting
10 trade days forward after the end date of mercury retrograde must be done
in order to call for a potential low .
if those dates are going to call for a low then we should extend high in the dow
to complete wave B of a much larger triangle formation ( or a simple B wave high )
it will be very important that aug 6th-as well as the upcoming solar eclipse become highs of sorts. one being the high and the other being a swing high.
as of now i do not see a fair risk reward to taking a bearish stance yet that time
is coming closer
all i have to add at the moment .
Joe
That is one huge triangle Joe.
If you are right, it means more sideways movement the rest of the year with a new ATH sometime next year.
That would certainly blow all expectations of a top in this market anytime soon out of the water. Perhaps the bullish folk are correct and the bull still has some room to run! 🙂
Verne
more times then not and im not trying to change anything i said above.
more times then not mercury goes retro and the market drops
for 10 days and forms a bottom and then rally’s.
my bias above assumes we get something different .
Aug 6th becomes important regardless of what i wrote above.
im standing by what i wrote above though for other reasons based
on previous bearish setups which also include mercury retro not going
as it typically does.
What you are saying makes sense Joe. We obviously are not going to get a low on this full moon Friday as is usually the case so some kind of inversion must be in play with closer to a high instead being notched. It would make sense that the same would obtain with a something different from the usual with Mercury going retrograde.
Note:
friday is a full moon lunar eclipse
the upcoming solar eclipse is approx 2 weeks from now
adding 10 days to mercury retro is also approx 2 weeks away.
aug 6-11th is what im talking about 2 posts up .
hopefully that clears up any potential confusion .
this lunar eclipse does matter im just not sure its going
to move the market since we do have a weekend .
good luck everyone
I agree. There is an EW analyst who had a bullish impulsive counts in SPX with a target of 2787 which she has had now for about a month. This was based on bullish A/D and OBV signals and I was so sure she was incorrect and we would not get past 2845 if it were and ED. She was right and I was wrong. You simply cannot argue with price and the fact that her various targets up have all been met so far argues for the correctness of her wave count, even though I initially disagreed with it. She has us completing a third wave up of five. I will be paying closer attention to OBV going forward.
We have a VIX reading this morning below 12.00 and that is short term quite bearish it seems to me.
It just occurred to me that if the market continues higher in a departure from what typically happens when Mercury goes retro, this would mean that we will get neither a high nor a low this full moon.
Joe I was wondering what you thought of that possibility.
NQ has a big candle that looks terminal. Not quite five down but it could happen before the open…
Verne, FWIW, I read a recent article by Avi and he is looking at mid 2020’s for W3. Time will tell.
Is that for SPX, and would that be a wave down? Thanks!
He is showing Dow charts around comment. Refers to end of W3 bull and beginning of W4 down. Seeking Alpha Jul24.
O.K. Around 20K for DOW the down sounds about right for at least an intermediate degree wave. I am not sure if Avi thinks we still have a primary 5 to come but I think he has us finishing an intermediate three of primary 5
O.K. I found the article and AVI was not talking about price levels as I assumed from your post. He was talking about the end of the current Cycle 3 wave. He expects the current multi-generational third wave, which he says began after world war 2. What is perplexing is that he also states that world war 2 ended in 1932 and that this makes the current wave some 90 years in duration. That assertion is clearly erroneous and I am not sure why someone as capable as he could get a well-know fact of history so completely wrong. Very strange!
1932 was the bottom of wave 4. That’s pretty obvious if you take a look a the long range chart, which I’ve posted several times. Can do again. We’re at the top of wave 5. It depends on when he’s starting his count. But because cycles are in 500 year increments, you have to start there for the current count.
The previous cycle high was 1492. 500 year cycles are actually 515/6 years in length (Puetz/Wheeler). That puts the most recent turn at 2007/8 so we’re on borrowed time (hence the B wave from 2009). My data goes from 1509, so I’m missing the first subwave.
Wave 1 high: South Sea Bubble 1720
Wave 2 low: 1783 Depression
Wave 3 high: 1929 inflated high and stock bubble
Wave 4 low: 1932
I forgot to say he expects the bull market to complete in 2020.
Oops! My mistake folk. Avi did NOT say it was the end of WW !! as I stated but that WAVE 2 ended in 1932. I stand corrected on that last post. That is what happens trying to read without one’s glasses! 🙂
Based on Astrology, 2020 should be a bottom. Huge alignment, Pluto / Saturn Conjunction. Last time we had that was 1982. Peak of the recession / market bottom was a few months prior.
Thanks Peter T. You saved me a bit of research. I was going to try and find a long term chart of the market and see if I could figure out what Avi was talking about. I have to say I just don’t see another two years of this bloated beast’s surviving, as much as I respect Avi’s talents. I think that your are right on the money in calling this a terminal wave.
Thanks again for chiming in…that’s why we are here! 🙂
haha. I would have to ask where the volume’s going to come from … another two years? And Italy, and Spain, and Deutsche Bank. This list is becoming quite long … all on “the edge.”
Well, it took awhile but it does look like we have turn….
“Somewhere there’s music
How faint the tune
Somewhere there’s heaven
How high the moon”