Update: End of day Friday, Sept 4, 2015
So many updates, but this has been such a fluid day! Triangles have been on again, off again. Well, they,re on again!
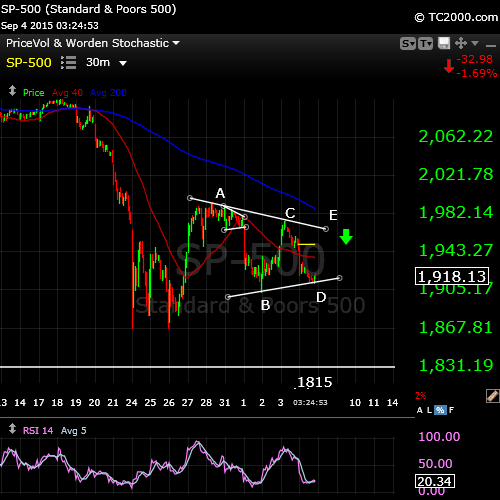
Above is the SP500 after finishing today’s wave D down and already starting the bounce into wave E (over the weekend). The path is very clear: We’re going up now, one last time. This is a large 4th wave triangle we’ve been dealing with. Once it’s complete, wave 5 down begins. It will likely start down on Tuesday. Monday is a holiday (in the North American markets, at least). I will do a complete new post on the weekend.
Update 2:30AM EST, Friday, Sept 4, 2015
I’m seeing a fourth wave triangle shaping up, with the D wave ending now in the futures. The labor report at 8:30AM EST may send us back up in the E wave, before we turn down for the remainder of the fifth wave (waves, 3,4,5). That’s just a guess. That’s the story for the futures (chart below). Fourth wave triangles signal the ends of waves are coming soon, so this won’t be as big a drop as it otherwise would have been but we will still need to go to a new low. We may not trace out a full triangle in the US indices (I’ve provided two scenarios below).
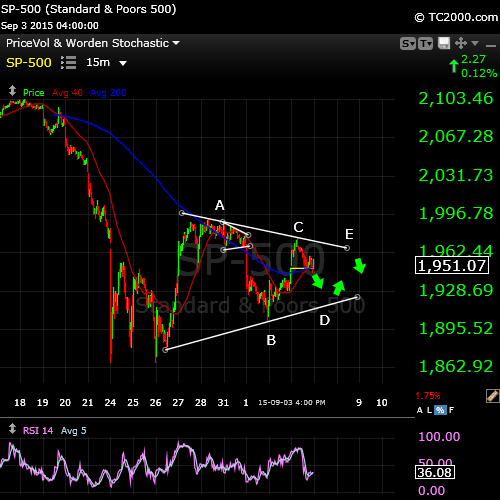
That’s what I’m seeing more or less in all the main US indices. The SP (above) would also work as a second wave heading down into a 3rd of the 5th. It doesn’t necessarily need to complete the triangle (I show the second scenario in the chart below).
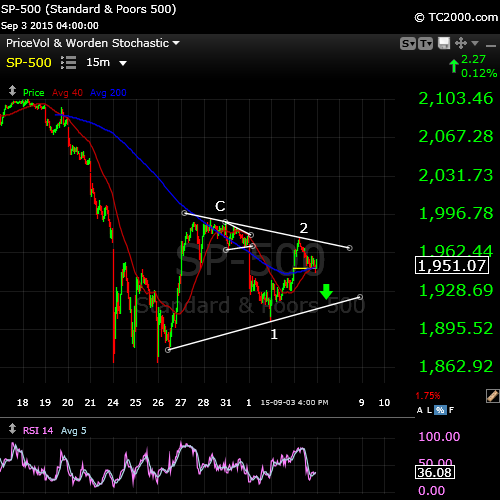
Below is what I’m seeing in the futures overnight.
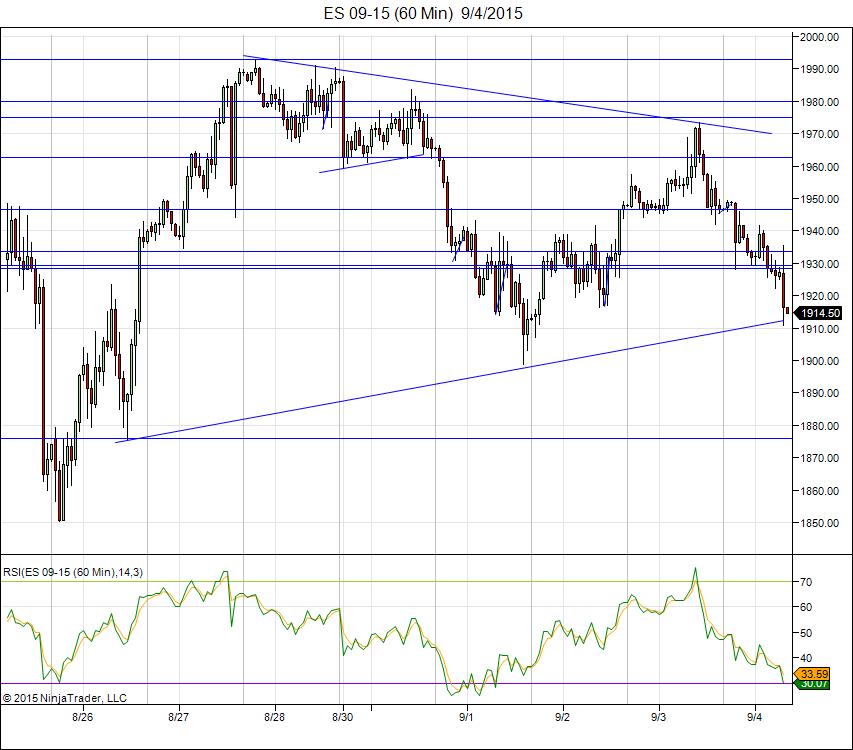
Here (above) is the ES (SP500 emini futures) at almost 8:30 AM EST. We’re at the bottom of the D wave. I would expect it to trace out the full triangle (the remaining E wave) and then turn down to complete the rest of the 5th wave.
Timing: We have until about the 9th (next Wednesday) to complete the fifth wave down. Then we turn positive for a good month. This seems to work perfectly to complete the 5th wave down. We’ll see. I’ll post again on the weekend. Here’s the pertinent timing chart below.
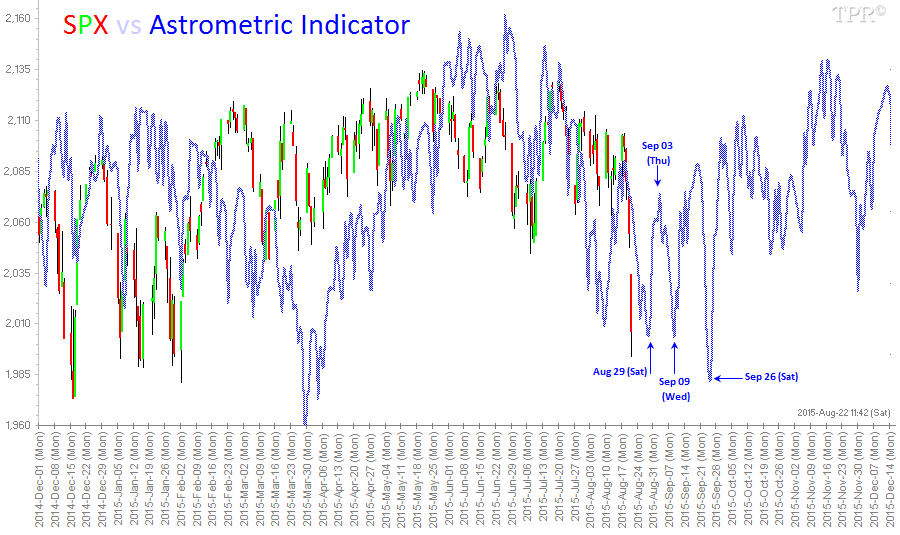
Above is today’s Astronomic Indictor chart, which shows going from positive yesterday to negative through Sept. 9. This is from Time-Price Research. I suggest you check out their most excellent website.
Update Noon EST Thursday, Sept. 3
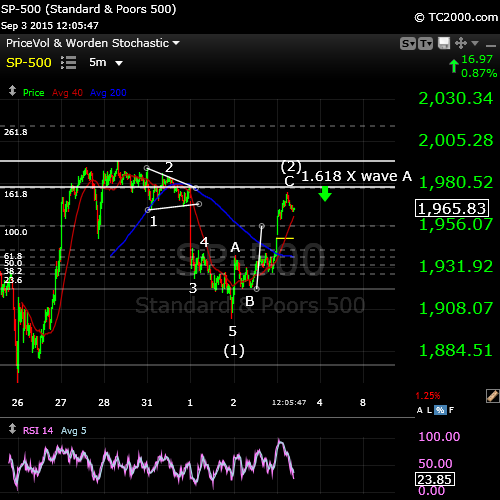
Welcome to a very tough market. Here’s the count to about now on the SP500. You can see the ABC correction almost at an end. I measure 1978 as wave C at just about 1.618 X wave A, which is a typical length for wave C and also aligns with a possible second wave point on the previous wave (1) down. By this count, we should turn down at 1978 approx.
Previous Post:
The little drop of rain we have overnight and today could turn into a monsoon very soon! Here is a Wednesday night update to last night’s post.
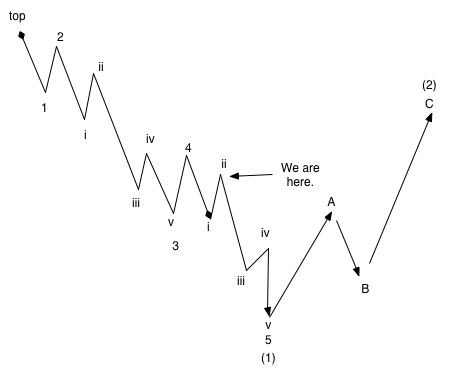
Our Current Position
Last night I explained that we would either retrace 38% of wave i (my preferred count) or we would rise a bit further to the 62% level (my alternate scenario). Now we know. It took all day to find out, though. We have finished wave i down and retracing wave ii to 62%. It could rise a bit higher … 62% is the minimum. However it can’t rise into the area of the fist wave (about 1965).
After we reach that point, the next move is down, but down in wave iii to an even lower level than last night’s preferred scenario. It will drop at least 1.6 times wave i. I have a target for the SP500 of 1815. It could drop even further.
The market was so weak on Tuesday that I’m surprised it had enough strength to reach the 62% level, but this market has been extremely devious even though its kept to the wave count.
There’s one chart tonight. It’s simply an updated chart from last night, showing the today’s update of the market and the revised target.
All the indices look the same.
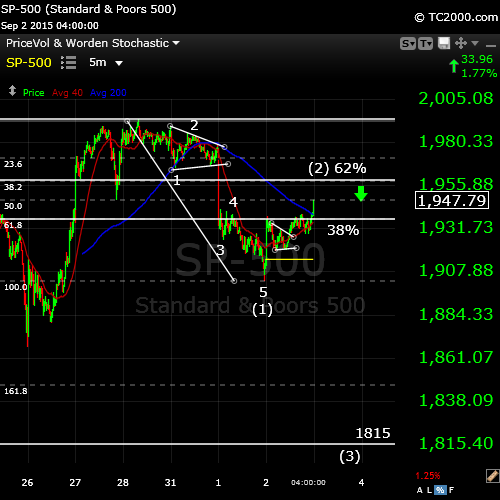
The SP500 has finished 5 waves down to complete wave (1). We’re now retracing 62% of the drop from about 1993. This will be wave (2) in the chart above.
Once this wave up is finished as per the diagram above (I expect tomorrow morning), we’ll start down in wave (3). So, still lots of downside to go and it should be dramatic. Wave (4), which will retrace just 38%, will follow wave (3).


Thank you Peter. Very clear. We must look to take out , in time , the previous lows .,
…….Nick
We’ll certainly do that … in wave 3 of 5 no doubt.
I am with you Peet!
Thanks for the post. 🙂
Cheers,
W
Good luck! I have a presentation to give so I’ll miss the open. Should be a good day.
I do not believe, we will be dropping very significantly over the next several days. Possibly late Thursday into Friday. If we do not get a severe drop by Friday, we may have to wait until the sept 21- 25th time frame. I have exited my long position from late yesterday. If we for some reason get up to the 1947 – 1949 spx level, I will exit my short position. I need to protect my profits from shorting at the 1983 spx level. I still believe Sept 10 -11 th will be some kind of high pivitol point in the markets before resuming down. Mr Market is certainly not going to make it easy for us. Good luck every one.
Wave 5 is so far playing out exactly how Peter has drawn it up on the board. Wave 3 went down so quickly within only 3 trading days. Wave 5 potentially might mirror that. The job report on Friday might be a catalyst.
Markets are showing so much weakness. I am holding my shorts at least until the end of the week.
Erick,
Looks like we’re finally heading for the 62% retrace … after a day of doing almost nothing – very exasperating, dangerous market. The good news is that once we hit the 62% level (I suspect in the morning), wave 3 is next and it will be at least 1.6 times the length of wave 1. I may post a target tonight.
Great thanks Peter. Ditto. 62% is what I am expecting as well.
Shorting hasn’t been easy… It is not supposed to…. However I am glad that we are very close to wrapping up subwave 2, getting ready for sub 3. I am still short, at least until the end of this week.
Thanks Peter. Your EW counts have been a great reference and guidance. It is the tool that I am most fascinating with, out of all the trading tools that I am using.
Hate shorting with a passion. This has been an extremely difficult market. I updated last night’s post https://worldcyclesinstitute.com/a-little-drop-of-rain/
I would expect we roll over first thing. Wave 3 should be dramatic.
I am thinking out loud right now guys, is it possible we are getting a LONG wave 4 and so we are still in the big wave 4 (B down right now and just ended b with the spike up at the end of the session)??? So, maybe wave 5 will start after 12 September?
Cheers,
W
No. We did 5 waves down in wave 1. It couldn’t be clearer. Wave 2 is next (we’re retracing tonight), then 3 down. I updated the post.
Thanks Peter,
I m curious what your update will look like 62% retrace is that about 1960?
Turbo cycles showed a bottom Sept 1 and a top Sept 18 a big retrace I guess about 2050-2070
Bradley shows a top in the graphic Sept 5 after that slowly turning down bottom in Okt around 7-9
Cheers..
I m awake again … thanks
Chinese market is closed Thurs and Friday.They will not be participating. I will find it difficult for the markets to have a severe dump with out their markets participating. For everybody’s sake here on this blog, I hope I will be wrong.I still have my long from late yesterday to hedge my shorts from 1983 SPX Good luck every one.
I re-bought a long position today spx 1922, not yesterday.
This I posted last weekend. So far so good.
“9/10 we have a natal heliocentric Venus conjunction. This is a magnet. The super full moon 8/30 will give an inversion (high). Strongest turndates 9/1, 9/4 and 9/9.
We are still down from 8/18. So I expect a low on Tuesday, then a retrace up into Friday (jobreport) and down again into 9/9. After that a longer retrace into autumn equinox.”
We’re going to roll over this morning. Futures are right up to their targets and have been almost all night.
we’ll see 😉
andré – Thank you.
Andre,
You think one more push higher into sept 4 Job report before turning into 9/9 ?
Tommorow is Mercury date?
Good luck
John.
If it happens in the next hour.
I will give you my credit Mercurius always bingo but can be a day earlier like the last one July 23 and the decline started July 21 so…
Well, I missed a clue. The wave we had down was in 3 waves. The lower half is overlapping and the top end is too large for the bottom. So we’re doing a double pronged second wave, by the looks of it … a typical setup for a large wave 3 down. We’re in the very last wave up, so we should be done very soon.
Or we are going to do a flat … to the top of the previous wave. I can’t tell at the moment.
Well, John,
You might end up being right. At the rate this thing is moving (not at all), it could take some time to top. We’re at the top, but just not moving. I posted a new chart..
I may hope that the rush UP ends here… What a strange market again, stupid QE!
Cheers,
W
What I just wrote to John: Well, I missed a clue. The wave we had down was in 3 waves. The lower half is overlapping and the top end is too large for the bottom. So we’re doing a double pronged second wave, by the looks of it … a typical setup for a large wave 3 down. We’re in the very last wave up, so we should be done very soon.
In the NQ, I’m looking for a double top here. Euro is also bottoming.
The NYSE has the clearest waves. We’re still in the C wave but at 1.618 X the A wave, it should end at 10,162—not very far away. Then we have to head south in either a 4th wave (if this is going to the top), or we head down into the third wave we’ve been waiting for. But so far, we’re 3 waves up.
On the SP500, that same turning point is about 1978.
I just posted a chart. https://worldcyclesinstitute.com/a-little-drop-of-rain/
We might have had a turn here. Watch for 3 waves up to 62% of this small first wave down. If we turn down from there, we’re into the third wave.
What is interesting that when the market goes down there is a dozen of fondamental reasons, you can chose which one you like. But when it goes up you should scramble the head
Check the most recent post for an update.
Peter, Is there a level on the way down that has low probability of being retraced after it’s broken in a 3rd wave that might make a good “sell stop” short entry.
Paul,
Yes. Always below the previous 4th wave (or 38% below the length of the full wave up). In other words, 62% from the bottom, 38% from the top. The previous fourth wave is where we would retrace to to do a 5th wave up, so once it breaks that level, a fifth wave stands a lot less chance of happening. Make sense?
What you really want to watch for, which I’m eyeballing right now, is a wave that comes down in 5 waves, which the current one might be doing, and then bounces in 3 waves up to 62% of that wave. Then turns down. That’s an EW top.
Let’s make it happen this time, hiha here we go! 🙂
Cheers to you Peet!
W
Well, remember, it has to turn at 62%.
Hi Peter,
Remember this bearmarket how to get bipolar disorder pffff.
http://www.elliottwave.com/images/marketwatch/0810EWTFig3.jpg
You can see the extremes of bear markets. That’s why they’re so difficult to trade. Thank central bankers and politicians, for the most part.
I think we have just seen Sept 12 in the chart LOL….
John,
With my site, because of the framework we’re using, it would take some code to connect to a plugin to allow images to be added to comments. So for the moment, that’s not likely in the cards.
Check an update to the post. https://worldcyclesinstitute.com/a-little-drop-of-rain/
Sold my longs earlier today. Buying longs again here 1947 or slightly below will exit longs. I am looking for a possibility of 2010 within the next few days to clear out the bears before resuming to the down side. Good luck every one
Sold half longs 2.5 spx loss, keeping the other half for tomorrow. I am still seeing higher highs here over the few days. Good luck to all.
andré
Do you see Sept 14th-15 as MAJOR cit days for a major bottom ?
Thank you advance.
This weekend I’ll update my outlook.
Cheers,
André
I’m relying on your projection to Sept 9. I posted a chart on the post update this morning, which outlines the same timing.
Peter, you’ve evoked a possibility that this move down may be the 4th wave of the corrective wave up. What is the invalidation point of this scenario?
Dmitri,
First off, this is the most difficult market I’ve ever traded in. Part of the reason is that some of the usual “markers” are missing. For example, I’m used to seeing double tops at the top of a second wave. There are none. Waves just turn on a dime. So I’m going to have to start counting waves, which is fine, but takes more time and focus.
Now to your question. Here’s what I think I’m seeing and why.
Wave two has ended – it went right to the measured objective short a couple of bucks. You can count 5 waves up in the C wave.
We’ve had a wave down (1) in what looks like 5 waves. Then we retraced to the previous 4th of that wave, and then we dropped and broke through the 38% retrace level. So that to me confirms we’re not going into wave 5. We also just completed a 3 wave subwave right at the end of the day in 3 waves, which to me suggests we’re starting the second half of the first wave down.
If that’s correct, the SP500 will now drop to 1930 to complete the full first wave down before bouncing in a second wave (62%). Then we’ll have the third wave down. That’s my preferred count based on what I’ve seen so far.
I also look at other assets. EUR/USD has bottomed and is starting to head up, which suggests the US market is going down.
Futures seem to be continuing down as I write this.
So, to be even clearer, I believe we’re halfway through the first wave of the third of the fifth. Then we’ll bounce in a second (62%). Then we’ll turn down in the third of the third. EWs are fractal, so each major wave down will have 5 waves within it. All countertrend waves will be in 3s and shortable. In any event, for the moment, the direction should be down.
Thanks, Peter,
up to now market follows you like a dog
haha … yeah, nice,eh?
ES looks like it will blast right through SP1930. Next stop would be SP1900. We might bounce on the labor report, as I’m still looking for a second wave of the third at some point.
Careful, we’re in a large 4th wave triangle. I added some charts to the most recent post. https://worldcyclesinstitute.com/a-little-drop-of-rain/
Planet Angle Lunar Seasonals (PALS)
Planets: bullish Venus post VIC, mercury swinging into conjunction
Lunar: phase distance and declination bullish next week.
Seasonals: bullish next week.
Summary: am leaping in faith long into SPX entered long Thursday late afternoon. Will stay long until either, Friday at close or I make 3 %, whichever comes first.
Friday at close is next Friday, not tomorrow.
Thank you for the update Valley. LOL I was feeling a little lonely here being long.
Well guys, somehow I have the feeling, as I said before, that something else is going on and this is not a real wave 5 down… However as said before, I am not the EW expert. 🙂
So I sold some shorts, and my positions is small short right now. I keep some puts, but I won’t be like ‘WHAAAAAATTTTTTT’ when we go hard up next week and it seems that we are in the big wave 2 to AEX 460-480 (S&P 2050?) already while now it looks like we are in wave 5 of the big wave 1 down.
Cheers to you all!
W
Wouter,
My measurements put an end to a first wave down somewhere in here and we have the labor report in a couple of hours, so being conservative might be a good idea. The lower waves look questionable here (they’re overlapping), although i don’t see anything that suggests a bottom.
I am looking at a possible triangle for both the NQ and ES on a 1 hour chart. It would have one more leg up.
You can also draw it on the 15 min SP chart, the DOW, and Nasdaq. So I’d say we’re in a fourth wave triangle (bearish) that will need one more leg up before it heads down. That’s why we’re seeing these waves in 3’s. I mentioned that I caught the bottom of the larger first wave down from two days ago as a 3 – had missed it at first.
It will mean that the fifth wave won’t be as long as it otherwise might have been, but we still need to go to new lows.
Wouter, I just added a couple of charts to the most recent post. https://worldcyclesinstitute.com/a-little-drop-of-rain/
Thanks Peet! 🙂
Cheers,
W
Thanks for the spark! I was sitting here thinking, “hey, there’s something wrong with this wave” and I had just backed out the chart to look when I got your comment.
I added an Astronomic chart for timing to the post.
This might be a help
I have the numbers that form the bradley siderograph..
This year the bradley is a great tool specially the period July 21 till now…
The numbers ( so the graphic) is pointing down till Sept 9 also…
Down from here I think. Looks like we might have put in wave 4 of the third wave. We should continue down …
Oops, didn’t see your post, Peter, and wrote the same
Once we drop over the lower trendline of the triangle I drew, that will negate the triangle idea. I still have a target for wave 3 of SP500 1830, which is 1.618 times the length of wave 1. It we start to bounce, although this market seems extremely weak, we still could complete the last wave up of the triangle.
Actually, my target for this wave should be about 1894, but I’ll explain in a post on the weekend.
It seems that the market has broken the forth wave triangle to the downside and is retesting it now from the low
My original triangle was a bit off and so I re-drew it and reposted it. I think we’re still in it, but we don’t have to drop much further to fall out of it and negate the idea of another leg up.
Interaction is the key right, not you just sharing. 😉
Well if ‘Black Monday’ comes again, I am ready with my shorts, still enough to make a good profit. 😉 Else, no problem, I wait for the up move to finish and add more cheaper puts. 🙂
Cheers all!
W
Interaction is the key right Peet, not you just sharing. 😉
Well if ‘Black Monday’ comes again, I am ready with my shorts, still enough to make a good profit. 😉 Else, no problem, I wait for the up move to finish and add more cheaper puts. 🙂
Cheers all!
W
Haha… well, I’m sharing again. Clear sailing til about 1894 in the SP. DOW broke the trendline. NYSE on it. SP next.
Wouter,
If you’re in futures, looking at the chart, it looks like they’ll do the last leg of the triangle after all.
The Nasdaq is also clearly in a 4th wave triangle on the 30 min chart.
Sorry, Peter,
didn’t see your post while taping
🙂 I was actually talking about wave 4 of the third wave, not the larger wave 4 triangle …
They are trying to take the Europe off the lows before the close
We should drop solidly now, except for a small fourth wave until about 1894.
Time to talk about where we are. In a sense, we’re just getting started.
We’re in wave (3), but we’re only in wave 1 of wave (3). We will likely finish wave 1 at the end of the day. Then (likely Sunday), we’ll bounce 62% of wave 1 in wave 2. Next, possibly Tuesday, we’ll head down in wave 3 of (3). (I’ll post a diagram on the weekend).
Wave 1 of (3) (the one we’re in) is typically the same length as the higher degree wave (1) of earlier this week. That’s one ending point to watch for (about 1890 in the SP). We very likely won’t get there.
Within wave 1 (the one we’re in now), wave v—where we currently are— can be the same length as wave i of this wave (about SP 1905), or it can be 1.618 as long (more usual).
So, for the SP500, the stopping point will be somewhere between SP 1905 and SP 1894. I would assume we’ll reach the bottom near the end of today’s session.
The key is to count 5 waves in this last wave, from about 1932. As I write this, it looks like we might we starting the fourth, which signals we’re getting close.
Could be an early bottom at SP1914. We stopped dead.
I believe the market is building tremendous amount of energy. Like an elastic band being stretched. When it lets go, some bears maybe disappointed going into late next week. For the bears, I hope I will be wrong. I am now layering the longs late in the trading day. % 50 of my capital. Will deploy the rest tuesday.
New post update. The path is very clear.
Hey Peet!
For the S&P, I look at the futures. For the AEX/DAX, I look at the cash Indices.
Now let’s see what happens on Monday. 🙂
Cheers,
W
Monday’s a holiday in the US, so I don’t expect all that much until Tuesday. The high of the triangle will need to register during the open session, I think.
Peter,
how is it clear for you that we should have one more leg up?
If you kept the original triangle from Friday morning you would see that the market has broken it to the low and has come to touch precisely its low border in the end of the day but failed to reintegrate it and abandoned much lower
Dmitri,
I don’t show any triangles in indices or futures that have broken trendlines, if the triangle is drawn properly. Sometimes, you have to redraw lines to ensure the look of a contracting triangle is balanced. I had drawn the first lower trendline from a lower small wave on the first leg A up as a “line in the sand” if you like, to give me an idea where the turn might be. However, it went just slightly lower, but is still a higher low than the B wave down, so the entire structure is still a triangle. It ended up stopping very much short of where it should have. Final fifth waves should be at least the same length as the first wave and are usually 1.618 times the length of the first wave. The wave stopped short and so I took another look and realized we were clearly still in the triangle pattern.
Also, the wave that came down is in three waves. There is no valid second wave within the structure of the wave down. I will do a chart on this on the weekend showing this. (Second waves must be close to a 62% retrace at the top of the wave.) All the waves of this pattern are in 3, if you look closely. Triangles always consist of waves in 3’s.
So, we still have a contracting triangle on all indices. As such, it needs an E wave up. If you look at the top chart in the post here, that I added at the end of the day, you’ll see the structure. A simple way of looking at is that there need to be three touch points at the top and two at the bottom.
So, the picture is that we go up on Sunday in the E wave and come down in a fifth wave on Tuesday. Very clear from an Elliott Wave perspective.
Thanks a lot, Peter, I appreciate your attitude to EW
Dmitri,
There’s a new post live and a more in-depth explanation of why the waves in the triangle are 3’s. You can also do your this exercise with the futures. They look the same.
Dmitri,
Even if Friday’s wave down was not part of a triangle and was a valid 5 waves down, it would now need to retrace 62% in a second wave. So either way, we’re going up, but it’s clearly a triangle and you’ll see why from a chart I’ll put up today … an EW lesson on triangles 🙂
Last week I said 9/4 would be a high. I still think 9/4 is a very powerful turnday. But Thursday we had a tidal inversion. This inversion created a high on Thursday and turned Friday into a downday. Now I expect the 9/4 high to be pushed into Monday. As it happens this weekend is heavy, so a low before and a high after is likely.
Europe is usually bulish with Wallstreet closed. So I expect Europe to make an upmove, probably into the end of the day, creating a gap up opening for Wallstreet on Tuesday. But Europe will start the down swing on Tuesday, so how big the gap will be is hard to tell.
And then the 9/9 low. Most powerfull turndays will be 9/11, 9/16 and 9/19-21. so after 9/9 up into 9/11 and down into 9/16. Whether this will be a higher or lower low is still an open question. Maybe I’ll be able to shed some more light tomorrow, when I have had more time for my research.
Andre thank you very much for sharing the information looking forward for more details and Peter thanks for all the short term updates it’s a lot of puzzling I wonder what you can show us?
I want to at this.
My gut feeling says we are in a consolidation period with a tendency for an upward movement starting from Sept 9 till Sept 16-18 after that we will get wild swings down
and and a confusing up till theend of the month and after that a nasty drop till Okt 9.
The big suprise will be Mercury retograde from Sept 16 till Okt 10
Good luck to all..
My old friend ( astrologer) told me Mercury rules about trade and human emotions It often leads to a Fall in the stockmarket and a buying opportunity sometimes the markets drop in the beginning or in the end of the period.
Not to worry. The remaining moves became exceptionally clear late Friday. The only thing that has changed is that we’re going to complete a contracting triangle before we plunge into wave 5. Wave 5s out of a triangle are referred to as a “thrust.” They can be relatively short in time, long in length, and dramatic. I would expect it to only take a few days to complete.
Then we start a long upward climb into the higher degree second wave that I show in the diagram above.
This is exactly the pattern that supports the remaining Elliott Wave moves. It’s all very clear.
Tidal inversions.
Every day we have 4 tides in most tidal stations. The daily movements are mainly driven by the moon and the rotation of earth. With just one moon and a steady rotation one would expect pretty straightforward movements. But some times we see strange things like something is interrupting the normal sequence of tides. Like another force is active.
Recently I found a new way to calculate inversions and – in all modesty – I am pretty pleased with the results. So I’ll give you the inversion dates for September and I would advise you to remember them. Dates for September :
9/1, 9/3, 9/7, 9/9, 9/11, 9/16, 9/19-20, 9/22, 9/28 and 9/30.
There is still much to research. Sometimes we see an inversion period, up to 7 days. But sometimes we see the inversion on one single day and it’s gone. I am inclined to think this also has meaning.
Anyway, keep a sharp eye on the days as I am certain the will all bring a change in trend.
Cheers,
André
I now see that on Thursday and Friday we have a heliocentric Grand Trine. Both Mars and Venus trine Saturn, that is in a tightening square to Jupiter (orb 0,4).
This is a very heavy configuration so one scenario would be that the decline continues into Friday or maybe even 9/16.
My lunar cycles indicate that we are down into early October, before we retrace into January 2016.
This would create some more room for the leg down that should start Tuesday.
The new post shows the dramatic path is store. Two days might be a little bit light to hit the bottom, but then again, the 5th wave in these scenarios is dramatic, so we’ll see what happens. https://worldcyclesinstitute.com/wrapping-it-up/
New post live.