Market Update for Friday, March 24, 2017
We’re at an inflection point this evening. Hopefully the next 24 hours will resolve the situation.
Market Update for March 24, 2017 |
_______________________________
Update: Wed., Mar 22, 9pm EST
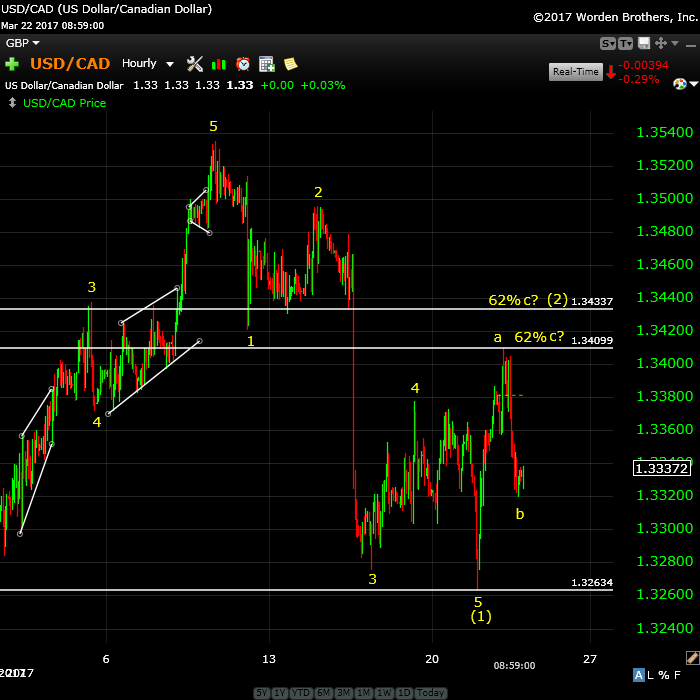
Above is the hourly chart of USDCAD tonight. I went back in after the video analysis and measured this additional option.
The 1.34 level that we’ve reached for a second wave retracement is the 62% measurement down from yellow 2 to 5 (at 1.32634). However, the way I’ve labelled the chart with the 5 waves down confirmation, the measurement should actually be from the very top. Now, being that we could be correcting a subset of 5 waves down, I’ll leave 1.34 as one of the retrace options.
The other option is that we’re going to retrace a little higher (to 1.34337). Either way, it looks now as if we only have the a wave up and a b wave down. I expect we’ll get the c wave tonight. This supports the rest of my analysis and doesn’t affect anything else.
Just wanted to make sure you have all of my thinking regarding this currency pair.
____________________
Market Update for Thursday, March 23, 2017
Market Update for March 23, 2017 |
_______________________________
Market Update for Wednesday, March 22, 2017
Market Update for March 22, 2017 |
_______________________________
Update: Tues, Mar. 21, Before the Open
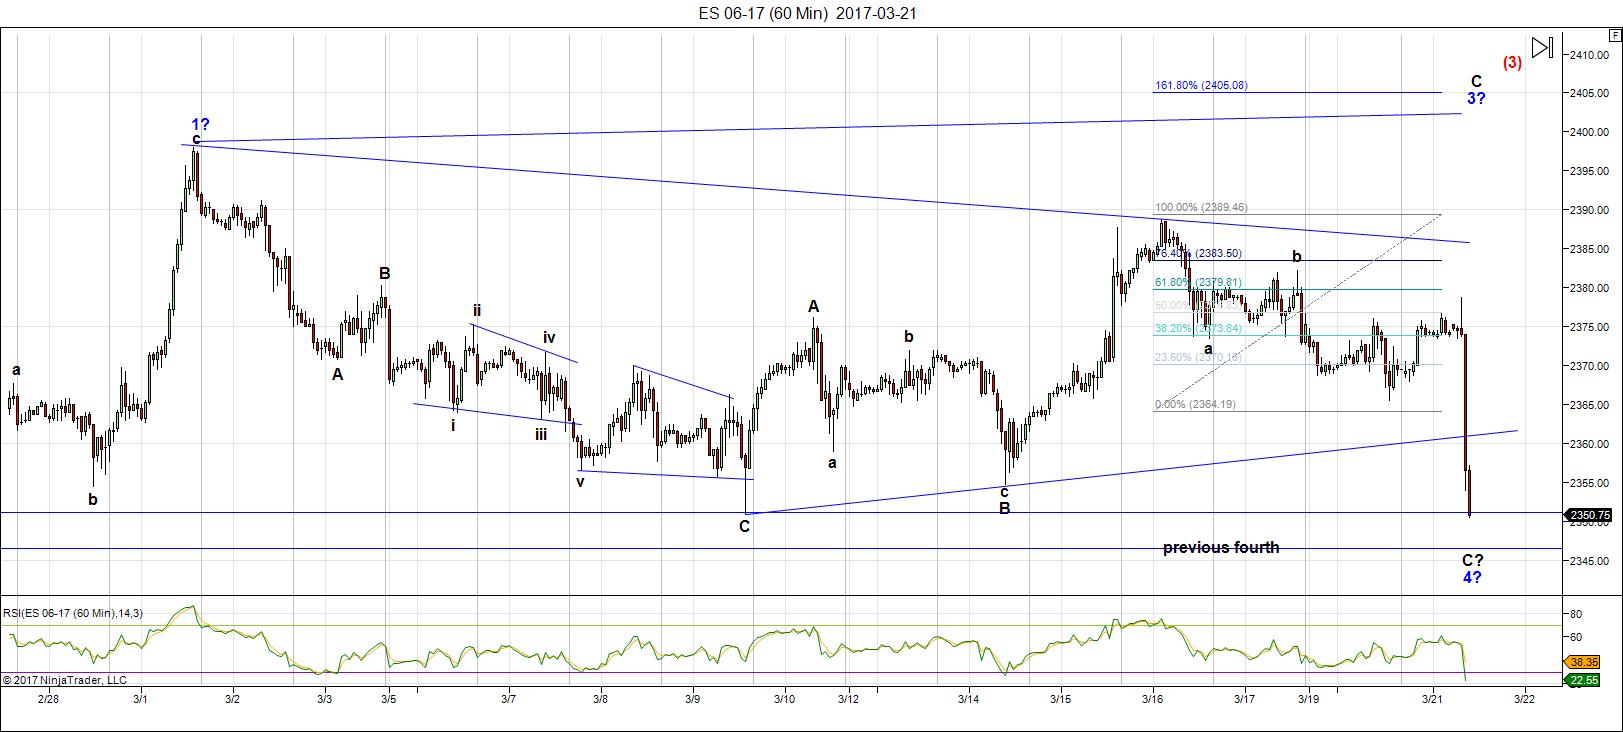
Revised: Above is the 60 minute chart of ES this morning. We had a bull trap this morning when the 5 wave move from last night went to a new high and created an additional wave. Down we came.
I put this as a probable 4th wave do-over. If it bottoms at 2346, that’s the previous fourth and will give us a double bottom. We would still need to finish this larger wave (3). If we go below 2346 to any great degree, that’s a different story.
Currency pairs have retraced slightly.
A somewhat unsettled market. However, if we get a retrace here across the board, we’ll be set up across the board for a large move to the upside.
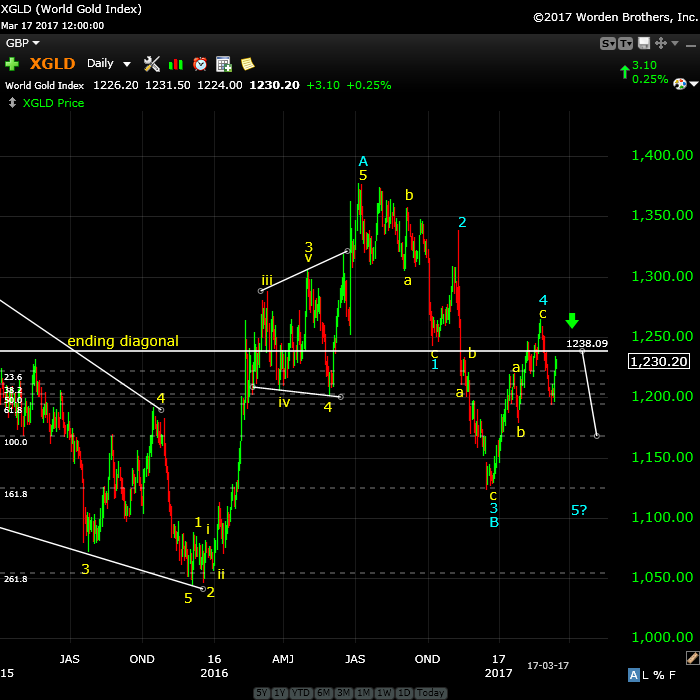
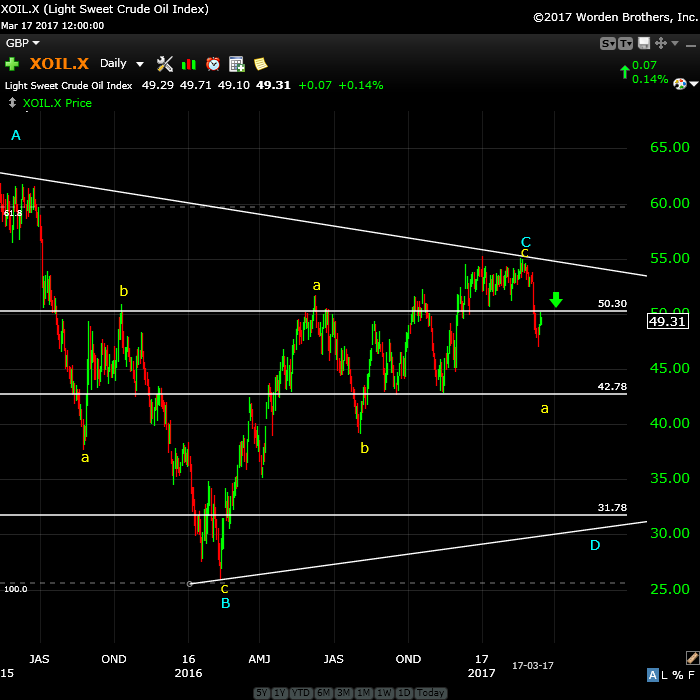
Oil and gold did as suggested last night – up a little higher and they are very close to a turn down.
_____________________
Market Update for Tuesday, March 21, 2017
Market Update for March 21, 2017 |
_______________________________
 In 1972, the American rock band, The Eagles, recorded the song Peaceful Easy Feeling (the latter link will take you to a recording of it). The lyrics having nothing to do with the market, but the song suddenly popped back into my head when I thought about this market.
We’re still at historic bullish psychological levels, which is an excellent predictor of a market top, although this coming top will be short-term. We still have one more wave down in the US indices (4) and one more wave up (5).
It’s a similar situation for the USD currency pairs. Everything is moving to towards a final top and turn at the same time, but the road may be quite dangerous until we get past the final fourth wave in the SP500. The depth of the fourth wave is not something I can predict, as the waves up appear corrective to me, and I put us in the final 5 waves of a zigzag.
What I mean by that is that while the C wave of a zigzag is in five waves, there are no rules as to the structure of those waves, nor their length. They can be what they want to be in terms of relative size. However, they will come down in an ABC configuration and the C wave will have a fibonacci relationship with the A wave. That should give us clear options for a bottom once the A wave in complete.
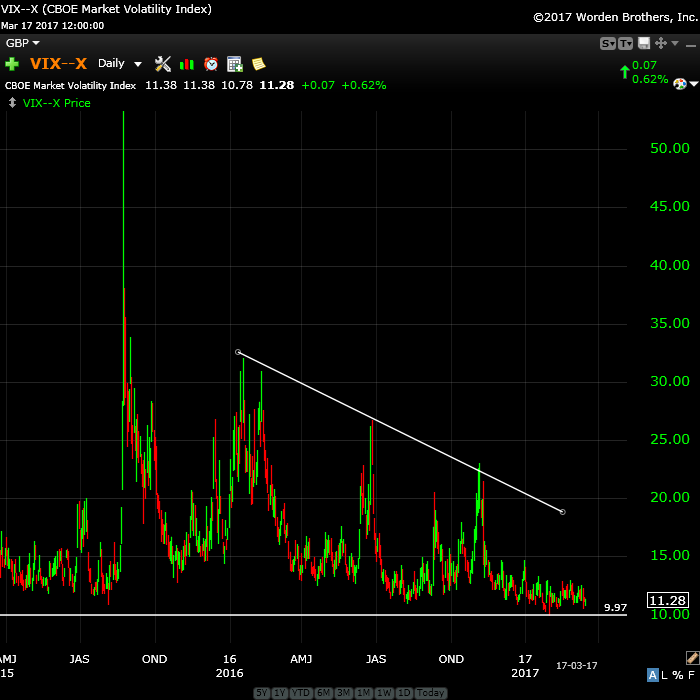
Above is the daily chart of the VIX, showing the high level of complacency in the market at the moment. Expect a spike up once we get to the top of wave 3, ready to drop into the larger wave 4. We’ve been going sideways for a while now and compressing into a small area. That usually means a very sharp reaction will soon be at hand.
How the relates to the market assets I follow is this: It looks to me as though EURUSD will finish a first wave up and that we may see a large wave drop in currencies that matches a drop in the US indices. The market is moving as one entity at the moment (there are some smaller discrepancies, but overall the moves are mostly in parallel) and so I expect this final set of waves to move in a slow “dance” to the final wave 3 top.
The wave down after the top may be sudden and it will definitely affect both the US market and the USD currency pairs.
A Dangerous Market at the Moment
The fact that the the US indices appear to be moving to a wave 3 high and are struggling to get there, combined with the fact that currencies are moving in tandem with them leads me to issue a big caution here.
We don’t have a really well-formed first wave in 5 waves in any of the currency pairs yet. In Elliottwave, a wave in five waves confirms a new trend. However, the first wave up in EURUSD was “iffy,” as is the wave down in the US dollar. They could completely retrace at this point to test the previous lows.
My fear is that when we reach the top of wave 3 in the US market, we could get a fast-moving, reactionary wave down on news and we may see the same thing is the USD currency pairs.
Keep stops tight. Once we confirm wave 4 in the US market complete, we will have a much better handle on the final market move (wave 5 in the US currencies and the final C wave in currencies). Until then, we have a potentially dangerous situation unfolding here.
The Longer Term Picture
This weekend, I took many hours to review the market and in particular a look at longer term projections, with measurements of all the key indices and currencies. I hope to be adding a longer term prediction video to the post this week, once we see the next move in currencies.
As you know, I’ve mused that we’ll either top in June or September. I think I have a clearer answer now as to what the time frame may be.
______________________________
Here’s the latest daily chart of ES (emini futures)
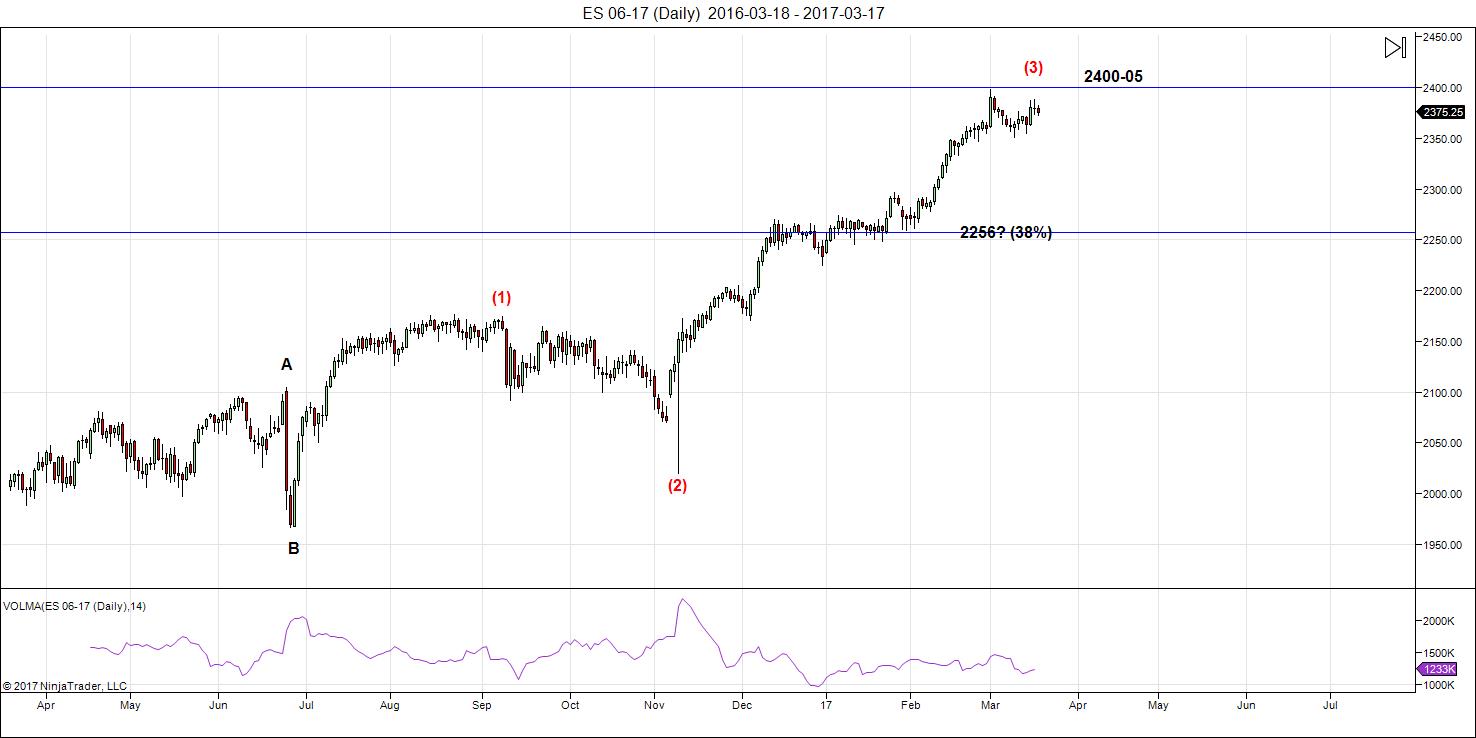
Above is the daily chart of ES. Nothing new here. The full wave up looks to be like a triple three (a combination wave) which is almost at completion (or will be with one small final wave up to about 2406—shown in the hourly chart below).
The larger 4th wave (after the top of 3 this week) will come down in three waves. After we finish the A and B waves, we should be able to project an end to the C wave of the 4th wave. Once we finish the fourth wave , we’ll get a final blow-off wave. I’m making a point of not projecting a final date for a top because the volume is so low, the markets are so erratic, and they’re moving so slowly.
Here are the path predictions going forward:
- Wave 4 will come down in 3 waves with any of the corrective patterns possibly in play.
- Wave 5 is likely to be an ending diagonal. In any event, it will be in 5 waves (not motive).
Summary: We’re at the top of wave 3 of the final larger 5 wave pattern, getting close to a turn-down into four with one more very small wave up to a new high. I expect all major US indices to turn this week. The larger wave 4 should come down in 3 waves (an ABC configuration to the target).
After completing the fourth wave, we’ll have one more wave to go, which could be an ending diagonal as a fifth wave. The long awaited bear market is getting closer.
_______________________
Here’s the latest HOURLY chart of ES (emini futures):
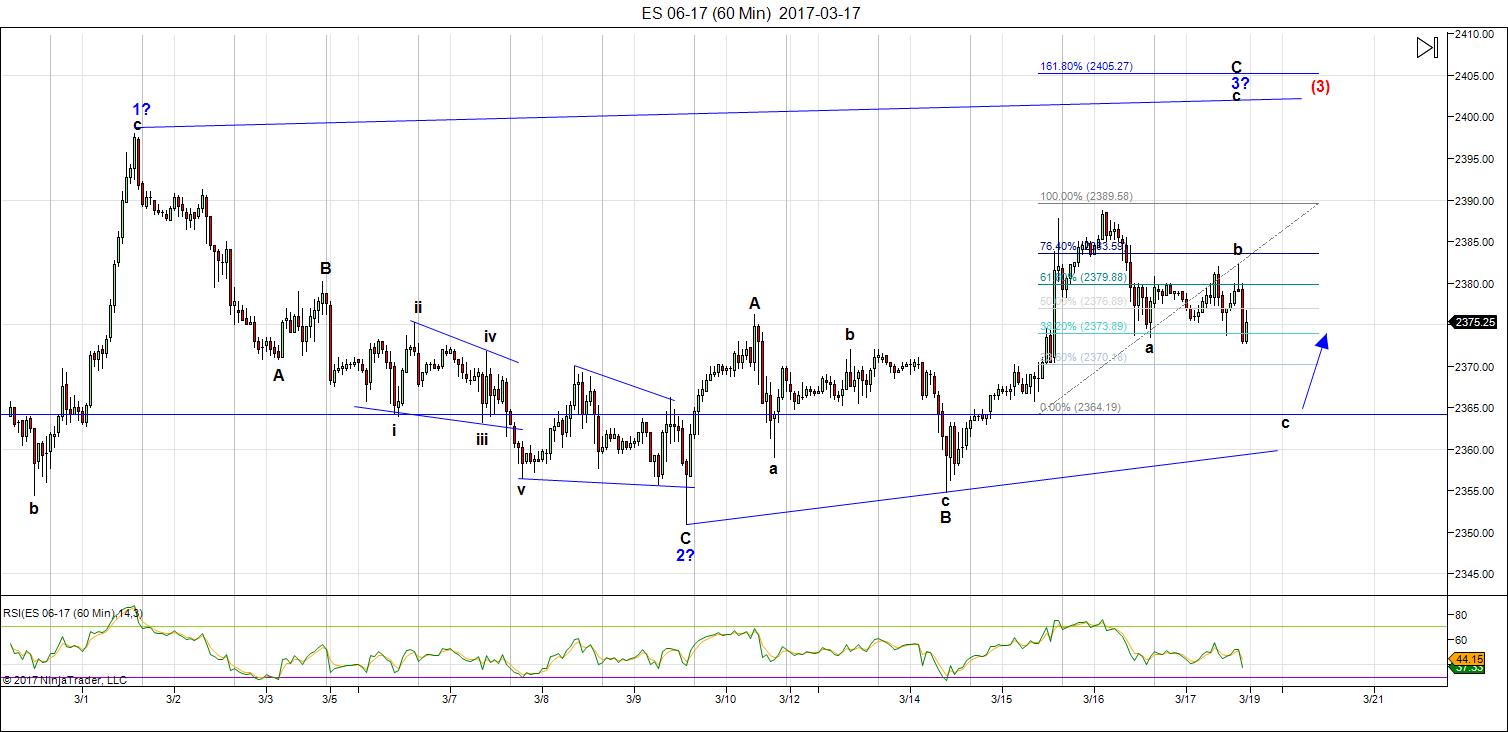
Above is the 60 minute chart of ES. Please watch the video to get the full story on what’s happening short term.
On Thursday, the market came down in 5 waves (shown by the “a” wave), which may suggest the first part of a flat, which will head down to a new low. However, this is my lower probability alternate count.
The higher probability is that we’re completing a zigzag which should drop to 2364 before turning back up again. We do not want to be below 2364 (shown by the letter “c”), or it’s likely the alternate count is in play.
As far as the bigger picture goes, it looks to me like we’re in wave 3 of an ending diagonal. This means we have a longer grind still to go to reach a new high in wave 3 of the ending diagonal, followed by a small wave 4 down and a then a final new high in wave 5. The top of this wave 5 would be the final top of the larger wave 3, which would finally bring us the larger fourth wave down.
_____________________________
Some housekeeping:
Andy Pancholi Turn Dates (March, 2017)
- SP500: M13, F17, Tu28/W29
- EURUSD: Tu21/W22
New Free Blog Post: We’ve Been Here Before
The Chart Show sign up is live for Thursday, March 23. You can sign up now in the usual spot: Webinars
________________________
Here’s a video overview of the market for Monday, March 20, 2017
Market Report for March 20,2017 |
_______________________________
Charts Going into Monday
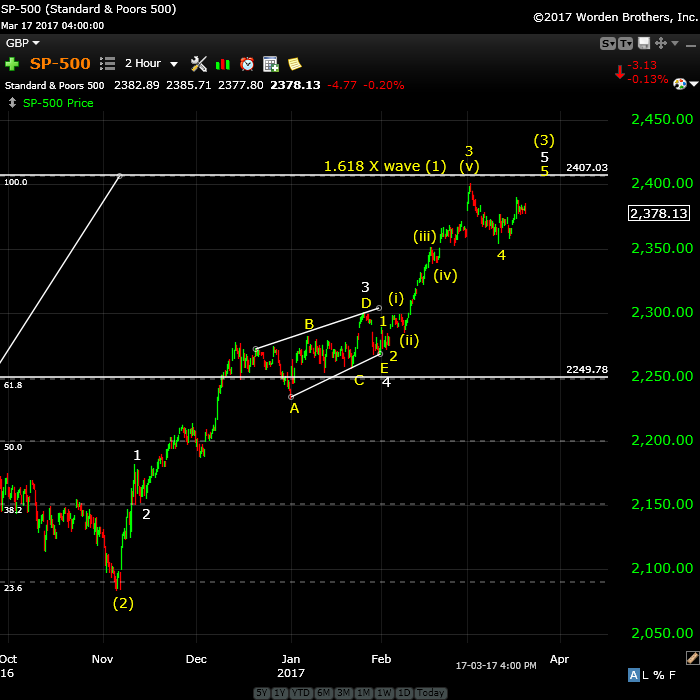
Above is the 2 hour chart of SP500. There is one more subwave up, a “5th of a 5th” still to go before this wave tops out and heads down in a larger fourth wave.
As with ES, there’s an alternate, low probability count that could see a flat and start of a fourth wave down, but my main count takes us to a new high instead. More on this in the video.
My projected top here is 2407, but we could extend slightly. It may take a while yet to get there.
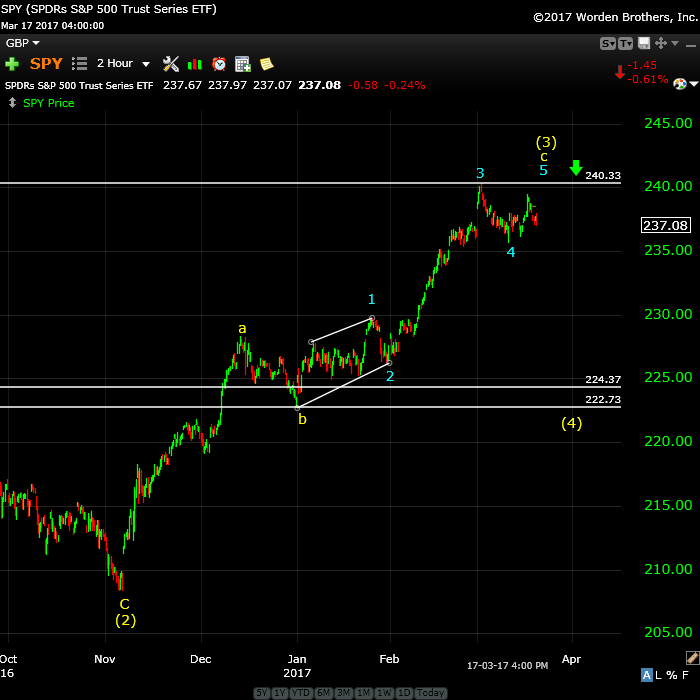
Above is the 2 hour chart of SPY showing a simple abc wave up. I’ve changed the count for the final subwave to show that between SPY and SPX, there are a couple of ways to count this last segment, both with the same outcome. My measurements for the final blue wave 5 place the top of the third wave at 240.33, so with a fifth wave, we may exceed that number. The bottom line is that we need to reach a new high.
If this final wave up is the same length as the first wave of the fifth (a typical ratio), then we should see a top at about 242.60. The targets for the bottom of the fourth are preliminary and represent a range: 222.73 – 224.37.
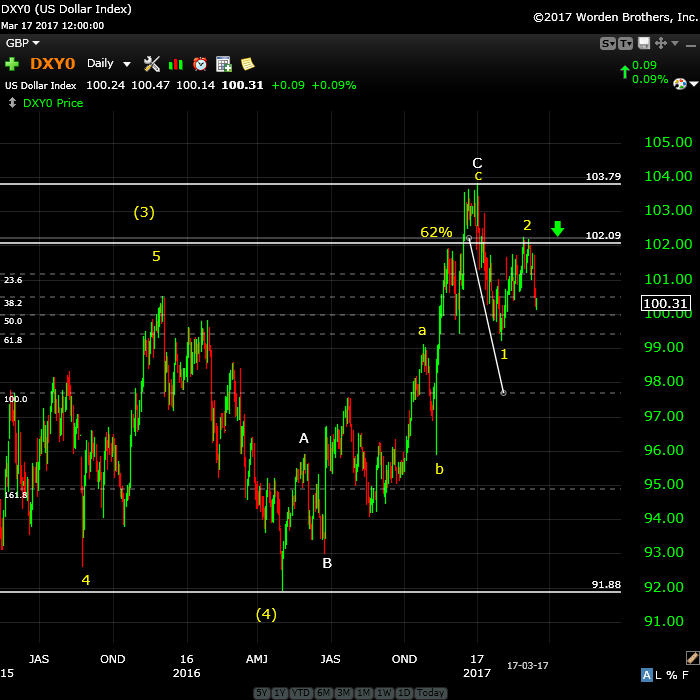
Above is the daily chart of the US Dollar. No change here in terms of my prediction.
On a near term timeline, wave 2 may be complete. We’ve had a large turn down, although, with a 4th wave expected in the US indices, at some point, I’m expecting a retrace up, to what level, not sure.
A 1.618 X the first wave, the target for this third wave is somewhere close to 94.83. The movement of the dollar determines to movement of just about everything else these days. The longer term target for this wave down is 91.88.
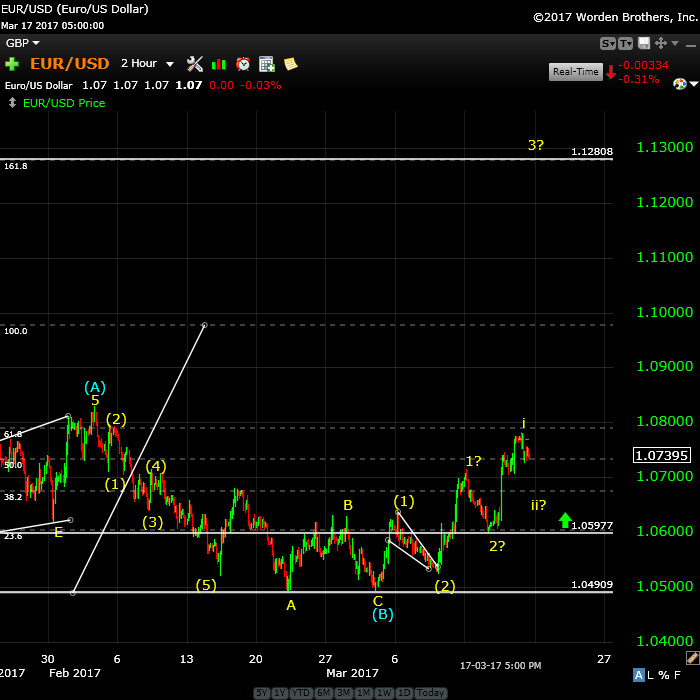
Above is the 2 hour chart of EURUSD. The bigger picture is that we’re headed up towards a target of 1.13 before we get a major turn down. More in the video.
The wave up looks motive, but very choppy, with lots of subwaves. My ultimate target has now changed: it’s around 1.18, which would match the retrace of the US dollar.
This puts the EURUSD in its final wave. The other currency pairs are tentatively in their final waves. More on that in the video. We’re looking for confirmation in other currencies, which would come from smaller second waves.
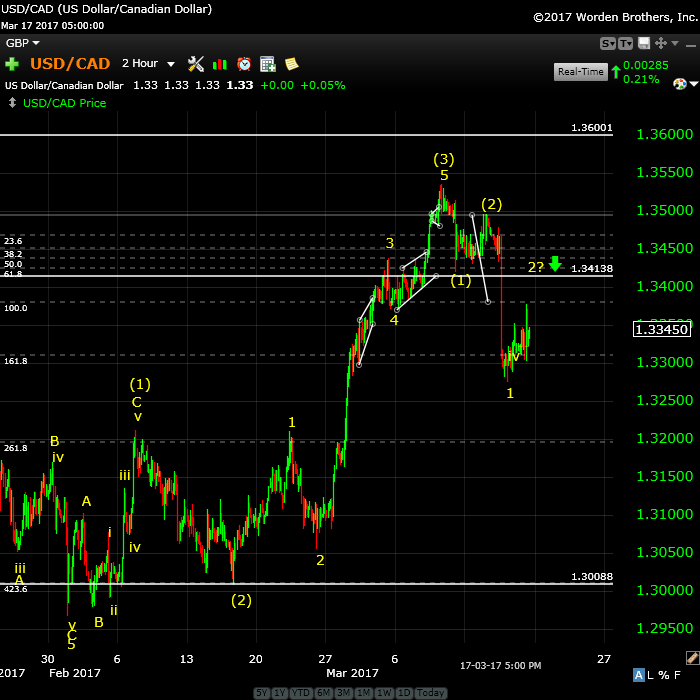
Above is the 2 hour chart of USDCAD.
Because of the level of retracement (above the 76% level at about 1.3355), I had expected a drop to the previous fourth wave and then a fifth wave to the top. However, the wave down has dropped below the previous 4th and looks quite motive, so I’m more inclined to believe we have topped and are now in the final wave down to an eventual target of 1.19.
The next couple of days will be crucial. I’m expecting further upside to the 1.34138 area before a more substantial turndown to a target in the 1.3 range. We do not want to be above the 1.34138 area (horizontal line, which is also a 62% retrace level) or it may mean we are indeed heading back to the top.
This move will most likely coincide with the move in ES. If ES turns back up after the expected zigzag, then USDCAD should also turn down and we should be able to confirm the longer term directions of both.
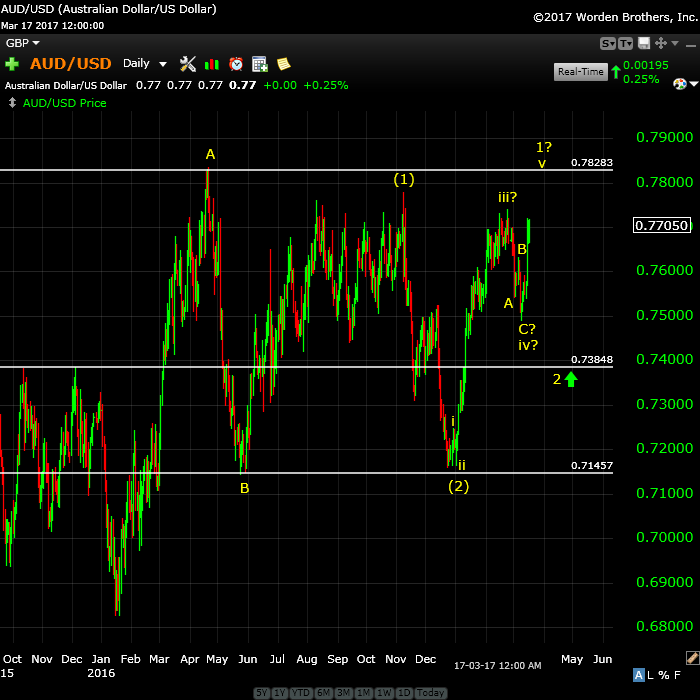
Above is the daily chart of the AUDUSD. This is the bigger picture to my short term projection in the video. No change here.
I’ve an eventual top target of .828 for this pair, which is just shy of the 38% retracement level of the entire larger wave down (from the year 2011), which would make this wave 4.
In the shorter term, we look to be completing a fifth wave up in this pair. A measured objective would be the horizontal line at .78283. I am still looking for a 62% retrace in a second wave and this may coincide with wave 4 down in the US market.
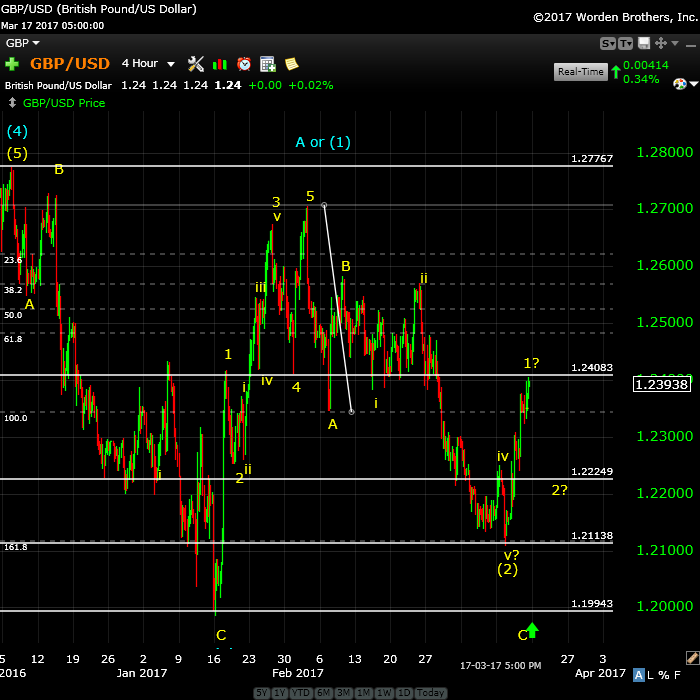
Above is the 4 hour chart of GBPUSD. I started to move to the fence on this pair during week this past week. Like USDCAD and AUDUSD, this pair had a strong turn and the wave here looks motive.
However, it’s early and we haven’t hit a previous fourth wave on the upside, which would be one of the markers I’d be looking for to confirm a turn. The other marker is a 62% retrace in a second wave, which we could get over the next couple of days as the other pairs complete corrective moves.
I can justify the turn up with the previous wave structure down, which is a wave in 5 (the C wave of a zigzag and the fibonacci stopping point), but the retrace was so deep that one would expect to test the previous bottom, which I have noted did not technically complete. So there are a lot of “ifs” right now in the structure of this currency pair.
More information on the short term prognosis in the video.
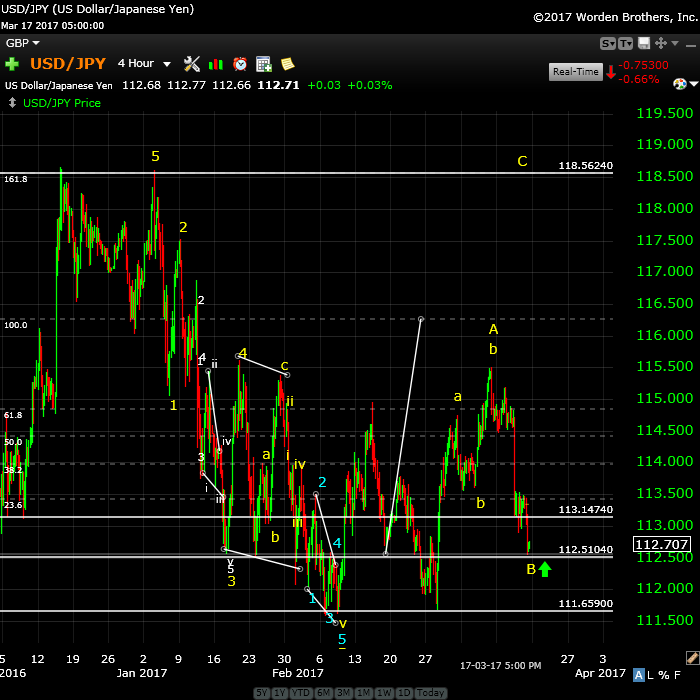
Above is the 4 hour chart of USDJPY. No change here. We’re in a corrective pattern down and I’m expecting another correction up now to a target of about 118.63 (a double top).
If the current wave drops below 112, 51, then we’ll likely text the previous low again at 111.66. However, if we turn at from 111.51 (the current level), the C wave up is exactly 1.618 X the yellow A wave up.
Opportunity! Above is the daily chart of gold. We’ve completed A wave up, but it looks to me as if it’s a wave four. It looks corrective.
I’ve been calling for a double bottom for gold and this is still my preference. The wave up in silver appears even more corrective and they tend to follow each other. The alternative would be a drop down to the 62% area around 1176 or so, but I prefer the double bottom at about 1122.
In the short term, expect a turn up, very possibly at current levels. We need to see a B wave that approaches a 62% retrace. The height of the B wave will give us a fairly accurate length of the C wave. With the strong drop in the A wave, it bolsters my prediction for an eventual double bottom.
The final upside target is around 1585.
Opportunity close! Above is the daily chart of WTI oil. We dropped like a rock from the sideways action that went on forever. I had been calling for a top.
My measurements and the underlying wave structure are suggesting this wave down will be in 5 waves (the first part of an eventual zigzag. In that case, I’m projecting a turn up here to about 50.64 (a small 4th wave), then a turn back down to about 43.00. That should end the A wave.
Then, I’d expect a turn up in a B wave to somewhere around 51.50 before a turn down in a C wave to our preliminary target of 33.00.
Finally, we should get an E wave up to the upper trendline to complete the larger pattern. That would be followed by a final 5th wave down to a new all time low.
Good trading!
_______________________




Excellent! It looks like we are getting some action in most markets.
Hi Peter,
Just want to confirm your count.
ES in suppose to reach 2405 in which it will complete wave 3 of 3 followed by a swift w4 down (may I know what is your projection of minimum of this wave 4)
and a wave 5 up to complete wave 3 which is the top of 3.
Then followed by wave 4 and wave 5 to complete the full wave of V.
Then as you say probably in Sep or later in the year .
Thank you
Vince
Vince,
Keep in mind that the fourth wave defines an ending diagonal, so I’m extremely early in calling one. I do not know what the length of the fourth wave will be and the rest is really dependent on this ending diagonal playing out. But essentially what you describe is what I envision at this point.
https://worldcyclesinstitute.com/trader-resources/trader-ending-diagonal/
ES: The flat option is dead. This looks like a triple three (zigzags) and so the downside target remains 2364. All currency pairs doing much as expected.
Not much happening with gold, silver or oil at the moment.
I was interested in getting into USD/JPY. It broke the 112.51 point this am. Not by much by still went through. Do you think its going down for a triple bottom? Is this a good point to get in around 112.5 or recent low 112.46 or so?
I have a stop sitting at the low of 112.46 or so.
USDCAD in a triangle and I’m expecting a rise still to around 1.34.
The report is going to be very late tonight. I’ve spent the last 5 hours on a technical problem. Fixed now, but I have to redo my analysis as the market has moved.
The Market Update for Tuesday is live a the top of the post. Sorry for the delay.
I posted a chart of ES this morning and some comments on just about everything else. It continued to be an active night.
I personally think this is a bull trap in ES, but we’ll have to see how it plays out. There are now too many waves in ES, so we either go up or down to a new low.
Nice. Not a market you’d want to take home to meet the parents.
While the bull trap was correct in ES, this is a really unsettled market and a dangerous one. I want to see the next move to get a better understanding for where we’re going shorter term. Nothing particularly conclusive.
And here comes the correction in currencies. All slightly out of sync.
I think the US indices are redefining the smaller fourth wave. I don’t see this as the larger fourth but we’ll have some more downside.
Only after ES gets below 2346 would we be able to entertain a larger fourth.
I’ve update a chart of ES at the top of the post and my comments.
I am seeing what looks like an almost complete 5 waves down for ES so we may well get a bottom at 2346.
Looking like we finally have the 4th of the 3rd in SPX. Couldn’t that get as low as 2325 before we get the 5th up in 3 to the new high?
The 38% retrace of the entire final wave up in 3 would be 2333. which is also a previous 4th wave, so that’s a likely stopping point.
And probably a good spot to go long IMO
What do you make of the gbp/usd now it has had a huge rally?
No change from last night, actually. I want to see it get to a previous high, like at least 1.25695, and then do a second wave retrace. The current 5th wave up (what it looks like) has further to go yet, imo.
Wait so you don’t think it’s going to do a double bottom?
I went neutral on the weekend. You can look at the GBPUSD chart where I’m looking at the bottom as a possible second wave, but it’s early to call a bottom without a full wave 1 up, which we don’t yet have.
The Market Update for Wednesday is live at the top of the chart.
We may get turns tonight. ES looks like an ending diagonal is near completion, as does USDCAD. AUDUSD has retraced 38% of the larger move up, which suggests a fourth wave with a turn into a fifth up to a new high.
Another active night, so far.
For CAD what the entry point after it peaks out since we went through 1.3376 and appears to be climbing. 5 waves down 3 waves up retrace of 62%?
My preference is still 1.34 or a little north. Then I’d be looking for a double top, then yes, a lower high … about 62% on any timeframe. The higher, the longer the drop. 1.34 would give us a second wave and lead to the middle of a third probably.
We’re still in a large first wave, so it’s a little bit of guesswork until we get one wave down complete.
1.343 is 62% from the very top. It depends on what wave(s) this is correcting and it’s not immediately obvious to me.
Measuring, this is wave 4 we’re in of the C wave. That being the case, the fifth wave measures to 1.34, so I’d watch that area.
thx 1.34 or so
Looking at USDCAD, the number should be 1.3405 and that should be pretty solid.
AUDUSD may have traced out a second wave by open.
ES should head up. I would now be looking for 5 waves up, since we’ve “zeroed” out the mess we were working with before.
EURUSD also doing a long-awaited retrace and may also be ready for an entry by the open.
Wave 3 extended so we may go a bit higher. We’re starting 5 of 5. It could get as high as 1.342. then it’s down to about 1.3. A big drop.
You called it again. Let me know when I should get in on CAD.
Any thoughts on cad? Still thinking 5 wave or should I get in?
Oh, still not in? I think we’re going to retrace 62% shortly, so I’d wait for that. We had one wave down and this second one is 1.618 X the length of the first and looks complete to me. So a retrace and then a much longer wave down, I think.
If I’m correct in where we are in CAD, I would target 1.338 for a turn down. For that to happen, I also expect ES to retrace about 62% here.
Well, I got the sell off in ES, but CAD hasn’t moved, so I think we’ll keep heading down. CAD is a little difficult to call at the moment (subwaves), but a new low is an optional entry. At some point, we’ll get a larger retrace.
Hope you got in OK, because we have a long way down to go. The 1.34 turn confirmed wave one complete, so we’re on the way …
Actually, I’m in the midst of my analysis. I’m going to issue a word of caution about everything. CAD may actually have to top more conclusively, so you may be right. We could go either way, at the moment, I think.
SPX is finishing up an ending diagonal this morning and once it turns up, we’ll start heading back up to the top. All the currency pairs, by the looks of it will also turn in the opposite direction.
USDJPY is the exception to the turn. It’s now down below the 38% retrace level and I have to change my call. It’s most likely going to go straight down from here to the final target at around 91.75. This wave down looks motive. At some point (perhaps close to 109.00, there should be a retrace.
Peter,
On the theory that all markets move together (more or less), do your comments on the Yen have any implications or concerns for the immediate future of the US Indexes (ES) perhaps having another leg down rather than a bounce back to the top? Thanks,
Steve
USDJPY usually moves separately from the other USD currency pairs, because it has the yen component, so no. I always look at it separately and it was based solely on the wave structure. That original wave down still baffles me, because the waves are all overlapping, so I would have made the same call now.
However, to your question, USDYEN is a separate animal from the other USD currency pairs.
I’ve gone short the yen to hedge my longs now. I still think it could head to 118 as this could be an overshoot which requires a sharp reversal soon to confirm. lets see what happens.
Yes, it could, although this wave down looks motive. This market is getting very volatile and a bit more dangerous. Good luck. (I haven’t looked to see what the yen itself is doing, but if the USD dollar keeps heading down, the USDJPY is likely to do the same).
There goes ES. There should be a 62% retrace perhaps very soon, to allow for an entry.
2336.50 or thereabouts would be the 62% retrace for ES to go long.
Jeez… this market! ES only retraced 38% and if off on a tear! Well the dollar is in a third wave, so I guess we’ll have to attribute it to that. It is rare to get these short retraces (AUDUSD looks to be doing much the same for the second time in a row, so while it will head up, it’s questionable as to whether it retraced a second wave or a fourth).
It’s a really difficult market, so be careful.
Looking at the bigger picture for CAD, I have a downside target of 1.29844 for this wave. I put us in wave 3. That suggests the other pairs will continue up (exception: USDJPY).
ES continues to look very bullish.
The Market Update for Thursday is live at the top of the post. A caution for tonight in that I think most assets are going to retrace tonight.
I’ve place a chart of USDCAD at the top of the post with an additional retrace option. About 9pm EST.
Thanks for the update Peter. I guess I will get in closer to the top.
I was just looking at the chart of the dollar and it’s done 5 waves down of the third wave and so I would expect a partial retracement up, which also supports my analysis tonight. That suggests a retrace of currencies.
You’d think having everything moving in parallel would make things easier, but not necessarily the case … (sigh)
There are ominous signs in the market today. A lot changed overnight. It’s also a major turn date in everything today (gold, silver, oil, currencies) except the SP500.
Be in the chart show, if you can make it.
CAD still heading up to 1.341/3 or so?
dunno. major inflection point … still working on it.
I think we’re going to head into the larger wave 4 (if we break the low in ES, yes) and if so, USDCAD will head up to the target.
Looks like CAD and ES are out of sync again. Both heading up at same time. Crazy market.
Because of the action overnight, my bias is now to the upside on ES. However ES still has to bottom. We may still get a fifth wave to a new high before a fourth wave crash.
Volume in ES is so light that it reacts to anything on a short-term scale. However, it has to follow EW rules. My count (if correct) still calls for a fifth wave top of larger third. My count is wrong is we head down here. So that’s pretty much the issue for me. And that has to do with the three wave move at the top of the third wave.
The current position of ES is, as I said last night, non-committal except that it has to bottom due to the corrective “4th wave” up. It is indeed a crazy market.
Currencies are moving as predicted, it seems. ES/SPX is the wild card.
ES/SPX: If we drop below the current low at 2332 in ES, we’ll be in the larger fourth wave. There’s a good chance that’s going to happen.
I’m confused: we never had the 5th of 3 to a new high so how would it be possible to be in the larger fourth? Would that mean a truncation? Skip the 5th wave and go straight to the 4th wave?
The waves up today are corrective and need to come down to the low in both ES and SPX. The low, at least, and perhaps much lower..
The Chart Show Playback is live at: https://worldcyclesinstitute.com/march-23-2017/
Tonight’s video is taking an incredibly long time to upload and I don’t know why.
Finally … the Market Update for Friday is live at the top of the post. I’ve never seen Youtube run so slowly …
A new post is live at: https://worldcyclesinstitute.com/mixed-messages/