
This week, we should see the top of the 500 year bull rally. Sentiment is at 93% bulls, which is rivalling the top of the dotcom bubble. All the assets I cover are at major inflection points. The dollar is about to turn or has turned. Oil is about the top. Gold is headed down.
Oops! Tesla
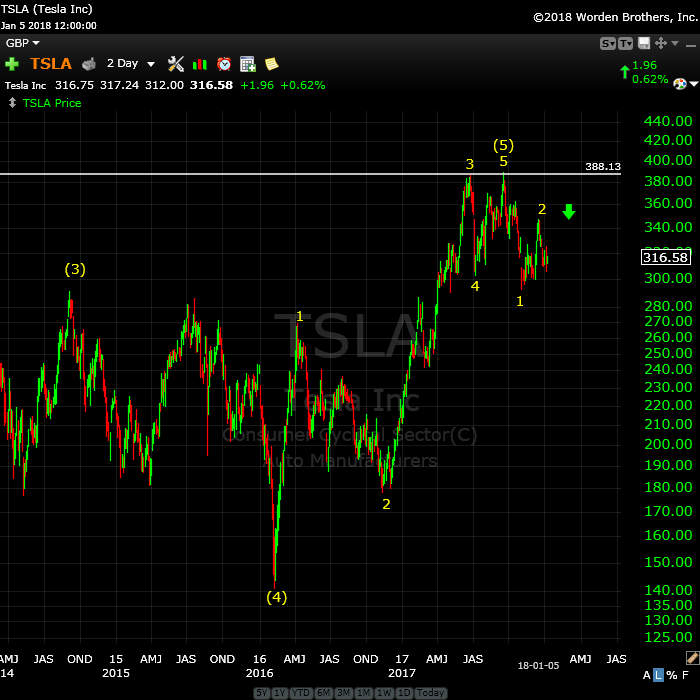
Above is the 2 day chart of Tesla.
Time to think about bidding “adieu” to Elon. Things have not been going well lately, and they’re about to get a whole lost worse.
Tesla has topped. It’s completed one wave down, along with a second wave. It’s now arguably in a third wave (arguably, because often in bear markets, you get a double-pronged second wave. So we may head about up to 347.44 for a final kiss good-bye!!
__________________________
My Original Intent in Starting This Blog
When I began this free blog, it was for the purpose of helping people understand the power of Elliott Wave Theory to lower risk in trading any market, based up its ability to predict market movement to a higher degree than any other tool that I’ve been able to find. I believe that Ralph Elliott discovered the secret to the market that it takes an astute analyst to unlock.
I believe it should be classified as a science because in the tens of thousands of hours that I’ve spent studying it, I haven’t found it to fail. The analyst can fail in interpreting the signals, but the science remains accurate, churning out wave after wave, day after day, to a specific set of rules.
In all my writing over the past two years, the hours I spend on analysis each weekend, and my attention to detail in explaining these charts and market direction each and every week, I have failed to make a dent in the perception of Elliott’s very important work.
I’ve tried very hard and failed. So, I’ll shut down the comments area next weekend, unless someone can come up with a benefit to keeping it alive from an educational perspective. I’ll explain my position in more depth below.
I’m also providing a list an explanation of some of the inadequacies and errors I’ve discovered in the “Elliott Wave Principle” book, by Prechter and Frost.
Other People’s Kids
In my endeavour to create a constructive environment to discuss EW and cycles, I’ve had to act a policeman for internal fights, spreading of proprietary information, and spreading of misinformation about Elliott Wave. It’s this last aspect that I vehemently object to. Mr. Elliott has been slammed enough and it’s kinda hard for him to defend himself in his current condition.
So, this week, we have Dan charging on here believing he has the right to command the audience I’ve built with his predictions that are neither possible, nor backed up by any evidence whatsoever. While I’ve written extensively about this wave up from 2009 being corrective, and the fact that one has to look at the market as a whole to determine its direction, he’s stolen the narrative with one single, completely unsupported comment.
Others have decided that this opinion is worthy of consideration, if fact, perhaps the operative scenario. It flies in the face of everything I’ve posted to the contrary over the past couple of years.
The inference is that I’m either stupid, incompetent, or have little to no understanding of the finer aspects of Mr. Elliott’s work. Maybe that’s true. But at the very least, it’s extremely rude. It shows no regard for me and my work, and without a shred of evidence to back up these statements, or even the a suggestion that these little morsels may be opinion only, borders on maliciousness.
I’ve had enough.
The challenge I’ve had in spreading the EW “word,” of course, is the accessibility of the knowledge, which has been helped and hindered, both at the same time, by the book, “The Elliott Wave Principle.” Unfortunately, it contains a number of errors that have led to the discounting of the scienfitic aspects of Elliott’s work. Chart examples in the book are invalid, for example. The most obvious example is a chart of an ending diagonal that is not an ending diagonal at all, because it breaks the most important rule in determining one. I expose this example below.
The error in this chart was so obvious when I read the book, that it led me to research all the other chart examples (charts pulled right from the market). What I discovered was that most of the examples were invalid.
Two charts in the book that are to provide evidence of a truncation are invalid. Neither one is a truncation. You’ll also find this example below.
So I’m fighting an uphill battle. Thanks to Dan and others, this challenge has become insurmountable, in my humble opinion. There’s simply too much erroneous information about Elliott Wave for me to overcome. I do not have the time nor desire to combat this uneducated blather any longer.
And now we have a final wave up from 2009, engineered by central banks, that’s clearly a B wave. That’s a problem for the integrity of the book, because Mr. Elliott was adamant that B waves at the top of a market exist (an irregular top). Bob Prechter decided to change this aspect of Elliott’s theory.
Mr. Prechter has solved this problem in recent charting by ignoring certain waves. Of course, you can’t do that, but ironically enough, that’s a trait of this cycle top (based upon the work on Dr. Raymond Wheeler, whose work I’ve cited over and over again). It’s an age of terrible grammar, and fake news. This extends to science, of course; we have global warming and the ozone scam as great examples of this phenomenon.
Sloppiness is normal at the top of this cycle (where we are right now), so I can’t expect anything different, I suppose. But that doesn’t mean I have to accept it.
The B Wave (that others are trying to make into an implusive wave)
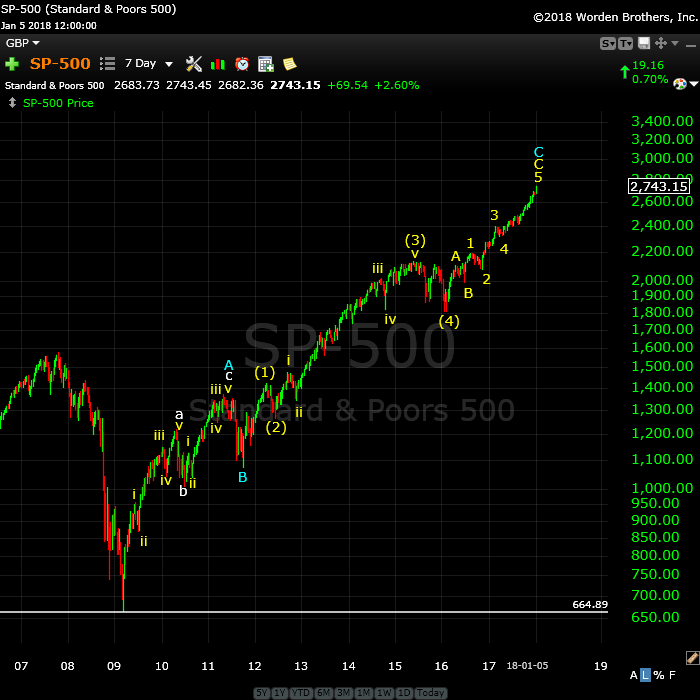
Above is a 7 day chart of the SP500 showing the final wave up from 2009, which I have referred to in previous posts as a B wave, contrary to Prechter’s assertion (which was contrary to Elliott’s original work) that a market top cannot end in a B wave. Oops!
However, to alleviate that problem, Bob has posted a chart in the most recent version of his publication, The Theorist, that ignores some waves, which of course, you’re not supposed to do. Thanks, Bob! That really helps the cause.
Unfortunately, based upon Mr. Elliott’s hard rules, I can find no other explanation for the above wave sequence other than it’s a B wave, because it breaks many of the rules and guidelines of impulsive waves.
However, for all those who disagree, here’s a test:
The Motive Wave Quiz
This little test is primarily for our guru, Dan, who believes this wave up is impulsive. He obviously knows better than me. But I’ll open it up to anyone. I’ve posited a short set of questions, but can certainly provide more.
- An impulsive sequence requires a valid second wave that retraces 62%. Please identify it.
- An impulsive squence requires a valid fourth wave that retraces 38% of waves 1, 2, and 3 of that sequence. Please identify it.
- The most important element that both Prechter and Elliott noted is that an impulsive wave must have “the right look.” How does this wave up, which has a corrective look to me, fall under the category of “impulsive, based upon its “look?”
- How is it that none of the waves in this sequence fit the required fibonacci wave relationships, but is still considered “impulsive.”
- How is it that this wave up, if considered to be impulsive, has more waves than a normal impulsive sequence? If you have an explanation for this impulsive anomaly, please provide your count in a posted chart somewhere.
_________________________
The Elliott Wave Principle Book (the errors)
 In the process of building on the work of Ralph Nelson Elliott and the interpretation of his work provided by Robert Prechter and A.J. Frost, my research has uncovered a lot of errors and omissions in “The Elliott Wave Principle” book. I would assume that any good EW analyst has done much of the same work. Or do they believe everything they read?
I’ve decided to provide my findings as a lead-in to a comprehensive course I’m developing. I’m providing it here as an example of the erroneous information that’s out there, to support my comments that the tools many EW analysts are rather “dull” and this is the reason for all the EW misinformation and counts that are simply incorrect.
I came to Elliott Wave Theory through Robert Prechter and his EWI site. After over a year as a subscriber, I became so dismayed with the continual errors of his analysts, that I determined to take a few years, devote myself to the market and the EW principle, with a goal of eventually excelling in its use. I discovered so much more in the process than has been written by either Prechter or Elliott (and several gross errors in the Prechter/Frost publication).
But I’m only expanding on their work; I’m not doing anything extraordinarily ground-breaking. My belief it that the work I’m done solidifies the principle and maybe, just maybe, it will help others in their analysis.
I’m convinced that Elliott’s description of the movement of the market should be considered a science. The reason the Elliotticians waver in their analysis is because of the errors in the Elliott Wave Principle, most of them due to the additions, or changes to Elliott’s original work, done without proper research.
Here are a few examples (all the charts expand when you click on them):
Ending Diagonals
There are two examples of ending diagonals in the book, one totally invalid.
The first example (p.39, fig 1-18) isn’t even an ending diagonal, and it’s glaringly obvious as to why. One of the key determinants of ending diagonals is that the fourth wave must intersect the area of the first wave; they must overlap.
In this example, they don’t. End of story.
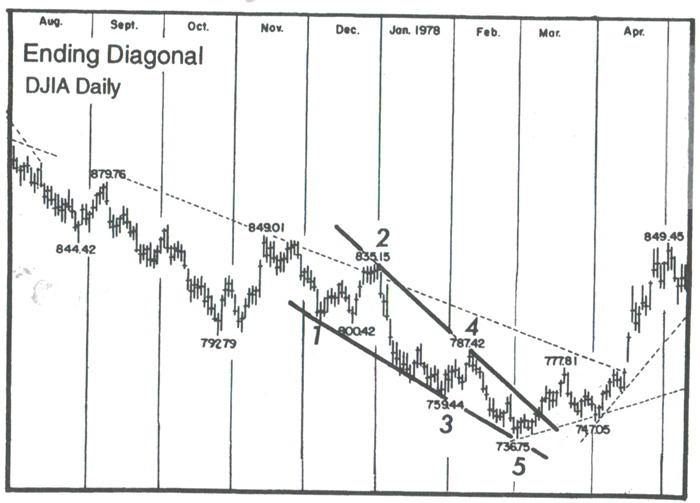
The second example (p. 38, fig. 1-17) is a valid example of an ending diagonal. However, one of the defining tests is that it must be in a fifth wave, in this case above the fourth wave. However, the trendlines drawn suggest that the fourth wave is part of the ending diagonal. It cannot be, based upon very definition of an ending diagonal.
A fourth wave triangle has the fourth wave as part of the triangle (it forms the A wave, in fact)—an ending diagonal does not.
An ending diagonal starts with the first wave of the diagonal. The lower trendline should begin on wave ii and contain wave iv.
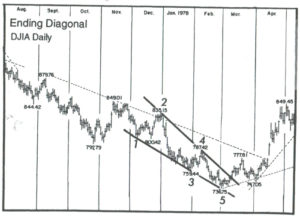
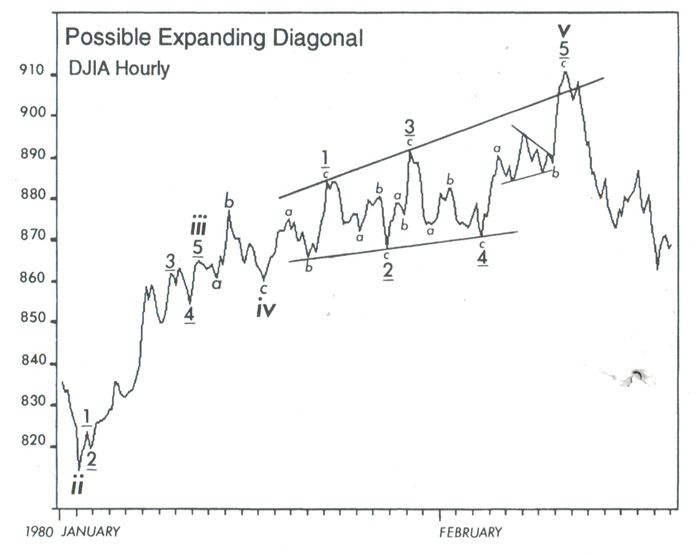 An expanding ending diagonal is a Robert Prechter invention (added to Elliott’s work). However, nobody has ever seen one. All we have is a line drawing in the book and it’s shown to the left (p. 39, fig. 39)
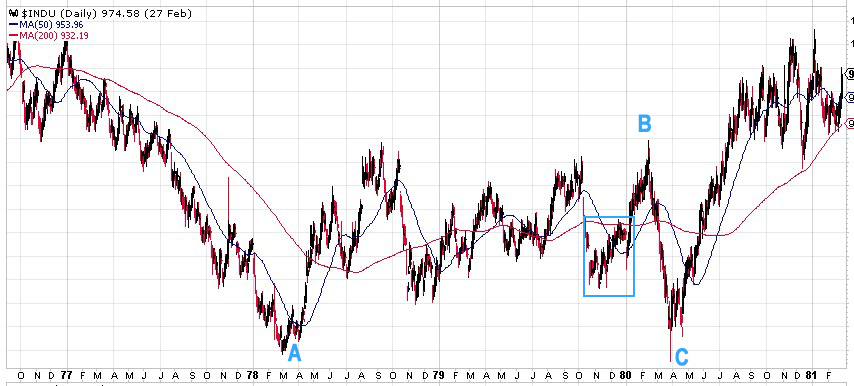
When I went to the original source, which is a DJIA hourly chart from early 1980, I found that the position of this pattern within the larger structure didn’t support the supposition that this existence of this pattern is remarkable, important in any way, or even repeatable.
It’s at the top of a B wave in a continuing corrective pattern. Ending diagonals are supposed to be in C waves, or most importantly, fifth waves of an otherwise impulsive pattern. This one is not.
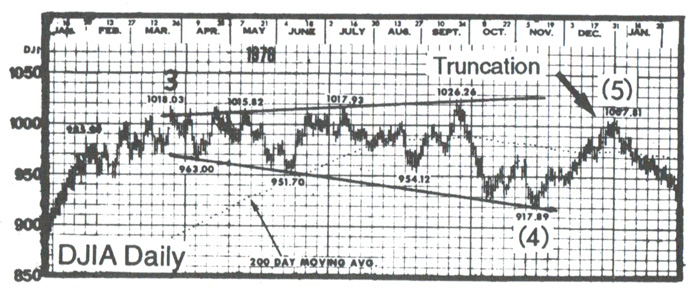
Below is a chart pulled from the DJIA showing the above example in its original habitat.
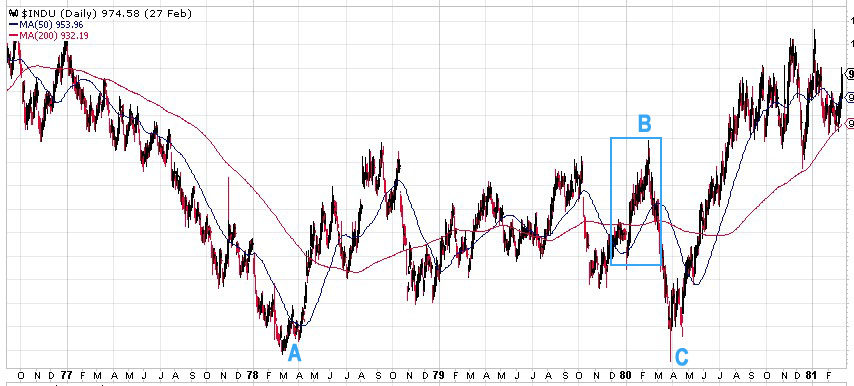
Above is a daily chart of DJIA showing the position of the supposed ending expanding diagonal. It’s at the top of a B wave in a large bearish correction. What value this has is completely beyond me. It’s not even interesting.
_______________________
Leading diagonals
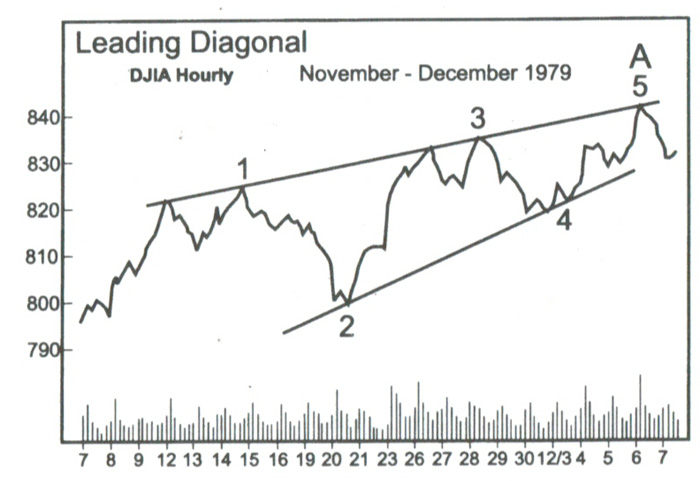
Here’s another “ghost of charts past.” There has not been a valid chart presented to support this pattern anywhere that I can find. It was a Prechter addition to Elliott’s work.
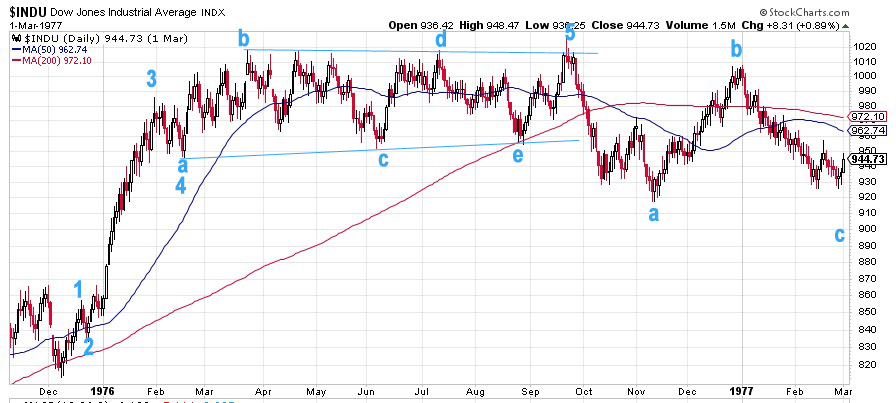
The only example we have is in the book and it comes from the DJIA hourly chart in 1979 (p. 40, fig. 40)
Let’s look at where this leading diagonal originally existed, by taking a look at the original chart, but over a longer period of time.
Above is a daily chart of DJIA. It’s actually the same chart from the ending expanding diagonal idea described above. So, what we have is an example of a leading diagonal and an ending expanding diagonal in the same corrective B wave. That’s quite a wave, just chocked full of diagonals! And it’s a B wave, a place where diagonals are very unlikely to appear.
Even if this was a repeatable pattern, providing an example in a corrective B wave is hardly an example that is likely to have any effect on the count. It certainly doesn’t here. It’s at most an odd pattern that’s not particularly interesting, and is of little practical value, imho.
Outside of this questionable example, nobody else has ever seen one.
__________________________
Truncations
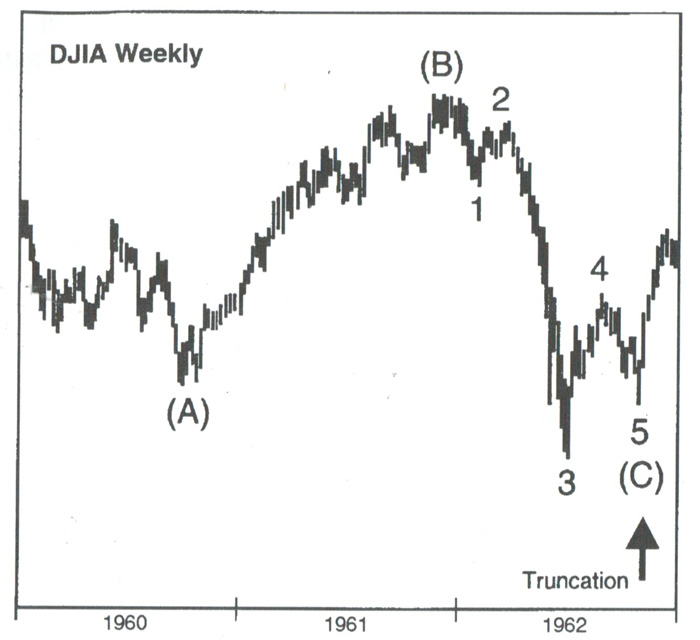
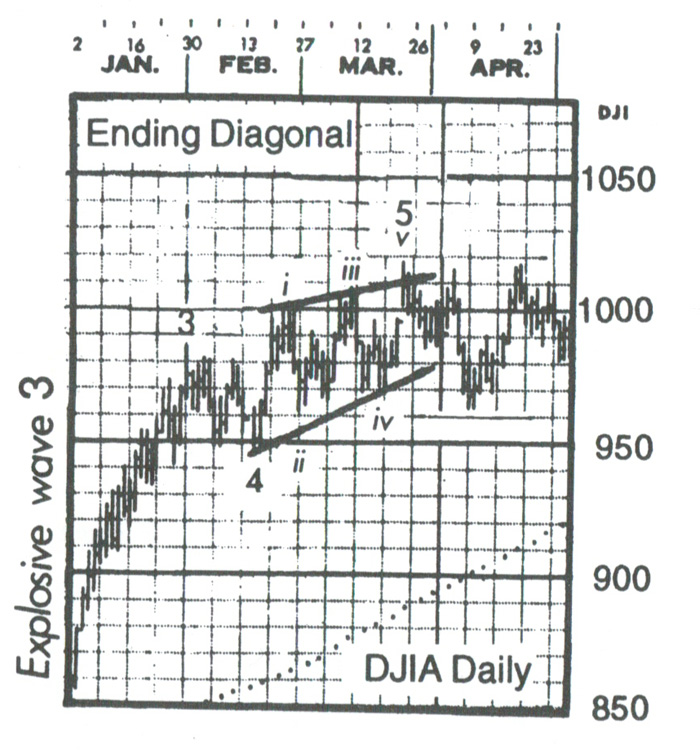
Nobody has ever seen one. The example charts in the book on this subject are invalid. The example on the left is a three-wave, fourth wave of a sequence, mislabelled in the chart to the left (p. 36, fig. 1-13).
It looks good here, but if you look at the bigger picture, it makes no sense. The chart below tells the real story.
It’s really an odd example, because it’s an ABC structure, which is a corrective wave. The C wave down already has a small fifth wave within it, and the overall look is consistent with a normal C wave.
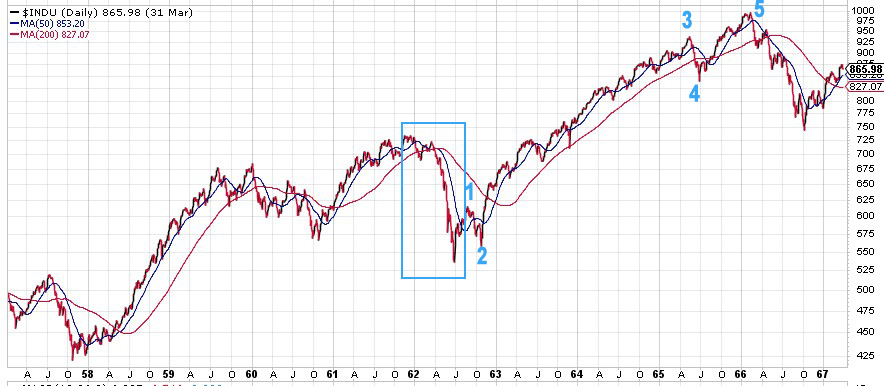
Above is a daily chart of the DJIA showing the “truncation” example above in its natural habitat—in a bullish third wave sequence, surrounded by impulsive waves, it’s simply a small fourth wave correction, not a truncation of anything. As such, it’s supposed to be in three waves!
Truncation Example #2
Above is the second example of a truncation from the book (p.36, fig 1-14).
Here’s the same chart labelled properly – another daily chart of DJIA. This wave up from December, 1975 is an impulsive wave with a simple contracting triangle as a fourth wave (abcde), with a small 5th wave up to a final high. I have no idea what they were thinking when they labelled it the first time. If it’s a truncation you’re suggesting as a result of your analysis, it seems to me (as Mr. Prechter states in the book) that all other options should be exhausted. He apparently didn’t heed his own advice.
Bob Prechter, in his writings, has expressed a desire that EW Theory be classified as a science. However, his adoption of this truncation “anomaly” certainly doesn’t support this desire. You can’t have a valid scientific theory that fails periodically. After going back a hundred years in the DOW, I can’t find a single occurrence of a truncation either at market highs or lows.
As far as I’m concerned, truncations don’t exist; nobody has ever seen one.
_______________________
Inadequacies in the book
Here are some areas in which the information in the book is not complete, imho:
Second Waves. Second waves in an impulsive pattern must retrace 62%, based upon my experience. I’ve cited this several times over the past two years and it has yet to fail. This fact is often the difference as to whether analysts are correct in their calls, imho. In Prechter’s book, the requirement is that they only have to retrace 38%, which has caused analysts to be wrong over and over again.
Fibonacci Ratios. The role of fibonacci ratios in both corrective and impulsive markets is woefully incomplete in the book and, in my work, has time and again proven the most important factor in determining both wave end-targets and whether a structure is corrective, or not.
Third waves of an impulsive sequence are almost always (I haven’t found an exception yet) 1.618 or 2.618 (in an extension) times the length of the first wave. Fifth waves are typically 1.618 X the length of the first wave. They can extend to 2.618 times the length of the first wave, but this is rare.
First Waves
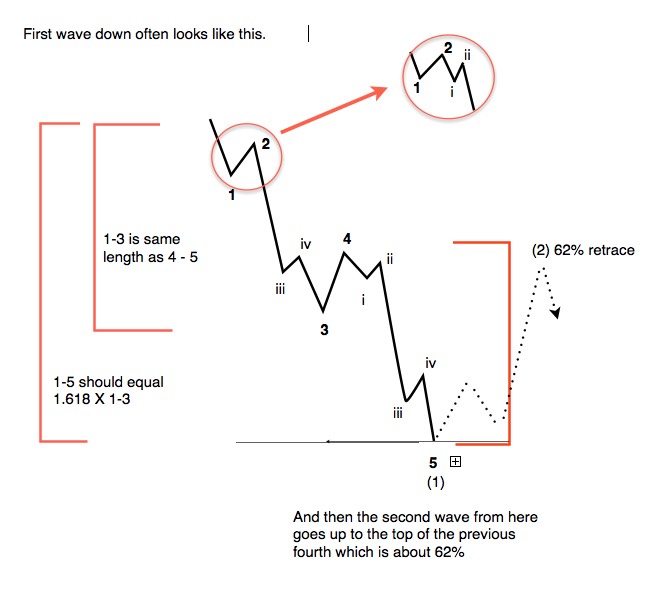 First waves of an impulsive pattern have a different structure than all other impulsive waves. This fact simply isn’t addressed in the book. This is why first waves often have the appearance of a three wave sequence. The different is subtle.
In a true impulsive first wave, wave 4 must retrace to the level of wave iv in the diagram and also must reach a retrace level of 38% of the distance to the beginning of the first wave.
If it does not meet this requirement, the wave is to be considered a zigzag, which is a 5-3-5 combination (in this case, it’s corrective).
Waves in Five. The difference between a corrective five wave pattern and an impulsive five wave pattern has not been addressed at all in the book. This perhaps the most important distinction in determining corrective vs. impulsive wave structures.
B Waves as Irregular Tops. I’ve tackled this interesting phenomenon at the top of this EW expose with a chart showing the SP500 from 2009 to today. Irregular tops appear (if at all) at the top of an impulsive trend. This is referred to as an “irregular top,” which Elliott identified as a feature of his theory, for different reasons that don’t apply to the current situation I describe above.
But, here we are with a B wave. It should not be ignored, or “papered over” by breaking the rules. That’s not the proper way to advance a science. Recently, I’ve seen a chart from Mr. Prechter that ignores a fifth wave in order to skirt the issue of this irregular top.
In summary, what we have a technical publication riddled with errors. It’s no wonder that elliottwave practitioners come up with different counts. However, there is seldom more than one correct count. The issue is the rudimentary condition of the tools they’re using.
I’ve been attempting to research these tools with the goal of clearing up the misconceptions. That’s been my goal.
I’m not disparaging the work of Robert Prechter. He did a great service by publishing this book, which in my view, is the most comprehensive interpretation of Mr. Elliott’s work. However, like any science, it often undergoes intense scrutiny, with the ultimate goal of proving its viability without doubt. In my small way, this is what I’ve been attempting to do, and all the research I’ve done doubles down on the integrity of Ralph Elliott’s work and the Elliott Wave Principle itself.
________________________
I get asked often why EW analysts come up with different counts. Erroneous information is a great foundation on which to construct a building that will eventually collapse. If science is rock solid, then the building will stand forever.
However, if your tools are blunt, you’re going to do a less than adequate job as an analyst, through no fault of your own (other than laziness, I suppose).
Some have offered statements to the effect that the Elliott Wave Principle is a subjective method of analyzing the market. That’s an attitude that suggests a minimal understanding of the process.
Prechter himself spent a few pages on this very topic:
“Despite the fact that many analysts do not treat it as such, the Wave Principle is by all means an objective study, or as Collins* put it, ‘a disciplined form of technical analysis.’” — page 94
• Charles Collins wrote the foreword to the Elliott Wave Principle.
As a result, I don’t generally look at anybody else’s work. I don’t let news or events play any part in my analysis. My job is to remain completely objective. I only look at indicators after I have done my initial analysis to see if they support (or not) my prognosis.
So, as an EW analyst, are you an “artist?” Perhaps, because you’re given a set of tools that are roughly hewn and have to use them to bring clarity to a market that moves in a predictable manner, churning out the same patterns over and over again, with Fibonacci relationships to each other most often provide multiple target options.
I suppose the real art is weeding out those options through experience. So, there is art in analysis, but I believe how the market moves to be a science that was uncovered by Ralph Elliott, with rules and guidelines that were refined, clarified, and communicated by Prechter and Frost.
In my work, my interest has been in refining the tools, finding the errors in the communication of Elliott’s work. However, the free blog is obviously not the correct platform through which to undertake this task.
It looks like it’s time to move on, by spending my time where I can have more of an impact.
____________________
Problem receiving blog comment emails? Try whitelisting the address. More info.
______________________________
Get an upper hand … JC 2
Get an upper hand in trading …Seeing all the different currency pairs and the wave structures and hearing you explain why this has to do that on a nightly bases gives one a upper hand when trading. Elliott Wave applies to all stock and indices and can be applied to any candlestick chart. If someone ask what you want for Christmas – Tell them a membership to Peter’s “Traders Gold!”—JC |
Have not had a losing week RW 2
Have not had a losing week …I have been with Peter almost a year. The only thing that matters is have I made money with his service. I think I have finally turned the corner using Peter’s EW. I have not had a losing week in the last 5 months. Thanks Peter, for your amazing amount of hard work. —RW |
The best of them JL 2
The best of them …Last couple of years, I subscribed to several ‘market traders’. You are by far the best of them and the personal contact is awesome. Daily and daily updates are very well written! Besides your expertise in EW, I also like your cycles analysis. Best investment I ever made! —JL |
Rise above the rest … SM 2
Rise above the rest …I have only ever met a few people who, in their chosen fields (astrology, medicine, music, martial arts, technical analysis), rise above all the rest and you are one of them…you have ‘the gift’…and that’s why I’m a Trader’s Gold member. —SM |
Tops in your field DZ 2
Tops in your field …You are tops in your field. Tried to follow Elliot Wave international for years. They were always behind the market. After discovering you, I perceive that you are an expert in reading the waves, which puts you way ahead of the rest of your peers. And you can read the Waves like you are reading tomorrow’s financial section. I pray you stay healthy. —DZ |
Couldn’t be happier … KK 2
Couldn’t be happier …The analysis and insight you provide is simply amazing! I’ve been trading the futures and equity markets for well over thirty years and usually average around 5% monthly. Since joining your Traders Gold Service two months ago, that number has better than doubled. I couldn’t be happier.—KK |
A true expert in Elliott Wave FL 2
A true expert in Elliott Wave …You are a true expert in EW analysis. What you provide is not available anywhere and is priceless. Subscription on your services is the best thing I have ever done. Many thanks for your effort to make me a better investor. I now have more trust in my investment decisions. I hope you will continue the excellent work! —FL |
the real deal SM 2
The real deal …‘Educational, insightful and thorough market analysis for all levels of traders. It’s Elliott Wave at its best….Peter Temple is the real deal’ —SM |
The Market This Week
Here's the latest daily chart of ES (emini futures)
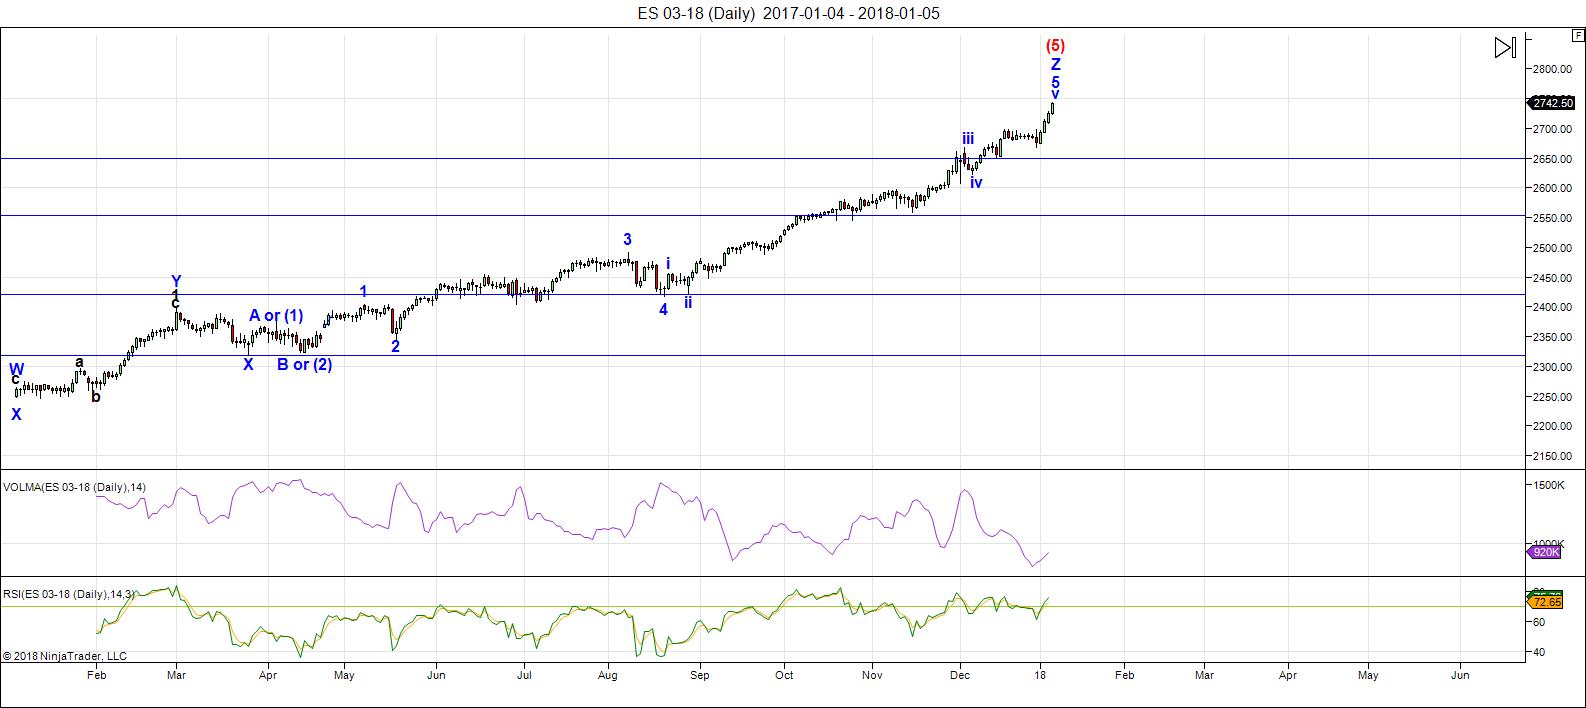
Above is the daily chart of ES (click to enlarge, as with any of my charts).
There have been no material changes to my prognosis. We are at the high. I expect this final wave to turn down this week.
I thought last week we might have a large contracting triangle in play, based upon the need of currencies to top. However, with the dollar topping earlier than I expected, the US market has rallied to a final high. Everything is in place for a major change in trend.
My Trader's Gold subscribers know that every one of the ten assets I analyze daily is at a major inflection point this weekend.
Volume: It's dismal. Bullish sentiment is now at 93%, the highest it's been since the top of the dot.com bubble.
Summary: The count is full for the US market in general, except for small subwaves that form the balance of a motive set of waves in SPX and some other major US indices. Watch for a turn this week, which will change the trend and end the 500 year bull market.
___________________________
Trader's Gold Subscribers get a comprehensive view of the market, including hourly (and even smaller timeframes, when appropriate) on a daily basis. They also receive updates through the comments area. I provide only the daily timeframe for the free blog, as a "snapshot" of where the market currently trades and the next move on a weekly basis.
______________________________________
Sign up for: The Chart Show
Next Date: Thursday, January 18 at 1:00 pm EST (US market time)

The Chart Show is a one hour webinar in which Peter Temple provides the Elliott Wave analysis in real time for the US market, gold, silver, oil, major USD currency pairs, and more. You won't find a more accurate or comprehensive market prediction anywhere for this price.
Get caught up on the market from an Elliott Wave perspective. You’ll also get Andy Pancholi cycle turn dates for the SP500 for the balance of the current month. There’ll be a Q&A session during and at the end of the webinar and the possibility (depending on time) of taking requests.
All registrants will receive the video playback of the webinar, so even if you miss it, you’ll be sent the full video replay within about an hour of its conclusion. For more information and to sign up, click here.


I recently heard someone say, or perhaps I read it somewhere that C waves differ from third waves in that the retraces tend to be less obvious. Maybe Peter T. can give some insight into whether he has found that to be the case….
Kerry again – this problem needs fixing immediately. These details are being retained somewhere
I try to take a quick look at the name and e-mail fields before I post. Sometimes I still forget….
BTW, the fields can be edited in case you weren’t aware of that….
I am aware but want the security flaw fixed
Kerry
Okey Dokey! 🙂
Wow! No change in VIX?
Are folk really THIS complacent, or the FED hard at work??!!!
The herd is 100% confident the market will be higher thirty days from now.
Ed, see my answer to your query above for a link to the updated channels and a shorter channel added which explains yesterday’s excursion outside the other 2 channels…
Peter G,
Thanks again. I responded above!
does this look like “natural” price action to you???……anyone??
https://invst.ly/6b3t4
Nope! Helllll Nope!
Traders now apparently front running with volatility shorts, COCK-SURE we have nothing but another BTFD coming up in what they assume is a C wave to complete this Oh- so- brief pullback; now a whopping better than 10% beyond the 200 day SMA!!!
Well, yes. Double bottom. Higher low and grind back to 2753. 🙂
Yeah. Hard to tell if the next C down is it or part of a larger ABC. Move up today did look corrective to me.
Another friend of mine threw in the towel today and cashed out of the markets for reasons a bit different than I. He was less concerned about the safety of his funds than he was at his limit of frustration with market behavior. I can’t say I blame him… 🙁
Shorting ES. Hard stop at 2750.00
Have a great evening everybody!
Nudged stop to 2752.00
They kept chasing my stop so I said the hell with it and moved it right back to 2760; so far so good; reversed at 2754.60. I will be quite happy with another ten handles… 🙂
Please , do not close open comment , if you do not like comments , drop the person…..n
ok….. “PEOPLES”…………… [plural]………..the morning ES update….. https://invst.ly/6bc-2
and a close up of wave V – is it an ED???? https://invst.ly/6bd4t
…..”GULP”…………………………. we have “overlap”…………… “BE WARNED”!!!!
https://invst.ly/6bdc0
After an exhaustive search, I cannot find a single analyst besides Peter who is expecting an imminent top!
Even Northman Trader Sven is now talking about SPX 3000 plus. This could be one for the ages…!
verne,
no need to look “outside”…….when the answers can always be found – “within”……
…………[a zen minute with ………….the luri]
Could go through the weekend while everything finds its target. Big turn date on the weekend. I don’t if it will stretch until then, it all looks that close. We may grind away here for awhile.
LIZZZzzzzzzzzz!!!! …… it’s a 111 day!!!!! today is a 111 day!!!
Out of all weekly calls Luri!
OMG – is it??? will it be shorter than w3??
ES ending diagonal – https://invst.ly/6be4h
the “moment” of overthrow!…………… “BE WARNED”!!!! https://invst.ly/6bec6
Ed
Remember the moon stuff i posted ?
sometimes they repeat even if very short term
data .
https://worldcyclesinstitute.com/new-years-resolution/comment-page-1/#comments
Jan 9, 2018 08:05 PM Moon enters Scorpio ( a high for a day ) ? sun conjuncts venus… start of venus bear cycle
Jan 12, 2018 07:04 AM Moon enters Sagittarius ( Up continues ) ?
Jan 14, 2018 07:42 PM Moon enters Capricorn ( top or sorts )
Jan 17, 2018 08:32 AM Moon enters Aquarius ( top of sorts )
Dealing with software issues today.
fun fun
oh……MA…….. GAWD!!!!!!………………………. verneeeeee……where be yeee??
https://invst.ly/6belc
ALL eyes and ears, my dear! 🙂
peter,
if it goes down from here, do you know what just happened??? are you sitting??….
T-R-U-C-A-T-I-O-N!!!!!!!
wave 3 high in ES was 2760…..so far high in ED is 2759.50!!!!! https://invst.ly/6beoe
If we go red today I will be inventing a new trade signal, namely, the “Inverted Island Gap”! 🙂
that sounds like a “tropical” cocktail verne…………………. would like an “inverted island gap” ……………………………..with your fried plantains senor???
Okras! If you don”t mind, senorita… 🙂
that big fat red line below at w4 lows at 2736 is where we need to drop to “fast” to confirm the ED……… since the w5 ending diagonal was done yesterday and overnight……………………………..
https://invst.ly/6berz
Let’s see…zig zags, yep! Three smaller than one…yep! Four smaller than two….yep! Overthrow of 1,3 trend-line…yep!
Yikes! I think it’s a DUCK!!! 🙂
25695 cash dow a possible high
Lost my NYA chart yet was thinking 13220 ?
ill have to check the previous thread
Peter
not sure but for me this web page has turned gray
We’re working on that bug today so you may see some odd stuff from time to time.
yeah joe, its dark grey on my end too……………………. !
My phone is more a chocolate brownie hue! 🙂
peter……..
i would like a serious “discussion” …………………… “scientist” to luri……………….about this “truncation” issue, as it has been bothering me now for at least 5 minutes………………….. [cough]……………….ahem…………….
:-))
es update…..https://invst.ly/6bfhq
“hold the mayo, and hold the truncation”……
Considering total assets minus liabilities, CLR’s stock has an intrinsic value of zero.
Today it is making a new 52 week high.
If anyone ever harbored any doubt that equity prices today are entirely divorced from economic reality, there you have it!
Who on earth is buying???!!
Verne – for all resource mining companies, it ends up being the value of mineral, cost of extraction and the cost of financing. The reason they act so levered is because their cost of funding goes down exactly when the price of mineral goes up. There is a belief in the market that 6 year commodity slump is over and investment can start again. All these stocks will be a great short once the melt down starts. I don’t see too much value in identifying a top. For me, wave 2 bounce is more important. Fading wave 2 and wave 4 is where I have made the most money. I am sure wave 2 will be clearly visible in CLR when the time comes and you will be able to buy puts at throw away prices.
I agee for the most part with the general thesis. The debt load in outstanding bonds issued to finance their fracking operation is massive. They are going to need 200 dollar oil to stay alive. Chances of that are not good…
How about that…right back up to 2760….waaaay too cute!
yes, no truncation ……… question……………………… do we get a Wile E Coyote moment??
The outcome of this kind of prolonged sideways indecisive price action is well established. Looks like it’s on to a new ATH.
We are PARABOLIC people! 🙂
last possible adjustment to ED count……
https://invst.ly/6bgzf
If this not Euphoria, what may I ask, qualifies?
Is this sustainable? Are we in a new paradigm? 😉
paradigm…. or… can you spare a dime?
You didn’t say, “Mister”! 🙂
Joe, it is remarkable how DJU continues its slide….makes you wonder who is going to catch up with whom!
Verne, my dispersion map only shows XLU and XLRE as not in step with the market, but divergence is there as you said
Do you think it significant? If DJU is reacting to a rising interest rate environment, can equities be far behind? So far they most certainly are so the divergence is a bit of a mystery….
doesn’t seem significant…until it is. XLU and XLRE are both interest sensitive, so need more dispersion than that, but by the time it’s here (dispersion), the top is past us. And like Luri, we would like to nail the top.
I am impressed how resilient people are here with trying to nail the top. I’ve given up and happy to ride this parabolic profit making machine till the very end. My trading notebook has a Note to never try and predict the end stages of a bull market.
I hear ya. I got out at 2700 cuz I thought it prudent and clearly I was early! 🙂
Apart from an occasional scalp, I missed the parabola. Enjoy!
q,
why do you insist on seeing the world of “motivation” in YOUR image. My motivation here, is building upon my ability to “chart” well. So ……”riding” the wave of long trades, are meaningless to me……………………….
so “nailing” a top, is exactly what i am here so to do!!!!
I happen to have a nice Paslode aiirless if you are interested… 🙂
If you’re in weekly calls or playing CES/event or earnings upside/downside momentum, you need to cash out once you’ve reached your target price. If you’re just putting money aside bi-monthly to an ETF or MF then no need to look at charts. Just wait for potus’ dow 30k target. After all he has tethered himself to the stock market using it as some sort of daily report card on how he is performing as potus. I believe his goal is to be the President of the greatest bull run ever.
For example, a KODK weekly 12.5 call was worth a nickel, a quarter 2 days ago. It went up to 3.4 yesterday. Now it’s back to 20 cents.
O.K. Somebody wake me up when futures shed the first 100 points will ya? 3000 here we come!!!! 🙂
After a wave 4 correction, you might get that 3000.
it is now clear to me which subscription service you are following…that wave 4 correction is expected to be approximately a 10% drop finishing above the August 2017 low…?
Very funny.
I know half a dozen excellent EW analysts that see us completing a third wave, albeit at varying degrees of trend.
Remarkable clairvoyance! 🙂
Prechter really blew this one!
nothing funny about it…have been paying close attention to Dan’s posts…trust me, Dan knows full well how he confirmed his particular subscription service…albeit the degree of trend, if you know half a dozen excellent EW analysts that have seen us in a third wave why have you been a fervent top caller these last months?
Please provide one single quote in which I have called for a top, much less done so fervently.
I want to say this gently, but….are you familiar with the word “Smarmy”? 🙂
go back and read your posts…while you are at it, get over yourself!
https://tinyurl.com/y9h2muxn
Dan…now that the S&P 500 target for this wave has been surpassed how about posting ‘your’ expectations before you receive the update from your subscription service…
“So, this week, we have Dan charging on here believing he has the right to command the audience I’ve built with his predictions that are neither possible, nor backed up by any evidence whatsoever.”
Peter Temple | January 7, 2018
Dan…the update from your subscription service must have you a bit unnerved…in the process of finishing up wave 3 or wave 5? since you already drank the cool aid, make sure you review your subscription service’s previous expectation for calendar year 2018…that’s right, calendar year 2018!
DJI is now penetrating a decades old trend-line to the upside. If this goes up another 100 points and bounces on a retest, I am going to really take notice…
Crimey! Up another 100 points!! Inccredibe!!!!
If this line holds, it is a hell of a buy signal it would seem by classic T.A.
Looks like five waves up off yesterday’s lows…am I right? It still looks labored to me…
Over the past year I have seen this market flaunt what would normally be bearsih signs so often and for so long I honestly have no idea what I would consider a reliable reversal signal. I am even more bewildered as a few Elliotticians who I think know what they are doing have identified possible completed wave counts. I am starting to think that price alone will be our final and only reliable confirmation, as obvious as it seems. I also remain quite convinced that if it ain’t happening in futures, it ain’t happening. What say ye? 🙂
Verne, I know I’m preaching to the choir here, but yes, definitely every sell signal I’ve gotten over the past several years (2015 being a wonderful exception – twice!) has just been obliterated, for me, anyway…
Every time momentum signals turned lower, a great ~woosh~ of buying would come in, and I’m losing money on my positions again, almost faster than you can blink…
I’m not the first to say this, but clearly, CB buying has been a reason, but also interest rates being held down artificially is huge too…
It just makes everything impossible to accurately price, because a major determinant OF prices has been manipulated lower, which effects how you can tell the wheat from the chaff…
Which also makes companies that would have no value in normal times (as you’ve noted) continue to exist, and often thrive…
Not to mention the vast $$ being created by companies issuing bonds at 1-2%, and THAT would not be possible either without interest rates being held artificially low…
Regardless, this nearly “free” unlimited money has just made historically logical signals, just a waste of time, it seems…
At ~some~ point, something will trigger a breakdown (no idea what/when, obviously), and everyone is gonna wake up one Monday morning, and realize there’s no value here, and because these markets have gotten SO far away from true economic value, it’s going to be a disaster for everyone…
And I think that CB’s know what’s going to happen if they ever STOP manipulating the markets, so they don’t…
So here we are… Sell signals that don’t work, UNTIL the market finally implodes on itself… And I have no idea who will survive that financially, TBH….
Man I cannot tell you how glad I am to hear someone else say ” You are not completely nuts”.
I have heard so few other traders I talk to express this frustration over this one-way market I was starting to get an inferiority complex. While I would like to see a “normal” correction, I am starting to thing this is an “all-in” one way bet.
Has anyone taken a gander at how far away we are from any 200 day sma?
my timeline for a high sits from jan 9 to the 18th
i could be wrong no doubt about it yet
that is the window . the market looks toppy today
yet i want to see a decent 5 wave decline before getting excited.
the Utilities might have already begun its 3rd of a 3rd down .
the wave count i have been counting has morphed into something
else . Ill look at it later today and decide.
its another one of those wave 4’s that didn’t really materialize which bother me
and leaves it open to something else wave count wise.
Hey Joe, I was thinking what a classic match up between EW purists and other analysts the tax cuts provide. I have seen a few analysts re-work their count to allow greater upside due to the tax cuts. I don’t know how many times I have heard Prechter decry that approach as he maintains the waves are entirely immune to news events. McHugh thinks the 40% earnings pop cannot be ignored and will impact market price. I know you are not an EW guy but am curious as to what you think about this.
hmmm……. the drawing board is my friend……
https://invst.ly/6bi2c
ooops…… kill that above chart……..and replace for this one…..https://invst.ly/6bi5x
My wave counts have now leapt off the pages and are starting to wrap themselves around my neck! I do SO admire your persistence! 🙂
verne,
Patience, persistence and perspiration make for an unbeatable combination!
:-))
O.K. I promise to pan the petulant pessimism! 🙂
correction verne,
you are a very “positive” person. i am unable to characterize you as a pessimist. I would characterize you as a ‘realist’…………………..and when reality turns inwards upon itself……………..the “marshmallow peep” in all of us “realists” begins to surface……………………………….. keep being a realist. it is a very undervalued “asset”…………………………..
I must say that the next fib targets I have are not that close by. We have gone past the 1,618 1987 to 2007 low to high run. Maybe I will look at a few other intervals…
check yer email……and you will see what to check….
On it! Thanks!
Anyone else noticing how precisely Gold is mirroring the market, gaps and all?
Well, I’m short gold right now too, so no end to the pain train for me…
It’s just a trade, and was in a profit earlier this week, but still, not having a great week… :-/
I got unceremoniously tossed out of my short ES trade as well. I do think both Gold and Oil are due for a turn down, the latter especially.
And crude would be my 3rd short…. It also is just a trade, but… :-/
The Trifecta of pain for me right now… 🙁
COT short position in oil largest ever, more than previous high now at 650K contracts! It’s going South, and probably very soon.
Ahhh…. Logic… Clearly no bueno…. :-/
Actually, you want to be on the same side as these guys…they are always right.. 🙂
Gold has a bit higher to go. I will open a short position at session end tomorrow when we should see initial signs of a reversal…
US GOV shutting down in 8 days folks! maybe that marks the market top?
https://www.washingtonpost.com/politics/with-dreamers-in-the-balance-democrats-ponder-whether-to-force-a-shutdown/2018/01/10/2e4dd3f0-f54a-11e7-b34a-b85626af34ef_story.html?utm_term=.d941dcbe1074
Are Democrats that Doltish? I do know the Republicans are that Docile. 🙂
Wow! Just got an update from a chartist with an SPX target of 2858!
Yikes! That’s another 100 + points up the mountain!!!!!
Even if that is true, a small retreat should be just ahead. Eyeing SPY Jan 24 277.5 strike calls currently trading for around 0.85. Will try to snag at 0.75 or better. Above SPY 280 is an easy triple.
$TSLA 1HR Chart – 5th wave only produced 3 waves up, see if we get 5 impulse waves down on the 10 minute chart. If so, Will wait for retrace back up to short. Looks like a good call on Peter T’s part so far.
Looks like a higher degree second wave unfolding. Those March 2 305 puts now bid at 6.60, ask 7.50 are an easy triple if a third down on deck
I once winessed John Carter pull off a literal million dollar trade on TSLA.
TSLA pierced thru 10/18/17 & 12/14/17 downtrend line then rejected it.
Late Nov 2015, 50 sma went below 200 sma and tsla tried to hang around the 200 sma line. Last breath was about one month later.
TSLA 50 sma went below 200 sma 12/12/2017 and it’s almost a month…with the same topping tail right by the 200 sma. A little gust of wind and it’s ready to tumble down.
Peter, is the count still the same or has anything changed as ES just keeps going up?
Thanks
the RUT ending diagonal i have been tracking is almost complete…..
“BE WARNED”!!!!! https://invst.ly/6bk92
Just look a the chart of Dow since 2016. It gone parabolic and if you draw a line to make it more parabolic its not too hard to see 30k dow by early Feb. That should bring the top. S&P should also whack on 200 points from here. Im holding long and strong adding on dips. DOW RSI 98 on the way.
Well folk, like it or not, the trend remains up. Grabbed a small cache of SPY Jan 24 279 calls for 0.50 apiece.
I expect SPX now to at the very least tag 2800.00 and produce a double on those calls. Won’t be around tomorrow so this is my last post. Wishing everyone a blessed 2018, and once again many thanks to Peter T. for providing a forum to think out loud!
Verne, don’t worry, Pete won’t crack this chat off. He would be lost without the entertainment.
Second that.
Verne
I am an elliott wave guy by the way yet i include timing windows to trade off of .
the problem i have with the wave count is it is all 3 wave moves and those
3 wave moves are difficult to call.
The 60 minute dow chart from the jan 10 low has 5 waves up and wave 5
touched the 1.618 level based on waves 1 and 2. that to me is a fairly weak
rally despite the point move .
This makes the jan 10 lows as key support going forward.
25256.99 now key support
NYA is at 13210 and im watching 13220 .
25695-26210 is what im showing for the next range if the dow
heads higher
Verne
Anyone who changes their wave count based on outside factors such has
the recent tax cuts obviously do not place their faith in elliott wave theory.
why would the wave count suddenly change based on something else ??
it would really mean their bias has changed not the wave count or that they
have been very wrong on their wave counts all along .
and now for something different .
Microsoft was founded in april 1975 . that is almost 43 years ago and in all
this time they still cant produce an operating system that is reliable .
So lets go cashless
New computer in July 2017 and i am completely fed up with windows 10.
i am so fed up that i am going to wipe everything i have done and have an apple OS
installed and completely start over .
Test
verne
see above where i posted
Joe January 9, 2018, 5:53 pm
Today was the opening of the window for a top .
The spx tested the 1760 level ( I’d like to see that level hold )
Next higher level is 1860 .
This website is for educational purposes relating to Elliott Wave, natural cycles, and the Quantum Revolution (Great Awakening). I welcome questions or comments about any of these subjects. Due to a heavy schedule, I may not have the time to answer questions that relate to my area of expertise.
I reserve the right to remove any comment that is deemed negative, is unhelpful, or off-topic. Such comments may be removed.
Want to comment? You need to be logged in to comment. You can register here.