
Update Saturday, Nov 7
A look at the SP500 on Saturday shows that we’re in a final fifth wave. I expect, when the market is good and ready, to see it head back up to the most recent high, test it and turn down. At the same time currencies are bottoming, so there are potentially great trades coming up there, as well.
Currencies and equities seem to be fully correlated now, so they should all move in tandem over the coming months. More on that in the next post.
____________________________
Original Post from Nov 3:
Reviewing the charts tonight was very revealing. It also taught a great lesson.
Sometimes I get so involved in the intraday time frame that I don’t back out the charts enough and do measurements on the “big picture.” Tonight I’m going to stick with the big picture, as I think tomorrow will change that picture quite considerably.
Tonight, as I write this, futures (ES, NQ, and YM ) have bounced back up to a double top and are just “sitting there.” They may end up sitting there all night long, until the open.
The measurements of the charts are telling me that we’ve reached a top. I’ll share those measurements with you and why they’re important and then we’ll see what happens at tomorrow’s open.
Let’s start with the SP500, the big picture.
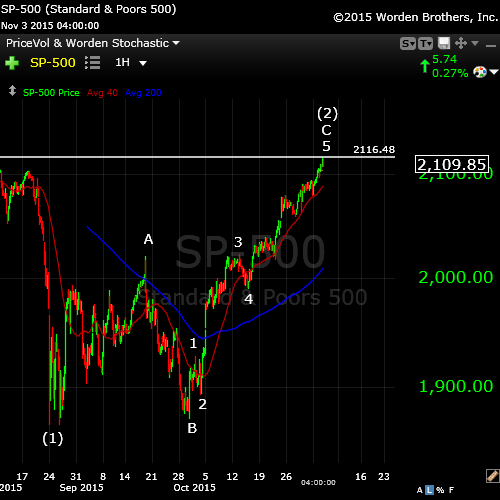
Above is the one hour chart of the SP500 showing the entire regular flat (3-3-5) consisting of three waves (ABC). You can see the final 5 waves of the C wave complete. The entire ABC pattern forms the second wave (2). The third wave down should follow and it should be at least 1.618 times the length of the first wave down (1).
So, why is this the top and not yesterday, or the day before? Good question!
The answer is: because of the wave measurements, which now support the wave count.
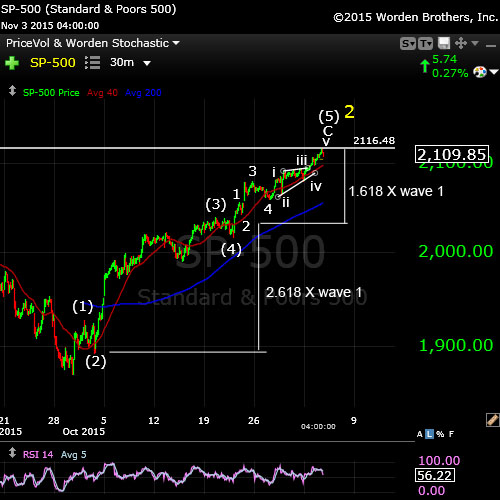
Above is 30 minute chart of the C wave of the SP500 showing the measurements of the entire wave of 5 waves up. In a motive wave, which this is, waves are almost always a fibonacci multiple of the first wave. Tonight, both the SP500 and NYSE met those targets.
If we take the SP500, the 3rd wave measures to exactly 2.618 X the first wave. The 5th wave measures exactly 1.618 X the first wave and that’s where it stopped—right at 2116 which was the correct measurement, right to the dollar! André, one of our most avid contributors and a Gann aficionado, also cited this number as an important Gann square of nine number.
It completes the wave, as does the wave count. We should turn down right here.
Tonight, as I mentioned above, futures seem to be stopped at this level, waiting for the open.
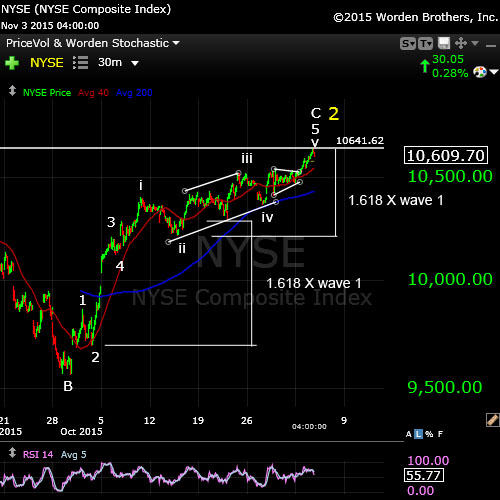
Above is the C wave of the NYSE showing the measurements of the entire wave of 5 waves up. In this case, as measurement of the waves shows that wave 3 was exactly 1.618 X wave 1 and that wave 5 was also exactly 1.618 X wave 1.
The lesson here was that I was so fixated on the NYSE lagging on not making the 62% retrace level that I never did measure the entire wave structure. Measuring it after the fact was very revealing.
The importance of the NYSE cannot be overstated. The SP500 and DOW are subsets of the NYSE but more susceptible to the animal spirits of traders. I always think the NYSE, as having the largest market capitalization in the world (and therefore a greater reflector of human mood on a mass scale) gives a much clearer picture of what’s really going on.
It has surpassed the 62% retrace level and gone on to form a perfect motive wave.
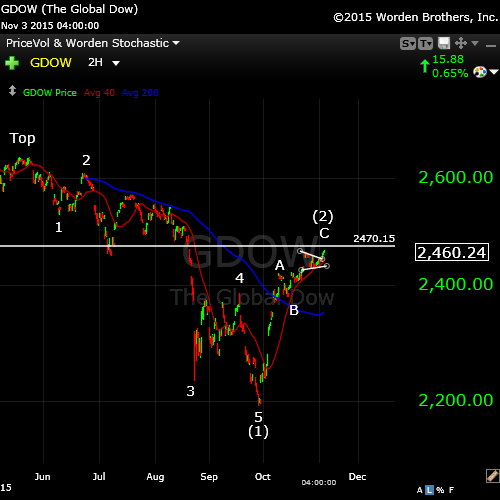
Above is the GDOW (Global DOW). I show this because it represents the bigger picture. The GDOW consists of a set of 150 large international corporations chosen from around the world. It clearly shows a first wave down of 5 waves and then a second wave up in 3 waves complete (or almost complete). The horizontal line represents the 62% retrace level, which is the preferred stopping point for a second wave. The third wave down to new lows should follow.
Tonight, the GDOW sits $7 short of the 62% retrace level. I don’t know if it will make it, but it will be the only major index not to, if it doesn’t.
This index should set the trend for the US market. There are some who believe the US markets have only come down from the very top in three waves and that the next wave down will be a C wave, leading to a very large 5th wave up to a new market high.
The GDOW suggests otherwise. It’s hard to imagine the US market doing something different than the GDOW.
_________________________
Two Alternate Scenarios Going Forward
As motive as this C wave is, it does allow the argument that we have just completed a third wave up. The argument would be that this is a larger degree fifth wave we’re completing to a new all time market high (an ending wave to a market top would need to be in 5 motive waves).
In this case, we would need to complete a 4th wave down next, which in the SP500 would drop 38% of the length of the C wave. In the SP500, this level would be 2024. It would be a wave in 3 waves.
There are a couple of reasons I consider this scenario unlikely:
- Because of the structure of GDOW, I’m of the opinion that the US indices have completed a first wave down. As I’ve stated above, it’s unlikely the DOW and other US indices would do something completely different that the Global DOW, which has clearly finished a first motive wave down and a second wave up in three waves.
- An ending wave of 5 waves includes the first wave up. All these waves must be in 5 waves to qualify. The first wave of our regular flat corrective structure (since August 24) is clearly in 3 waves.
However, I plan to watch the waves down closely to see how they unfold. They should tell the story.
There is one other scenario. We could also complete a C wave down to a new low below Aug. 24 and then start a fifth wave up from there. Because of the structure of the GDOW, I think this scenario also unlikely. If we were to also look a fundamentals, in terms of the strength of this market, I would have to argue that it reinforces the unlikeliness of this scenario. It would take another QE situation to help make that happen. The FED, quite frankly, is out of tools to make that big an impact on a dying market.
History: The 1929 crash
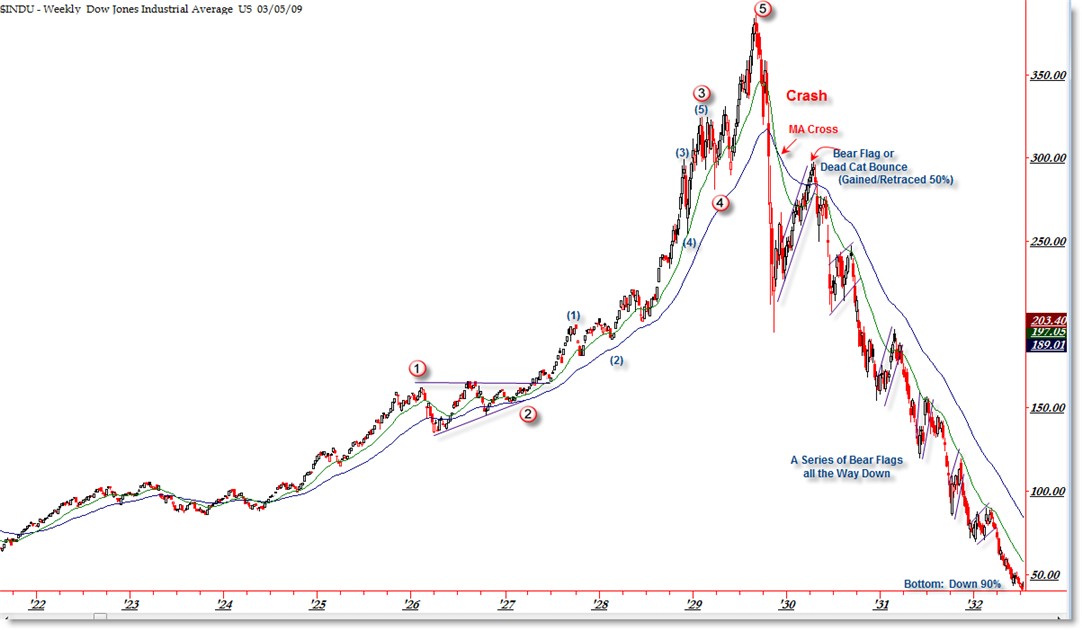
I think it’s important to look at 1929 and the wave structure (above and below), which was the same as 2007—to a point. I will show the 2007 crash below in the “What If” section.
The wave structure of the 1929 crash was in 3 waves overall. There were 5 waves down from the top (the A wave) and then a very large B wave retrace. The final C wave down was a stair-step affair and lasted over 2 years.
Let’s look a little close at the timing of the 1929 crash because the similarities to today are uncanny.
The market peaked on September 3, 1929 and then it took 2 months for the crash to actually happen (to reach the bottom of wave 5 of the A wave). The larger crash which we always hear about began on October 23, 1929. Then there was that large B wave, which lasted 5 and a half months and finally (which I explain a little further in the cycles section below), the C wave which went on for more than 2 years. This might be the scenario we’re looking at going forward.
Keep that December 12 date in mind for the bottom of the A wave.
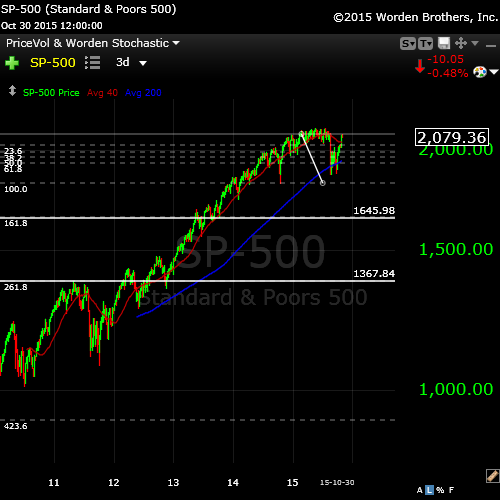
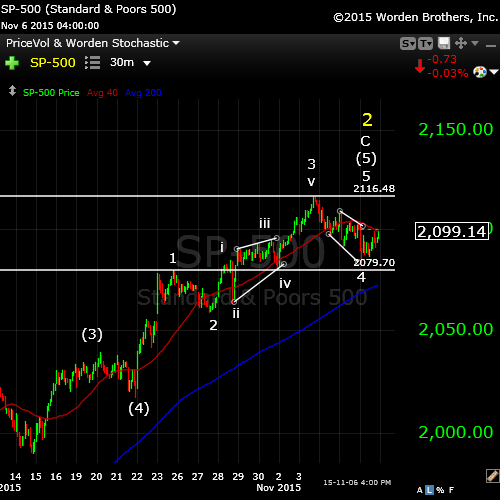
Finally, let’s take a look at a big picture of the SP500 and project the bottom of the third wave down. I’ve drawn a couple of horizontal lines on the SP500 chart to suggest ending prices for the bottom of the A wave.
If the full wave drops 1.618 X the length of the first wave, the bottom would be at 1645.98. *
If the A wave extends to 2.618 X the first wave (historically more likely), the bottom would come in at about 1367.84. *
* I haven’t recalculated the target numbers based on today’s action. They won’t change substantially.
______________________________
“What if”—Without the FED
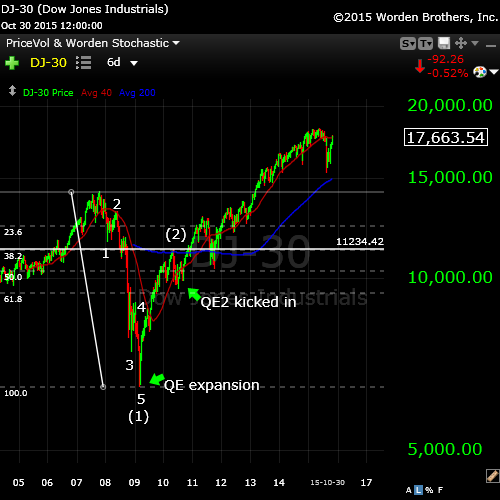
Above is the 2007 chart of the DOW. I’ve marked the motive wave down so that you can see the configuration compared to what should happen today and to what happened in 1929. Note that wave (1) came down in 5 waves and then we retraced to the 62% level. We Elliott-wavers thought we would turn down at that point, but qualitative easing had its effect on the market and up we went.
It’s interesting to note the correlation between the QE segments and the movements of the market.
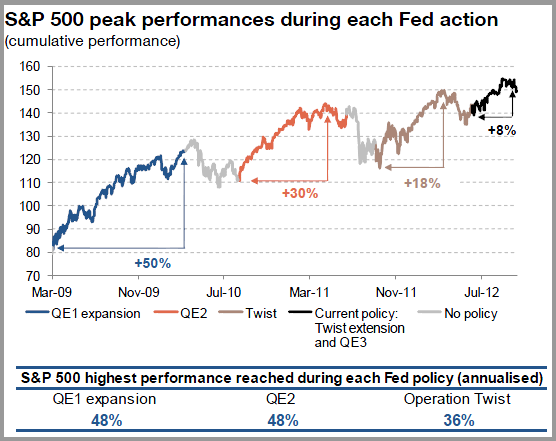
Below is a chart of the various segments of quantitive easing undertaken by the FED, with their dates, so you can see how they applied to the DOW chart above.
____________________________________
Cycles Analysis
This is my cycles analysis from tonight (Nov 3, 2015). You can click on it to expand.
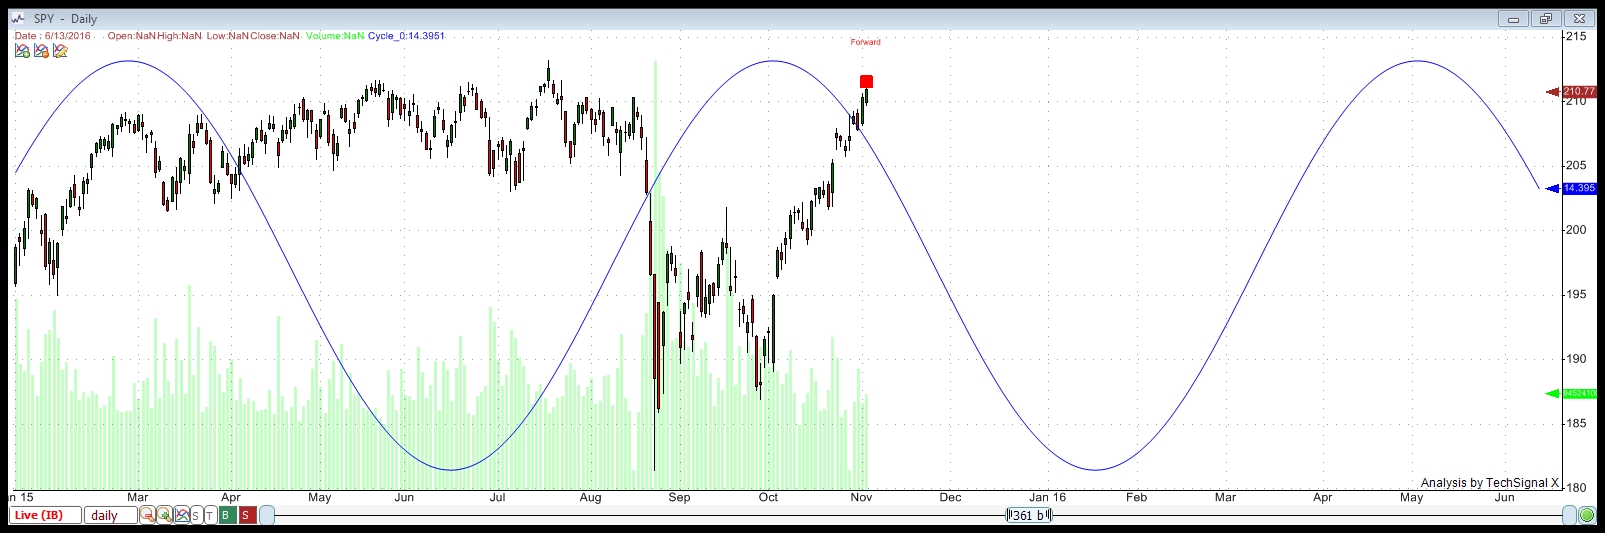
Above is the long wave in SPY. In the analysis tonight, this wave returns the highest percentage of trade wins of the 25 cycles the program finds, trading both the bottoms and tops of the cycles over a period of 12 years. I show this to give an idea of the larger cycle running through SPY (and the SP500) and where we are tonight in relation to it.
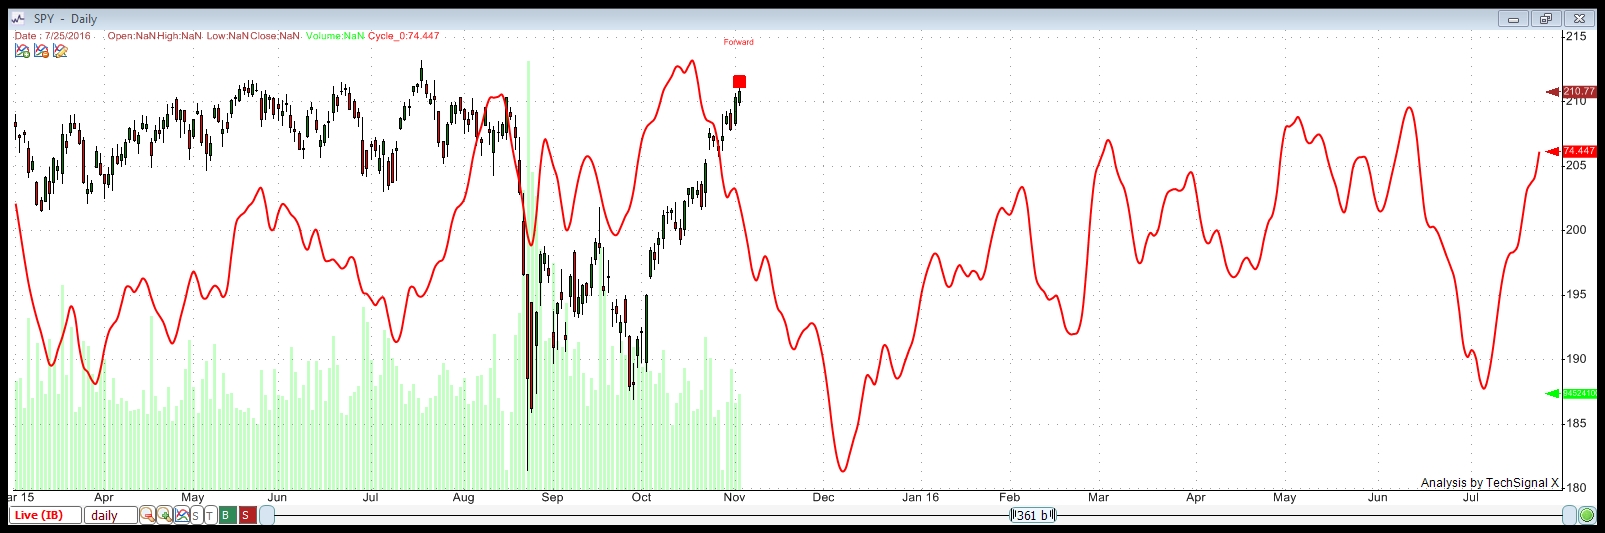
This chart uses a compiled display of all the cycles the program finds.
This cycles analysis uses Techsignal X from the Foundation for the Study of Cycles. I’m using data going back to 2002 this analysis of SPY (SPX) and displaying a compilation of all the cycles the software has found over that period.
This analysis suggests a cycle top of October 19, so we are overdue for a turn down.
It shows a bottom to this set of waves down at December 8, 2015. There are Gann and astro projections for a December 11/12, 2015 bottom from different, very credible sources. I would suggest that these dates are the dates to watch.
Looking Ahead Even Further
You can see on the above chart that we bounce after the December expected bottom. The cycles analysis shows a bounce that lasts through mid June of 2016. This would be consistent with 1929. The fourth wave bounce in 1929/30 lasted 22 weeks, which is about 5.5 months. From December 12 to June 12 is, of course, 6 months. This suggests a similar scenario to the 1929 drop.
I’ve gone a little deeper into what the analysis is telling me on a separate page. Here’s a more in-depth explanation of what this chart is suggesting.


This weekend I said the bounce could last into May, but some people got upset by this. Seems like your new analysis is a great confirmation.
Cheers,
André
I think it’s hard to conceptualize the size of this drop and the following bounce. And maybe it won’t happen as I’ve explained, but we’ll see …
Great post Peter. Informative. Also, a hat tip to Andre’ who I believe said, early on, to focus on Tuesday & Wednesday.
🙂
This is an interesting interview on the markets and cycles.
Jeff Berwick of The Dollar Vigilante does an interview with Bo Polny.
Thought I would share it : )
https://www.youtube.com/watch?v=B5e56ISoJ7g
The interview was done on November 3rd 2015
Thanks Gary,
very interesting
Good. A new low on SPX. Promising.
Yes!
And THIS is a massive eye opener!!
Anyone ever seen this data? Cycles abound…
http://www.zerohedge.com/news/2015-11-04/most-important-chart-youve-never-seen-tax-receipts-top-tick-stock-market
Dmitri,
I do not yet like the look of this market. I don’t know that we’ve properly topped.
It may just be currencies. They’re not cooperating. I think they’re bottoming and about to turn up. USD/CAD is in a corrective wave at the moment. I want to see a new low here in ES.
Yes, thank you NQ. Starting to look better.
Much, much better! We’re on our way …
I find this downturn very interesting right now. We are declining when most all other global markets are (were) up strongly. Out of nowhere the DAX is down 100.
Not sure what you all watch other than a trading interface. This free site has live real time futures and indices. I’ve compared it to my broker interface and it is pretty much tick for tick.
http://www.investing.com/indices/major-indices
http://www.investing.com
Peter,
Based on the updated charts on this thread, is SPX 2079 still the number for trend change confirmation?
Thx..
Yes. We could bounce there and do a second wave. We’ll have to wait and see. But we want to get below that number.
I see GDOW made 62% this morning and immediately turned down.
I’ve now found the main Gann angle. From 5/20 till 7/20 was 360 degrees. From 7/20 til 8/23 was 180 degrees. From 8/23 til 11/4 was 360 degrees.
This confirms 4/11 is a major cit. 180 degrees further brings 12/14/15 and 360 degrees brings 1/25/16.
Today is the big turn. Tomorrow they will all know.
Cheers,
André
Thanks, André!
SPX is crossing a trendline at the moment from the bottom of wave C to the top. Dropping below it will be another confirmation sign.
2100 SPX is the magic number for this trendline.
2098 is cardinal.
Peter and André,
Now that we have hit 2100 and 2098.
Is the idea that we will go below them and come back up for a test (“kiss”) and then fall away to the downside?
thx…
If you mean back to the trendline, yes, typically we test major support.
In this case resistance!
Peter,
Do you still have any concern that we may not have topped properly?
I’m not a huge fan of this market so far. We have overlapping waves, although the subwaves seem to be motive. I don’t know if this is a fourth wave and we’ll somehow find ourselves back at the top to test it, or not.
If it keeps sinking, fine, but be careful we don’t head up all of a sudden.
A bit perplexing for sure…
We penetrated 2098 and now we are above 2102…
Not what I expected to see.
Top should be top! The move down swift and violent.
We kind of got that going this morning.
We’re testing the trendline. I fully expected to be where we are. We just don’t want to go any higher than this.
It looks to be corrective.
We are still above the trendline
I just got out. I think we’re headed back up. It’s weird because the waves down themselves are in 5 but the overall wave is all overlapping, which is corrective.
There are 5 waves up in futures and SP500 – haven’t checked the rest. So that suggests we’re going back up to test the top, which figures. This is a major top. It likely needs to be a double top. I was also worried we didn’t top properly. ES missed the double top by a few ticks.
We wait another day. Gary’s right—we should see a motive move down with momentum.
Currencies appear to be in the process of bottoming, so this may be part of the same indecision.
do you have an alternative sq9 ? or of course I’ve, but my cardinal is 2094 (if i start with 1 and step 1)
I’ve been in this game since ~1977.
The only explanation I have for these recent markets is HFT. When you have computer algorithms buying and selling rapid fire in huge volumes it takes away from the normal buying and selling emotions of humans.
In the 1987 era when a “top” was reached based on Prechter’s counts, that was it. There was NO mistake. It was the definition of “reversal”. Same goes for a bear ending and turning bull. Swift and violent.
Then there is the “President’s Working Group on Markets”. Otherwise known as the “PPT” (plunge protection team). If you have the FED with unlimited funds and they can buy stocks / futures at will, you will see these crazy moves. And we HAVE seen these crazy moves lately. Like yesterday!! Today, we were down 90 on the DOW after this huge run up. How can we only be down 11 and above the trendline? We were solidly below Andrés 2098 number. How can we be at 2102? We need to get a handle on the “new way” these markets behave. Sounds crazy but, it’s also like there is this group or super computer that knows full well what the support / resistance levels are and they intentionally violate them. I used to be able to trade trend lines alone! I never use stops anymore. A stop loss is a “take loss”. Like you don’t think there is a market maker with a DOM watching those stops go in? Like a gift to them !!!
Good luck all… We should be there. All markets correct. Sometimes we just have to really WORK for it : )
To me, it’s simply a 4th wave, which we should have anyway. There’s a count that suggests we need one more wave up to test the top. Doesn’t change the technicals. And you can’t miss the top by a couple of ticks. That makes it 3 down. So, I really don’t see anything out of the ordinary here, except that it’s unusually slow due to low volume.
It also look’s like there is an inverted head and shoulders forming which gives us a target of 2115 from the current neckline of ~ 2106 on SPX.
Moon at apogee 11/7; gives some short term support. Expect consolidating markets; waiting for jobreport. This might be the trigger.
Cheers,
André
Also 11/7 Gann potential turn date, 11/8-11 historical important period for change in Major trend, Bradley timing and Dow Jones timing on October low and May high gives 11/7-8 on 180 degrees.
I’m sure you guys can give additional reasons but it is clear this weekend the last support vanishes. Next week looks promising. Patience my friends; the end is near.
Today heliocentric Jupiter opposite neptune; could create major bottom for gold.
The DJ1929 gave 3/9/2009 in the 167th cycle. Now this system gives 11/8 in the 174th cycle.
This means there are 7 cycles from the 2009 low (+/- 3days) to the nov 2015 high.
Gann considered 7 to be a holy number.
Now very convinced this weekend will be in the books for a long time.
Now I understand. DJ2000 gave 10/26; this should have been the high. But next weekend is a magnet. Last 2 weeks very low volume. 10/26 must have been some kind of 3rd wave and since then a 4th and 5th. Now in last legs of last 5th, targeting this weekend.
Job report will be disaster and the trigger for the decline.
If ( I REPEAT IF ) we take the high of 3rd Nov , then next stop will be ES 2152 – 2155 .
All other stops before that will be short lived.
9/17 High @ 2011.75 Minus 8/24 low @ 1831 = 180.75
180.75 X 1.618 = 292.45
292.45 Plus 9/29 Low @ 1861 = 2153.45
Regards
AZ
now stock 50 futures gave a double top (3 points higher than 1 one) and ends exactly on my measurement foor neptune/jupiter. Like andre mentioned today opp. helio neptune/jupiter, 2 major planets for behaviour stoxx 50.
Major turns only happen when price squares time. S&P at 2120 would give the third time price squares time in the last few weeks. Watch this level. would confirm the analysis above.
André
but I think that friday is the high/turn, so maybe they bring them some higher
I agree on Friday and a little overshoot is always possible. In that case a close beneath 2120 would seal the deal.
>andre > I have 2098 on my cardinal ?? Do you have an alternative one, or ??
Are you folks giving up on my count before it’s even been tested? 4/5 should be the turn date and we’re fresh out of waves. You only get five. Currencies have turned, gold is at an inflection point, and all the wave lengths are perfect. Hmmm.
Now if you also zoom in and look at what happened overnight in futures, you’ll find another five waves mounting up. They’re trying to mount up, at any rate, but they’re really weak. You can look at ES, for example. As I write this, we’ve done a first wave, second and three waves of the third, we’re in the fourth, and we have one tiny wave up to go …
And GDOW yesterday hit 62% and immediately got rejected. So I’d say there’s some evidence here besides my wave count.
That’s my first look, at any rate.
of course not, peter. I gave a date I get another way, that’s about time. Your ew is about price. And…. I wanted to introduce the stoxx 50 a major indices, besides the dax, in europe (with the 50 biggest firms in western europe)
I’m having fun with you … 🙂 Not to worry. But this should be it.
Wow, lots going on. Look at USD/CAD oscillating up and down and GBP/JPY had a big dump.
AUD/USD has done one motive wave up now, should do a second wave then head up for a long time …
All on 5 min charts.
There are very serious things going on globally with regard to asset protection. This is what you see in currencies. It is also what Armstrong is talking about with GLOBAL money seeking safe haven (US Stocks, Bitcoin, Gold). I would think gold and silver will move soon.
Look at the Bitcoin price at the link below. Seriously!!!
Bitcoin launched in the middle of October right when US stocks took off. The German DAX too…
You won’t hear about this on FOX / CNBC !!
I have it on good advice that when Bitcoin passes up through $408 for the third time (today?) silver will start an epic move up! We shall see… I was told this in 2013 ~~~
https://bitcoinwisdom.com/markets/bitstamp/btcusd
Yeah, been following bitcoin on zerohedge.
Major currency pairs are positioned to do a huge 62% retrace of the first wave down … CAD, AUD particularly. Not sure how far eur/usd will go, but they’ll likely last as long as the equities drop. GLD has signs of life. Still long.
The interesting thing to me is that the entire market is now moving like a convoy, based on debt deleveraging. Currencies react to equities and vice-versa. It’s been growing closer and closer over the past couple of years and in the last few weeks, all my charts pretty much oscillate up and down together …
Looks too deep for the third.
It’s already overlapping with the second
Sorry, looks too deep for the Fourth
Well, it is.
You got your wish. However, right now NQ looks like a triangle, so we may get a few more. All it does is prolong the topping process. So you may be right on the nose playing with other dates. I don’t really see triangles anywhere else, but we’re obviously struggling to make this top.
If we break to a new low, that’s a different story.
Not sure what you’re referring to but I’ll guess it’s ES. This is the fourth. It’s a corrective wave, so overlaps don’t matter. They only matter when you’re going with the trend. There needs to be 5 waves up, but they can overlap, just not go lower than the previous one.
sorry 2094 ipv 2098
Sjoerd,
There are two ways to look at it. 5 times 360 degrees is 1800. So S&P-1800 gives another number. My 2098 is 1800 +298. 298 is cardinal.
ok, i do understand
Hmmm DOW up 60 to down 60 in 30 minutes. The DAX from up 100 to flat.
Solidly below SPX 2098.
On the way maybe?
I would be wary of this move. It’s down in three waves to just about the 38% retracement level of the previous wave up. I think it’s just the continuation of this fourth wave. Anything to keep us waiting.
Yeah, measuring:
SPX down to 38%, ES down the 38%, NQ down to previous 4th. This then should head up to top out, I think.
I don’t know. I keep thinking about what andré said yesterday about today….
###
andré November 4, 2015, 8:47 am
I’ve now found the main Gann angle. From 5/20 till 7/20 was 360 degrees. From 7/20 til 8/23 was 180 degrees. From 8/23 til 11/4 was 360 degrees.
This confirms 4/11 is a major cit. 180 degrees further brings 12/14/15 and 360 degrees brings 1/25/16.
Today is the big turn. Tomorrow they will all know.
Cheers,
André
I don’t disagree with that. Now’s not the place to get in. My count says we’ve essentially topped. But we do need this final fourth/fifth up to test that high. This is a trap … so far.
Whatever it is, we have just easily broken the uptrend line
If we head up from here, it’s wave 4.
If it is wave 4 of lager degree than we’ll go to the previous all time high at 2135
No, it’s not larger degree. To be a larger degree 4th wave, we have to come all the way down to 2017 SPX. This is just correcting the last leg up – the 5th wave.
What was the previous wave up to 2010ES in this case?
I thought it was 5th wave
The last subwave up must be the third of the fifth. So that quasi-triangle that I thought was the third of the fifth must have been part of the first wave, which means we had an abc second wave (actually two second waves). It was a very strange configuration. In countertrend waves, they don’t have to be perfect, so they’re harder to decipher sometimes.
I’m just looking at it now in SPX … really strange looking wave. Looking at it again, I would still label it the way I did originally. The new configuration, though, would mean that the first wave was exactly the same length as the third wave, which is OK, just not the norm.
We’ll have to see how this wave ends up before I attempt to move any labels around.
Now 1st good motive wave up to the uptrend line
Corrective waves are just the worst! I can see yet another way to number this last wave up, so I’m not so sure anymore about 2110. I think we have to keep an eye on NYSE and GDOW so see when they find tops. I think, as André suggests, the labor report will play a part.
Does it mean that you are not sure that we arrive to retrace completely to the top or that it will stop there ?
We have to retrace back to the top – no question about that. It’s after that, I’m not sure. Once I see a second wave here, will have a little better idea. We should exceed the high by a little bit. I don’t think we’re going much above that level, but let’s see the second wave, cause if this is the final wave, the third should be 1.6 times the first.
We’re certainly having a problem going up. We might need the labor report just to get us there. Not much to go on at the moment. Currencies have also stalled out.
Well, there’s the second wave done. Great place to get in, if I had any desire to ride this through tomorrow morning’s report.
It’s moving SO slowly.
Of course, now that I’ve said that, it’ll go screaming up to the top.
And there it goes! 🙂 You’re welcome!
We’re looking like 2012 for a third wave high and that might also be it for the fifth wave, expecting the retrace to be deep.
That’s in ES.
SPX measures to a test of the previous high, 2116.
That little spurt of hope didn’t last long ..
Let’s see what 8:30 am EST brings. I’ll be up early to see if there are fireworks. We will still need the open for the cash indices to top, as they have to do that.
This last wave down is also missing a second wave, so it’s not motive, either.
I’m referring to SPX here. The futures actually have that second wave.
There’s one more option. If we go up 38% and then turn down to a new low, then we’ve topped. This wave down in ES and NQ is exactly 1.6 X the length of the first wave. However, the first wave is overlapping and doesn’t look correct as a motive wave, so that wouldn’t be my first expectation. I expect the market to return to the top. If we get past the 38% retrace point (ES2092), then the next stop should be the top.
We went back up through ES 2092 w/o even pausing! I guess ideally we will come back down to 2092 and then move back up.
This angle is real and dominant. It is tied to the 2014 October decline. But other timing tools point to this weekend. That may cause a little delay in the turn. But 12/14 will be the first serious target. You can count on that.
Cheers,
André
Are you looking for ES 2110?
Yes, because we have 3 waves down. We need to correct that. If we don’t, then this is a fifth wave truncation and they’re extremely rare. This move hasn’t necessarily confirmed that 2110 is the top, but I would guess that to be the case.
2120 would validate the time square price. This is needed for a turn. Wouldn’t be surprised when that level will be touched tomorrow shortly before the job report.
We should go up in 5 waves.
Wow, it seems to have all lined up. Motive 3 down finally underway.
AAII bears lowest since February. All it took was as 12% $SPY rally in five weeks.
The avg Nov over the past 20 years tends to start strong (check) and turn weak for the next week or so. $SPY If we are going to have this correction, it will be done with by the middle of nov
I will be going fully long around the middle of Nov into year end. I am not going to wait a round around for this severe correction after Nov 15th. To much interference by PPT. For now, playing the swings for the moment. All the best every one.
Bitcoin has just moved above $408 for the third time since Nov., 3rd.
Silver should start a serious move up from here. The primary forecast is the 3rd week in November for silver to go up. Technically Bitcoin needs to now also go above $428 for the third time. I am going to go out on a limb and “assume” bitcoin will go above $428 in the next few hours.
I have a personal excitement and interest in this as it was forecast in 2013.
Silver should make new highs around $60.
Eventually, perhaps, but this wave up should be a B wave, so silver should make $36 and then back down in a C wave, like gold, imho. After that, a big rise.
Still, this next wave up should be a good one for both.
Peter, could we say that SPX is working on the Wave 1 for which you gave the example of a 2-part structure, and we are in iii of the first part of the Wave 1?
rather, iii ended at 2090.41 followed by a small iv, and now we are in v/3 of Wave 1?
Here you go, whitemare. Maybe this will help explain it.
https://worldcyclesinstitute.com/whitemares-chart/
My next post, if we haven’t yet topped, will be titled, “Waiting for Godown” 🙂
No Peter,
“Waiting for Godot” is better.
It is a famous absurdist play by Samuel Beckett, where two guys during all the play are waiting for somebody called Godot who finally has never come
Sorry, I’ve just realized that that was what you wanted to say
Well, for anyone who didn’t get it, now they will! haha.
Here’s my chart of the day: AMZN
https://worldcyclesinstitute.com/chart-of-the-day/
Ripe for the shorting. (I might wait for a first wave down, mind you).
You know P/E of AMZN – 928 !!!
Wow! Well, it won’t be there very much longer!
I re-labelled the SP500 chart as best I could and placed at the top of the post. We ended up with a great big triangle right in the middle of all the cash indices right at the end of the day. Indecision.
Large bullish triangles on ES, NQ. Double bottoms on cash, except SPX, which also has that triangle. 60 min charts.
More of an ending diagonal pattern in futures.
Fascinating battle at ES 2084. We did go down to 2077 and now we are back up testing 2084. Perfect action. We either break back above 2084 and play the top game or go down for real this time…
So, Peter,
You think it’s a beartrap?
Yup. Nothing has changed technically from yesterday.
The pattern is a triangle and that warns of a top very nearby.
We could be in this fourth wave for a while longer. It’s correcting a very large wave up. It could also come down a bit further. Not a market I want to be anywhere near until it sorts itself out.
As an ending wave, though, it should go up in five waves.
Peter,
for the 4th wave of the 5th it is rather long and deep overlapping already not only with the 1st of the 5th but also with the 1st of the 3rd
Is there a question here?
The question is what is the limit for that?
Dmitri,
I’ve re-labelled the chart at the top of the page for the SP500 based on what we’re doing and after a good look at the structure. The ending waves, when they get this small, are a challenge.
We’re trying to figure out what size 4th wave we’re doing and I think it’s the smaller one, with a bottom somewhere around 2079. It doesn’t necessarily have to get there, but it could. Then we should have a 5th wave up to the top. That’s about as much as I can tell you.
Currencies had not quite bottomed as I had thought and it looks to me as though we’re in the process of doing that, which will likely take the rest of the day and maybe Sunday. All I can say is have a little more patience. It will take as long as it needs to take. I don’t know more than that …
Peter,
I think we shouldn’t pay so much attention to the currencies because they depend of a lot of other things. CAD is typical commodity currency that depends more of the price of energy. EUR and JPY are now funding currencies for carry-trade which inflows and outflows depend mostly of fixed income instruments and reserve requierements
I’m paying attention to them because I’m trading them and I see correlations. The dollar rules pretty much everything.
And how do you see now graphically the gold?
Gold has come right back down in 3 waves. It will either bottom and head up, I think, or head up from here. EWI reported Wednesday that gold was at about 8% bulls.
Too many bulls yet. 🙂
You know last week the ratio of open short positions at COMEX to the registered amount of gold was at historical record about 290
wow, thanks. I see the erratic waves.
Another problem is that the big spiky wave (that was missing wave 2) has also backed up into the area of the first wave. A fourth wave (if that’s what it might be) can’t legally do that. You have a have a clean third wave down with nothing spiking back up into the first.
Other than those two things, it would be fine, actually. It doesn’t otherwise break any rules.
No, because of the overlapping waves. It’s not a motive wave. But otherwise, good to ask the question. NYSE is closer but it’s missing a second wave in what would be the fourth (and they all have to be motive, anyway). And they’d have to have momentum.
As we get closer to a top, I’ve noticed for some time that the corrective waves get more motive-looking as we get closer.
Peter, Have you looked at the Shanghai Composite ($SSEC at stockcharts.com)? Is it violating wave rules for a downtrend and starting to look like the big drop was 3 waves? Also $BVSP. I’m just wondering if some of the foreign retracements in general have gone too far and could serve as an indication for a longer term run in the U.S. Thanks!
Paul,
I can only see a daily on SSEC but it looks like 3 down to me, and if that’s the case, it should fully retrace. BVSP is not motive at all – overlapping waves all the way. It too, should retrace.
Wouldn’t that imply that the emerging markets are ready to take off to the upside? Would that reduce the probabilities of a U.S. market decline?
I’ll leave that for you to decide. I try not to mix fundamentals with technical analysis.
Saturn in Saggitarius should be bullish for gold and bearish for equities. But slow movers need a trigger. This weekend we have a Saturn shadow date. That could very well be that trigger. At the same time Venus activates the solar eclipse, and Maqrs will do so next week.
We are now in the last hours of 5th wave, so everbody should be bullish. But that won’t change the inevitable.
What the market does today doesn’t matter, we are in the final countdown.
Gann systems do work, but there are several active at the same time. DJ1929 could be considered the crash timer. And it says 11/7.
Keep the faith! The force is with you.
André
Hi Andre,
Could you please explain to me how you get the Nov 7 from Dj1929 crash ? Could you back-test Oct 1987 crash with the same model ? Thanks.
Hi Peter
For what it’s worth despite my bullish bias
This market looks stretched up here . The 5 day and 10 day and 30 day advance decline line has turned down
On top of this the 10 day and 20 day occilator on the Dow has hit it’s upper range and turned down
I have many indicators and all of them are showing bearish divergences on a short to medium term basis .
The longer term indicators are only just starting to turn up .
The Nov 7 date is the weekend so looks like Nov 12 yet
The only reason for this market to rise is if it has unfinished business to complete the pattern
Which would imply a move above 18137 .other than that it is looking bearish .
Short term I see no reason to trade to the upside
The best risk reward is now to the downside .
The 16500 area I still see as support which ideally should be tested
I’m not looking for more of a drop than that yet we will see soon enough what the market shows us
Joe
If the DOW closes above 17760 on a weekly basis (today) as per Martin Armstrong’s “bullish election” then the next stop is above 20,000.
Remember, he was looking for DOW 18000 back in 2011. People thought he was nuts…
Thankfully he is also looking for gold at $5,000
To the best of my knowledge his reversals of this type have not failed. That goes back decades.
haha, yeah I know, and he’s got a few decades more to go before he gets close the record of Mr. Elliott.
If you’ve been here for any length of time, you know my mantra: “Trade what you see, not what you think.” 🙂
Oh yeah!
I do get that! But! I do have an interest in other people’s discoveries and methodologies.
Right now what I see is that the ES has tested 2084 for the 4th time since yesterday at 10:45 EST. If we go below that right here and then come back up and test it, I will ADD to my short that has a nice trailing stop going : )
We actually have a chance at ES 2057 today…
2077 1st stop. We will have to see the reaction there…
Someone had posted this earlier.
Look at November 6th !!
http://bradleysiderograph.com/donald-bradley-siderograph-2015/
Is this a reverse Tepper moment? Early in this bull market he said it was a no lose situation. If the economy was bad, more QE, ie good. And if the economy was good, that would be good. Now, good news was announced and apparently that is bad, If it were bad, I am not sure that would be bad but likely. Probably why we should stick to Elliot and cycles.
🙂
Solar wind shows a fast stream that could be the CME shockwave. Magnetic storm watch begins.
Hopefully this will finally be the catalyst for the shifts in the markets if you are bearish into next week. Good luck to all.
Woke up this morning feeling like a Large Mack Truck hit me. Enormous amount of pain in my body. I have noticed very often, when we are about to receive a CME Shock wave, my body feels it. This should be the major turning point in the markets. Next week we should finally get a sizable correction. I am not in the Ultra bearish camp, although I expect a correction in the markets next week. All the best every one.
Not wishing you any more pain, but yes, it would be nice to see a sizeable correction. It’d be nice to see someone in the market. 🙂
For anybody interested, I now have The Market Timing Report available on the site at a terrific discount. It’s endorsed by Harry Dent and others. It provides high probability key cycle dates for major indices, oil, currencies, etc.
You’ll find lots more info here: https://worldcyclesinstitute.com/market-timing-report/
You can also download the October report free.
The $SPX is about to be up 6 straight wks. Has had a 6-week win streak for 6 straight years now. Last time it did that? The ’60s. $SPY
Scary stats!
Volume continues to drop …
Next week is key the markets have to drop like a stone in away like 2008 if it does not happen I think we will continue high volatility in a big trading range that is the strategie of the CB banks
I m very curious what will be the trigger.
In 2008 all the big declines were starting around new moon (nov 11)
EWI also is pointing to early next week as the start of the decline. The question will be how far. They have a proprietary indicator that turned negative yesterday. We have overlapping waves in 3 so far, so we need to at least test the most recent high.
Everything is at extremes. Currencies seem to be bottoming finally, gold is also at an extreme. We’re ripe for the whole works to change direction in tandem.
Peter,
I has to happen between Nov 11 and Nov 24
New moon and full moon and also bradley points..
After that a further decline into Dec..
Cheers
John,
It will happen early this next week. I’ll update my post this weekend to show some of the extraordinary charts that are all moving in tandem. For example, you can look a the dollar chart and see how it’s closely correlated to the equities. I already have a small chart showing it. All the dollar currency pairs are bottoming this weekend, getting ready for the big move.
Prechter referred to this as “all the same market,” based on debt and in the last couple of months, the everything has moved into lock-step.
Here’s preview: https://worldcyclesinstitute.com/currencies-and-equites-in-lock-step/
Thanks Peter,
I m curious what you are expecting for the coming weeks.
John,
I’ve had an entire morning of trying to get around Macintosh system bugs, so I may be limited in what I update today. Honestly, there hasn’t been a change over the past couple of days, since Nov. 3, so anything I add now will not add much to the big picture. Expecting a turn down in the equities, a change of trend in currencies.
What we saw last week was Gann at work.
11/4 was a major date from the dominant angle, and that predicts 12/14 – at least – for a low. S&P set the high 11/4.
Another timer gives 11/7. Nasdaq chose to follow that timer and kept S&P from falling. See what Baba and FB did Friday night. Techs lead the way…..
All I can see now is that all my Ganntimers give a change in trend tis weekend.
So, one scenario is definately that S&P does a pull back to this weekend – a retrace- but without the energy to create a new high. A failure (truncation) is possible but unlikely.
This would mean things could speed up (down) next week.
This weekend we have Saturn at shadowdate. Longterm gravity basically gave the high december 2014. But then we had a Saturn entry shadow date. Could this have caused the inversion? 11/8 we see Saturn exit shadowdate.
Venus activates the solar eclipse this weekend when mars/Venus/North node are conjunct at 180 degrees. And the nodes square Polaris. Seems like a rare alignment
Solar change in trend, major tidal inversion, Bayer rule 38.
Everywhere I look I see this weekend targeted as a major change in trend. Remember DJ1929 was the high before a major depression. And DJ1929 gives 11/7.
The square of nine on the Puetz window gives 11/8 as a cardinal date.
I maintain my outlook : now down into 12/14. Gold/equities/currencies/treasuries : everything will reverse next week. That’s what I think anyway.
Nice weekend to everyone.
André
HC Jupiter 180 Neptune (11/5) and gc Mercury 120 Neptune (11/6) indicate a low in gold. With just 1 day difference in timing a very strong confirmation. And confirms the analysis above.
The first leg down towards April 2018 will be down at least into March 2016. So the december timing is a minor leg. After March up into june.
A good interview with Paul Graig Robberts:
If the markets are rigged like I said before than the next decline will be bought by the CB banks again..
http://kingworldnews.com/paul-craig-roberts-corruption-propaganda-and-why-the-u-s-government-wont-answer-my-letter/
Hi Peter
Thank you for your update of Saturday 7th Nov.
What if the market test the latest top at 2116.48 but doesn’t turn down ? do you have another possible target to reach ?
Regards
AZ
No. As I’ve said the count is complete, indicators and cycles call for a turn down here. This fifth wave may exceed the number you cite for the SP500, but only modestly. As I’ve said and shown, the dollar appears to be topping and all currencies bottoming at the same time. Gold also appears to be bottoming. We seem to be setting up for a major market turn.
Peter,
So euro/dollar will turn again and may visit the august 24 high?
The euro/dollar has not retraced even 38% yet, and as I maintained with the NYSE, for example, those Elliott Wave targets are critical (it has to retrace to 62%, as did GDOW, before we could contemplate a turn for equities in general). I’ve also been watching the euro trade inversely to the equities for several months now, so I have no reason to think this will change in the immediate future.
FWIW…
After having double bottomed in late Aug and late Sep, the stock Indices have all rallied… some attempting to test their all time highs such as the $COMPQ, $DJIA (~8270 resistance), $SPX… while others such as $TRAN, etc have rebounded less than 50%.
Based on over 17 years of observation as commented before, those that rely purely on TA analysis with the advantage of hindsight have continually been forced to adjust their counts. In my experience over those years however, using a combination of TA, Macro-economic Fundamentals and confluence of Cycles allows the advantage of corroborating one’s conclusions of price/time projections in the various market sectors (when all three are in agreement) to significantly increase the odds for success.
Sparing this group a discussion of the fundamentals which I do on a daily basis at another group (as many insist are noise, but as demonstrated over 17 years are extremely revealing of the big picture for anyone capable of correctly interpreting them), and instead focusing on a combination of the other two disciplines above, the conclusion is for the next bearish leg down in the stock indices (a much more significant decline of 50% plus) is (most likely) to commence sometime after December 15th (after bottoming late this month in November). I’ll be watching the $TRAN followed by $DJIA, $NYSE, and other indices to begin a sharp drop into that bottom starting in about a week or so after a mid-Nov cycle high… then the next rally peak into approximately mid Dec before the next big decline begins…
Given the Dollar’s performance based on the current Fed-induced market perception, its final peak should extend into early 2016 after its late Aug and mid Oct lows and subsequent rebound. In the interim, it should have seen a minor top on Friday or be topping tomorrow on Monday with the likely hood for its next projected brief nadir to occur in the 3rd week of this month (based on a confluence of cycles, TA and expected reaction on Friday’s jobs report).
The big trade however… the most highly leveraged and lucrative, the Gold Complex (including Silver) that saw an intermediate high in mid Oct from the projected late Jul low of 1072, experiencing a weekly downtrend should be bottoming early this month (combination of a confluence of cycles and TA corroborated by in depth fundamental analysis). For a brief example, pulling up a weekly chart on Gold, one can see the exact timing of the 17-week cycle (1393 Mar 17, 2014 High, 1347 Jul 10, 2014 High, 1130 Nov 7, 2014 Low, 1141 Mar 17, 2015 Low, 1072 Jul 20, 2015 Low, and Friday’s 1084 Nov 6 Low…). I also use a charting method that has predicted all the big drops in Gold going back to the 681 Oct 24th 2008 Low to within just 3-trading days and on several occasions, the day of the final bottom (as in the Oct 2008 low). The last two big drops (Jul 17th, 2015 and Friday Nov 6, 2015, were both predicted the day before using this method where bottoms are generally formed within a few days to a few weeks (sometimes double bottoms like 2008).
However, based on the big picture macro-economic fundamentals laid out in detail in the late 90s… 2016 is scheduled for Gold’s big move… although the Dollar is not expected to top until early January, Gold will at least consolidate its current nadir before the expected new advance in late Nov and the much more significant advance to take place commencing between mid-Dec to early 2016. As in the past two decades, the “Cash is King” Dollar Bugs will be proven wrong yet again…. count on it. And yet again, few if any of the “Charts Tell All” TA “experts” will learn from this (just as Prechter was wrong about his $106 Gold call, Armstrong in all his late 90s calls (all subsequently removed from his PEI website), etc… As always… we will see.
Hi Joel,
many thanks for your toughts. Can you recommend a specific software that makes analysing cycles easy ?
Have a great week.
Jaze
Hi Jaze… I used to follow various software and websites that analyze cycles many years ago while a member at CSU Long Waves forum and the original Kitco K-1 forum, but have since lost interest… just using stockcharts.com, I track cycles to see their significance. I also study market fundamentals and the history of patterns that continue to repeat. This helped me to identify the day of the secular bottom in Gold on Oct 24, 2008 (as posted in great detail at capitalstoole.com) expecting a retest and positve divergence in the Gold stocks as occurred at the past secular lows in 2001 and before. I also predicted the Mon July 20th drop in Gold the trading day before, Friday (based on my proprietary indicator) and identified the July 24thy bottom with the expectation of a “W” retest to come and a positive divergence in the Gold stocks… we got that on Thur Nov 12th and the positive divergence of the Gold stocks which I cover in detail with charts… most importantly confirmed by (what I believe and has been) a correct interpretation of the fundamentals (that almost all chartists consider noise). If correct, this will be the third time I have been right at a secular bottom while others remained skeptical. My in depth analysis of the market fundamentals explain why the crowd will be proven wrong on the markets yet again… imho.
I have a question for any who wish to comment. While my understanding of EW is minimal, I am trying to pull myself up. My understanding is that RN Elliot stipulated that there is an A-B count, while Prechter dismissed it as being wrong (as in never occurred). My understanding of an A-B is that it occurs after a completed 5 wave directional move (of whatever degree, impulse or correction), and it allows the market to ‘reset’ in order to change direction and/or have an acceleration of trend. These are my words (based on a very minimal understanding). I am sure there is a lot more to it (assuming I have any understanding at all). The reason this may be important at this particular time is that in looking at the futures (ESZ5) on a 10 minute basis, the market action from the pre opening of November 5 seems to show a lot of overlapping 1, 2 (or A, B) type waves, with the implications being that the market is resetting for a strong directional move down. Note: I am short and therefor speaking from position. But really, I am using this situation (regardless of outcome) to gain some EW knowledge. Thanks in advance.
Steve,
There is no “AB count” that I’m aware of and I’ve never heard that story. It wouldn’t have any application to ES tonight, at any rate.
The correction down in ES right now appears complete, in a double 3, or zig zag, or as I called it the other day, a triangle. Waves in 3 retrace. We are tonight heading back up to the previous high.
As I write this, it appears the fifth wave has already completed 3 waves and needs to correct in another fourth and then a final 5th up to test the previous high. I would expect the market to turn down once this minor wave is complete.
If you want to learn Elliott Wave, buy the book, “The Elliott Wave Principle.” I’m not trying to put you off, but it’s not a simple principle to explain; it really does take a full book and years of watching the markets to understand it and how to apply it.
From a big picture perspective, it’s simple. Waves in 3 retrace, waves in 5 that do not overlap and “have the right look” are motive and accurately measurable (based on phi). However, there are 21 different patterns in all, so there’s a lot of complexity to it. I’ve never found it to be wrong, but it depends on the analyst. You have to be vigilant in its application.
This is still the large fourth wave we’re completing. SPX 2079 or so is the bottom of the previous 4th. It looks like this fourth wave will be a long, drawn out affair. We have a large wave up to correct, so not unusual. ES may be completing the last leg of its triangle, so a bit further down still to go.
Steve,
Further to your question, here’s one of the areas Elliott Wave really gets interesting. While this is mostly likely a fourth wave with a triangle, there’s also the possibility that we have a first wave down. A leading diagonal is a rather contentious pattern, but here’s more of an explanation: https://worldcyclesinstitute.com/leading-diagonal-2/
We’ll have to see how the next few hours play out.
Steve,
I think I found what you were referring to when you identified an AB ending wave. You’ll find a few paragraphs on this on page 58 of the Elliott Wave Principle. It relates to what Elliott called “irregular tops,” but what Prechter thinks are extensions of waves (and I would have to agree). I was challenged with this at the top of the SPX wave ending at 2116, where there appear to be two waves in what I’ve now labelled as a third wave. However, I think it’s correctly labelled, as we seem to be experiencing the resulting fourth wave.
I also found reference to an A-B base that Elliott came up with but that appears to be when he was attempting to organize the Principle around a 13 year triangle pattern. Prechter discounted it, because and A-B pattern would actually negate the basic 3, 5 wave pattern concept of EW.
Thanks for bringing this up. I probably read it a long time ago and put it aside. It’s interesting, but I can’t personally see how an A-B pattern would fit into the EW theory overall. I learned something knew … which I always appreciate.
On another note, it wouldn’t surprise me to see ES do a double bottom here before starting a rally. This one is not motive and looks like it’s rolling over.
Peter,
Any projection for the bottom of wave 4.
Somewhere close by. This is a really interesting formation here. It’s like the ending diagonal that we saw in the first wave down at the top of the market. I expect us to go back to the top, but I want to be alert to the wave up to see if we don’t quite make it and turn back down at 62%. If it’s just simply a triangle then it forecasts the top is nearby.
Currencies still seem to me today to be reversing, so I’m keeping with my major market reversal here … we’ll see what happens in the next 24 hours or so. Need more clues.
Robert,
We should be well into wave 5 now. In ES at the moment, it looks like we’re retracing a small 2nd wave of the third wave up. We should keep heading up tonight, I would think.
I m so bearish it hurts… as good as it is gets
https://www.tradingview.com/x/euomoyNG/
haha … I hear ya. It shouldn’t be too much longer 🙂
I continue to have computer problems and they will likely last another few hours. I am up in the air about this market at the moment. We could be looking at a leading diagonal, meaning the market has topped and we would retrace 62%. Or we will retrace to the top, so watch for a possible turn around SPX2092.
It’s an extremely dangerous market as currencies are bottoming and last night they were all over the place. I have no doubt that we’re in the final stages of this bull run.
Sorry, 2092 is ES. SPX is around 2097.
Well the way I see it the drop has to speed up now especially after the new moon.
Still want to see new lows before full moon (nov 25)
Peet!
Let’s hope that it is almost over with this ‘noise’ run up which shows hopes of people in a continuing bullmarket based on well NOTHING.
Cheers,
W
What I see is a market that has suddenly turned very bearish, very weak. I was watching overnight as currencies are trying to bottom. They’re running inversely to the market. They want to go down and the market wants to go down but has to correct up, so it’s a fight at the moment. I have doubts about out ability to get to a new high and we may be seeing the leading diagonal pattern in SPX and futures. Different in Nasdaq and DOW, so difficult to tell.
At some point we’ll have to retrace a second wave.
Here’s the leading diagonal page: https://worldcyclesinstitute.com/leading-diagonal-2/
I don’t have the ability to post any charts right at the moment.
The waves up overnight in futures and yesterday in SPX are not in 5 waves, which leads me to believe we’ll only have a second wave up.
Wouter,
I’ve been able to capture charts for ES and SPX as of now and they’re on the Leading Diagonals page.
https://worldcyclesinstitute.com/leading-diagonal-2/
Peter, excuse my naivety with EW charting, but looking at your link – https://worldcyclesinstitute.com/leading-diagonal-2/ – aren’t you showing a retrace of 38% of the wave drop, if that is a W1 down, at spx 2086. It is labeled as a 62% Fib retrace. If you want to retrace 62% of the length of the wave drop, shouldn’t the Fib grid be inverted? Or, are you desiring to retrace to a point that is 62% of the way down, rather than 62% retrace on the way back up. If this sounds confusing, it is because I am confused.
Thx
Hi there.
I just now got my computer up and running, so I was hastily working without my main one this morning. I may have the grid upside-down, based on your comment. However, 62% is the reciprocal of 38% and so just flip them in your mind. If I were to flip the fib grip, they would overlay in exactly the same location.
I did this quite quickly this morning with a second computer with a very small screen, so I didn’t really check the layout. Sorry to confuse you. Hope this clears it up.
Hi amb,
I replaced those two charts for you with proper fib lines.
Peter,
I’m seeing possibility of retrace to the 2051 area on ES, which is the 23.6 retrace from
the high and the 9/28 low. I’m new to EW. Does that fit into your wave count.
Thanks
If I wasn’t working on the assumption that we’ve completed one wave down, I could buy into that, but with what I’m seeing now, it’s likely we’ll drop right through that level in wave 3. Wave 1 down still needs to be confirmed, but it seems more and more likely with what the market continues to do.
Yes! Been a slow day. Are you still looking for a move up to ES 2092?
Yes, although it likely won’t get there in today’s session. We seem to be waiting for the eur/usd to do one more wave down and that should get the equities moving up, I think.
If we turn there, ES will head down in a third wave.
Peter-
What are your thoughts on the small gap from Friday’s Close to Monday’s Open in the cash indices needing to be filled before we turn down in a possible wave 3? This takes the indices past the .618 retracement.
Ted,
I not 100% sure this is a first wave, so it may be a moot point. Leading diagonals are very rare and I’ve been fooled before, but this one does look real. I think you’re referring to the Nasdaq? Don’t know yet …
Good question, Peter.
If it was 5 wave down and 3 wave retrace we could be more or less sure.
But with this “rare” diagonal down there is nothing certain.
Are you going to enter at 62% retracement or you’ll prefer to wait and see if and how it will roll over?
Dmitri,
I have another marker. I just shorted eur/usd. The currencies are about to reverse and this is the last wave down for the euro. The equities should top when the eurusd hits bottom. All the currencies are doing this. Now that I have my computer back in action, I’ll run a new post tonight showing you how the currencies and equities are now in lock-step, all based on the dollar (let me be more precise – the dollar pairs are aligned with the equities).
The reason we’re topping now is that the dollar is reversing. Here’s a quick chart I put together to show what I mean: https://worldcyclesinstitute.com/currencies-and-equites-in-lock-step/
Peter,
do you want to say that you short USD against EUR ?
Same thing. If you short the pair, that’s what you’re doing.
Dmitri,
The other thing that’s a pretty big clue is that if you look at ES, it’s clear the first wave up is in 3. It’s got a great big spike in the middle of it. So that suggests that this is a corrective wave. A finishing wave should be motive (in 5 waves), which this wave up is not. For this reason and the overall pattern (DOW simply looks like a first wave configuration), my preferred count is for the first wave down and a second wave retrace.
I haven’t figured out the Nasdaq yet.
Peter,
what is your target for your trade Eur/Usd
Let’s see … I just got in again (I got out at the bottom of the first wave) at the top of the second wave at 1.0714. This is a third wave, so it should go to … 1.0600. That’s from the top of the little spike of the second wave. I haven’t figured anything out beyond that yet.
I’m thinking we should see a top in equities tomorrow. We got about half-way to the 62% retrace level. Even if we have to go to the top, we should get far enough along tonight to get almost to either of those two places. 🙂
The problem with currencies right now is they’re SO bullish, because they’re near a low. So I guess we’re doing a test of the previous high here, although that first wave down looked just fine to me and measured perfectly … unless something else is happening.
Oh, the double top missed by a pip or two … that’s why. I missed it. So the targets are going to change obviously.
I don’t know where I got 1.0600. I think the target for this wave down is closer to 1.065.
There is only one currency extremely bullish now – USD
In its waning hours, though, imho. 🙂
This meshes well with the “American Exceptionalism” myth that is being tested here: the idea that the US can “tighten” monetary policy while everyone else is still easing and it not have a negative impact on the market.
Hi Peter
I don’t have my computer online to look at the internals of the market so just dealing with basic math . a few things don’t add up when I look at the Dow daily chart . I use the Dow because I’ve studdied it back to its begining and to do every index to this same degree is to much work to say it bluntly . bottom line I think this present drop is best labeled as an A wave of a larger A B C decline , could bottom Nov 17 yet I’m not going to focus on the timing at this point .I realize we don’t agree on the bull bear debate , the key for me will be a poke above 18137 on the cash down , whether it be 3 waves or 5 up from the August low is not important as I see it both ways with a bullish outcome , the failure to get above 18137 to me is my warning I’m wrong . the basic wave count formulas I work with are simple , wave 2 and wave 4 should have a time ratio between them as well as price , I’m my count I’m working with both as an abc rally as your count as well as a possible developing 5 wave impulse this present decline has been to short when considering both time and price , a better price level as a 4th wave decline should fall into the range of .382 of waves 1-3 and also .50 of wave 3 , this makes the 17657-16960 range an ideal wave 4 ( if this is a developing 5 wave move which is not complete ) in terms of time there is 2 time counts , counting the sideways move from Aug 26 to Sept 28 ,high to low at almost a month ( which implies the Dec 12 date plus minus )
or the decline from Sept 16 to Sept 28 which is 12 calendar days which targets Nov 17 as a possible low .
bottom line I think were going to see some noise for a few days ( Nov 12 high ? ) I’m not sure at this point .
I’m going to key off Nov 17-19th along with the price range noted above . I don’t see this present decline finished at this juncture ( and I’m bullish )
New post: https://worldcyclesinstitute.com/waiting-for-godown/
I have updated the upper charts and there’s an important section on the correlation of the dollar with the equities. I have left the lower portion as is for the moment.
This website is for educational purposes relating to Elliott Wave, natural cycles, and the Quantum Revolution (Great Awakening). I welcome questions or comments about any of these subjects. Due to a heavy schedule, I may not have the time to answer questions that relate to my area of expertise.
I reserve the right to remove any comment that is deemed negative, is unhelpful, or off-topic. Such comments may be removed.
Want to comment? You need to be logged in to comment. You can register here.