
Update before the bell, Nov 3, 2105
Overnight, the futures look to have completed wave 4 of this final wave so this opens up the opportunity to rise to a small new high to cap off this wave (wave 5 of 5 of 5). Cycle turn dates are today and tomorrow, Nov 3/4.
It also could be the start of a first wave down. That would be if it continues down to a new low from here. The waves are so small, I can’t make out if it’s motive. The safest entry is to wait for a confirmed first wave down and then a 62% retrace in 3 waves.
Update after the bell, Nov 2, 2015
Here’s the ending diagonal in the NYSE:
Today, the market overall added on only a few more points. For example, the DOW added 28 points to the previous high. That’s a minuscule number.
While I had thought originally during the day that all the major indices were finishing up ending diagonals, a thorough review is the wave structure shows that the NYSE completed an ending diagonal, which the other major indices completed a fifth wave. I have re-labelled the charts, as a result. I put us at the top of a second wave. The change today was very small and changed nothing technically in the major indices. We simply added on a fifth and final wave. Tonight, I’ll review the two indices that tell the story: NYSE and SP500.
Again today, volume was weak and the rally was confined to a few high cap stocks. Lower caps stocks (and the transports are lagging badly).
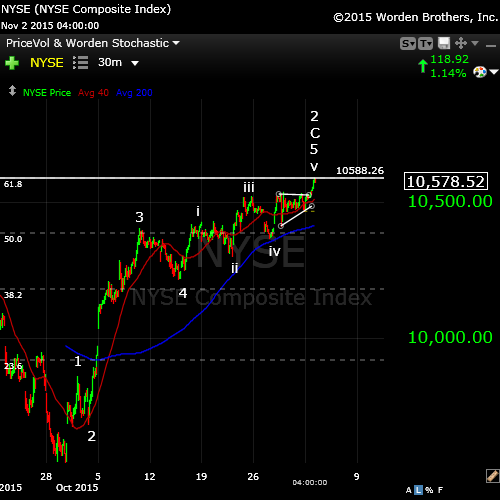
I’ve been somewhat concerned about the lagging NYSE, the highest cap index in the world. I’ve explained before that I keep tabs on it because it’s not subject to the animal spirits that the other US indexes, as you don’t trade it directly. Today, it finally reached the wave 2 retrace target. In fact, I think that’s what the move today was really all about.
The count in the NYSE now is a perfect 5 waves up in the C wave with an ending diagonal (a triangle that marks the end of a wave) that stopped right at the 62% retrace line (the horizontal line on the chart) from the top of the market. This suggests that the next major move down is a third wave. I have drilled down to the one minute chart for the ending diagonal and it meets all the EW rules.
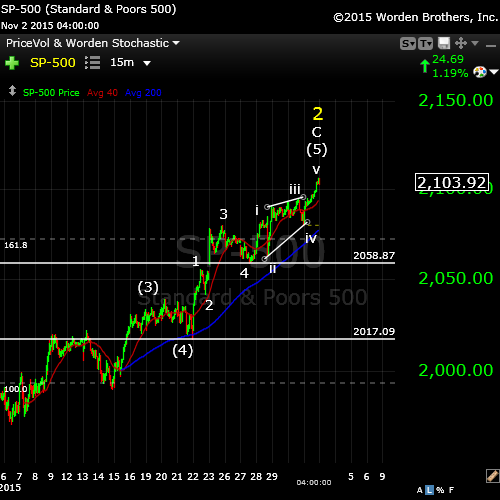
One more chart from today: The SP500 (15 min chart). While at first glance, this appeared to me to be an ending diagonal, a review of the waves on a one minute chart shows that there’s one wave missing of the triangle. It is more likely simply a fifth of fifth wave. Now, overnight, we might see this wave extend a few more points, but both futures and cash indices wave counts suggest that we’re at the end of the line.
The big issue with countertrend waves (even in a 5 wave configuration) is that, at the end of the wave sequence, you can’t count on a specific length to a wave and that makes picking a top extremely difficult. This is not the case on the other side of the coin—with motive trend waves moving with the trend. They have to play by the Elliott wave rules (and they’re very strict).
________________________
Original Post: from Sunday night, Nov 1, 2015
Bottom Line: It appears that the second wave has finally topped. We’re waiting for confirmation that the trend has changed to down. We will have that confirmation after we complete one motive wave down and then turn back down to a new low after a 62% retrace in 3 waves.
Let’s look at what happened in the SP500 on Friday:
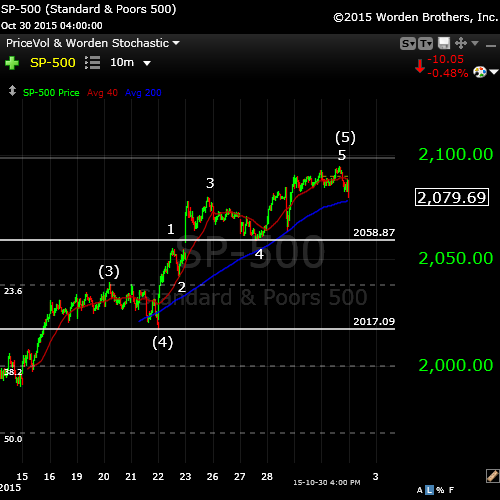
The 10 minute chart of the SP500 shows how we finished the C wave up. The larger pattern is a regular flat, which is a set of 3 waves in a 3-3-5 configuration. In other words, wave A and B are each in 3 waves and the C wave, which you see the top section of above, is in 5 waves. Last Thursday night, we were very close to a top and on Friday, we put in a very small final wave up after a fourth wave triangle.
Triangles in the fourth wave position foreshadow the end of a wave.
Above you can see labelled the final 5 waves of the fifth wave (of the C wave).
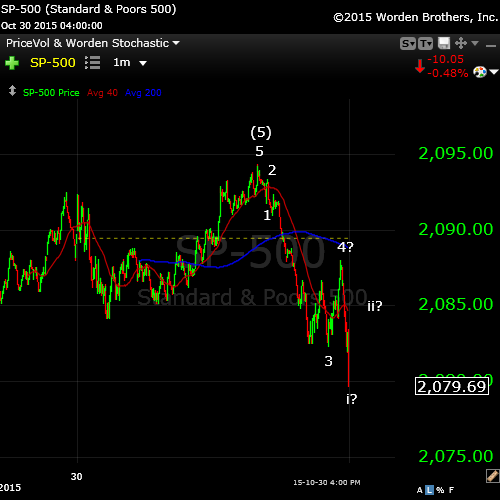
Let’s drill right down to the 1 minute chart in the SP500 to see what happened “under the hood” on Friday.
You can see the top and then I’ve labelled the waves down so far. It appears that we’ve completed the first half of the first wave in a motive fashion. This brings us to the end of the 3rd wave. Then we bounced in what may be the fourth wave. We need another set of 5 waves down to complete the full first wave down.
The first wave should end at the previous fourth wave in the other direction, which in this case is at SP 2058.84. In the ES, that number is about 2050. Once that’s done, we should bounce 62% in a second wave and turn down again. So, we have some work to do on Monday to confirm the change in trend.
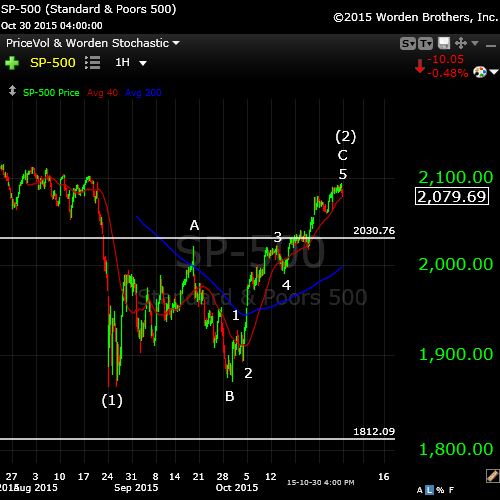
Above is the one hour chart of the SP500 showing the entire regular flat (3-3-5) consisting of three waves (ABC). You can see the final 5 waves of the C wave complete. The entire ABC pattern forms the second wave (2). The third wave down should follow and it should be at least 1.618 times the length of the first wave down (1).
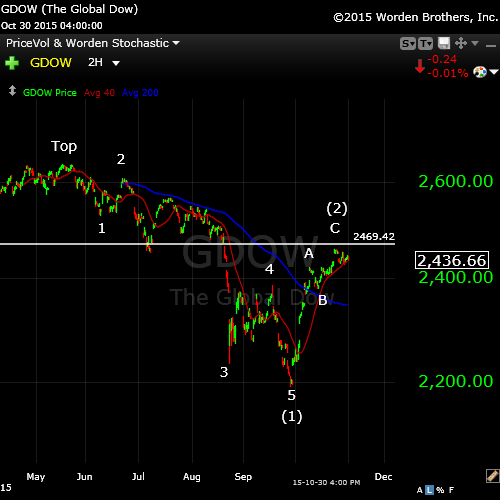
Above is the GDOW (Global DOW). I show this because it represents the bigger picture. The GDOW consists of a set of 150 large international corporations chosen from around the world. It clearly shows a first wave down of 5 waves and then a second wave up in 3 waves complete (or almost complete). The horizontal line represents the 62% retrace level, which is the preferred stopping point for a second wave. The third wave down to new lows should follow.
This index should set the trend for the US market. There are some who believe the US markets have only come down from the very top in three waves and that the next wave down will be a C wave, leading to a very large 5th wave up to a new market high.
The GDOW suggests otherwise. It’s hard to imagine the US market doing something different than the GDOW.
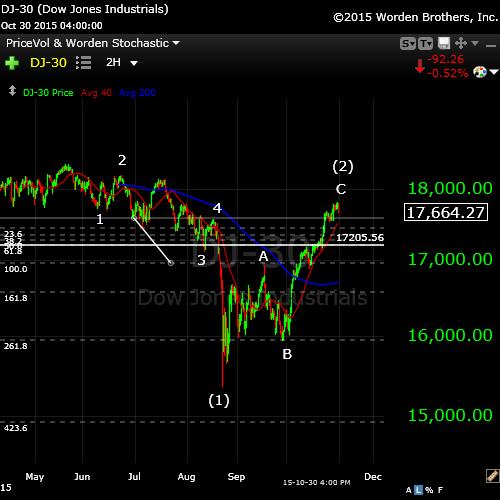
Above is a two hour chart of the regular DOW. Let’s take a look at the structure of the first wave down.
If I measure the length of the first wave down from the top, and then use that length to measure the third wave, we find that the third wave is exactly a fibonacci 1.618 X the length of the first wave. That’s a typical length for a third wave in a motive wave down.
In a full larger first wave (1), the fifth wave down is usually the same length as the first three waves. In this case, the fifth wave has exceeded that length. I’ve place my fibonacci measurement tool on the chart and you can see that the fifth wave is actually longer than 2.618 X the first three waves. This suggests we’ve had a capitulation move. That’s more in line with a first motive wave down that a corrective fourth wave with a fifth wave up still to go. In other words, it’s a very bearish formation.
Besides the structure of the GDOW above, this is another reason to believe that we are going to see a very strong third wave down to come.
_________________________
Making Your Decisions for the Longer Term
I got asked a question today in the comments section of the website about whether it’s important to look ahead much further than a couple of weeks. This is because I often cite my favorite mantra: “Trade what you see, not what you think.” In other words, trade based on how the market is moving now and not what you think is going to happen in the future. It was a great question. Let me re-post my reply here:
First off, we haven’t even done a first wave down yet. And then we need a second wave up to 62% to confirm the trend has changed. That’s part of the “trade what you see” part. The market has to show me where it’s going before anything else happens.
It was like dealing with the fourth wave we had on Oct 26/27 in the SP500. I thought it was the start of the large third wave down but then there was a point on the 27th with overlapping waves that it became apparent we were going back up to the top (turns out it was a fourth wave). That intraday signal in Elliott waves takes precedence over anything else you might have in mind.
That being said, it’s always important to keep the bigger picture in mind. We appear to have done one motive wave down from the May 20 market top and thena huge corrective wave up (reminiscent of 1929 (charts below) and 2007). If that’s the case, and we prove it through the unfolding wave structure, then I want to be able to take maximum advantage of it.
So … to some extent I agree that it’s early to talk about the date for the bottom (it will be much more important in a couple of weeks), but it’s good to have those dates on the table, as it helps me think about where we’re likely going.
For example, we’re looking at astro signals that forecast a December 11/12 bottom to the upcoming set of waves down. This important date is now coming from a couple of credible sources. If we know this and we’ve looked back at historical charts (in this case, 1929 and 2007), then we can make a fairly confident projection of where wave 3 down might end up.
History: The 1929 crash
I think it’s important to look at 1929 and the wave structure (above and below), which was the same as 2007—to a point. I will show the 2007 crash below in the “What If” section.
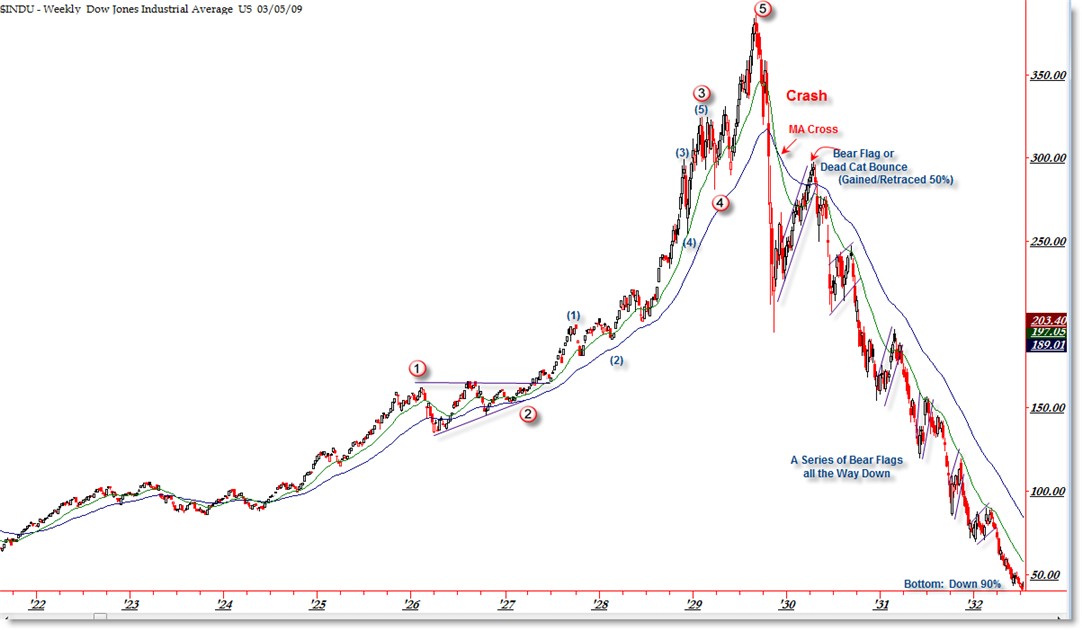
The wave structure of the 1929 crash was in 3 waves overall. There were 5 waves down from the top (the A wave) and then a very large B wave retrace. The final C wave down was a stair-step affair and lasted over 2 years.
Let’s look a little close at the timing of the 1929 crash because the similarities to today are uncanny.
The market peaked on September 3, 1929 and then it took 2 months for the crash to actually happen (to reach the bottom of wave 5 of the A wave). The larger crash which we always hear about began on October 23, 1929. Then there was that large B wave, which lasted 5 months and finally, the C wave which went on for more than 2 years. This might be the scenario we’re looking at going forward.
Keep that December 12 date in mind for the bottom of the A wave.
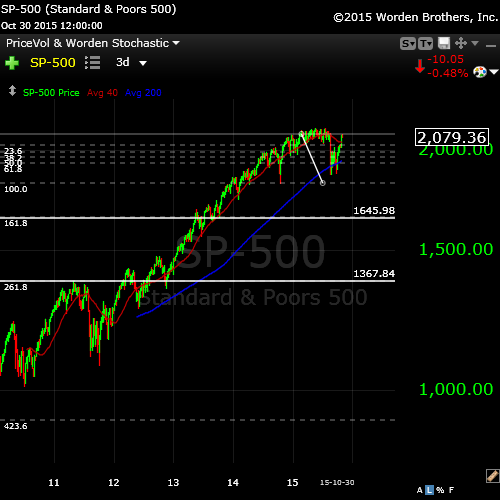
Finally, let’s take a look at a big picture of the SP500 and project the bottom of the third wave down. I’ve drawn a couple of horizontal lines on the SP500 chart to suggest ending prices for the bottom of the A wave.
If the full wave drops 1.618 X the length of the first wave, the bottom would be at 1645.98.
If the A wave extends to 2.618 X the first wave (historically more likely), the bottom would come in at about 1367.84.
______________________________
“What if”—Without the FED
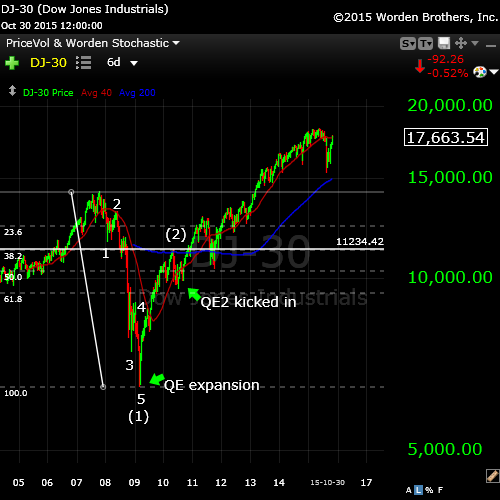
Above is the 2007 chart of the DOW. I’ve marked the motive wave down so that you can see the configuration compared to what should happen today and to what happened in 1929. Note that wave (1) came down in 5 waves and then we retraced to the 62% level. We Elliott-wavers thought we would turn down at that point, but qualitative easing had its effect on the market and up we went.
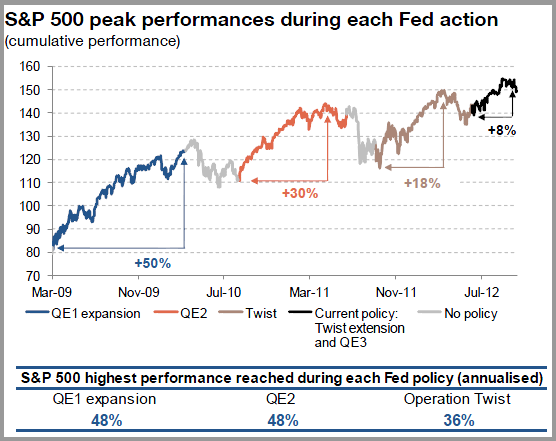
It’s interesting to note the correlation between the QE segments and the movements of the market.
Below is a chart of the various segments of quantitive easing undertaken by the FED, with their dates, so you can see how they applied to the DOW chart above.
____________________________________
Cycles Analysis
This is my cycles analysis from Wednesday, Oct 28. Not much has changed from the cycles analysis from a week before that and if won’t have changed as of today (Nov 1). You can click on it to expand.
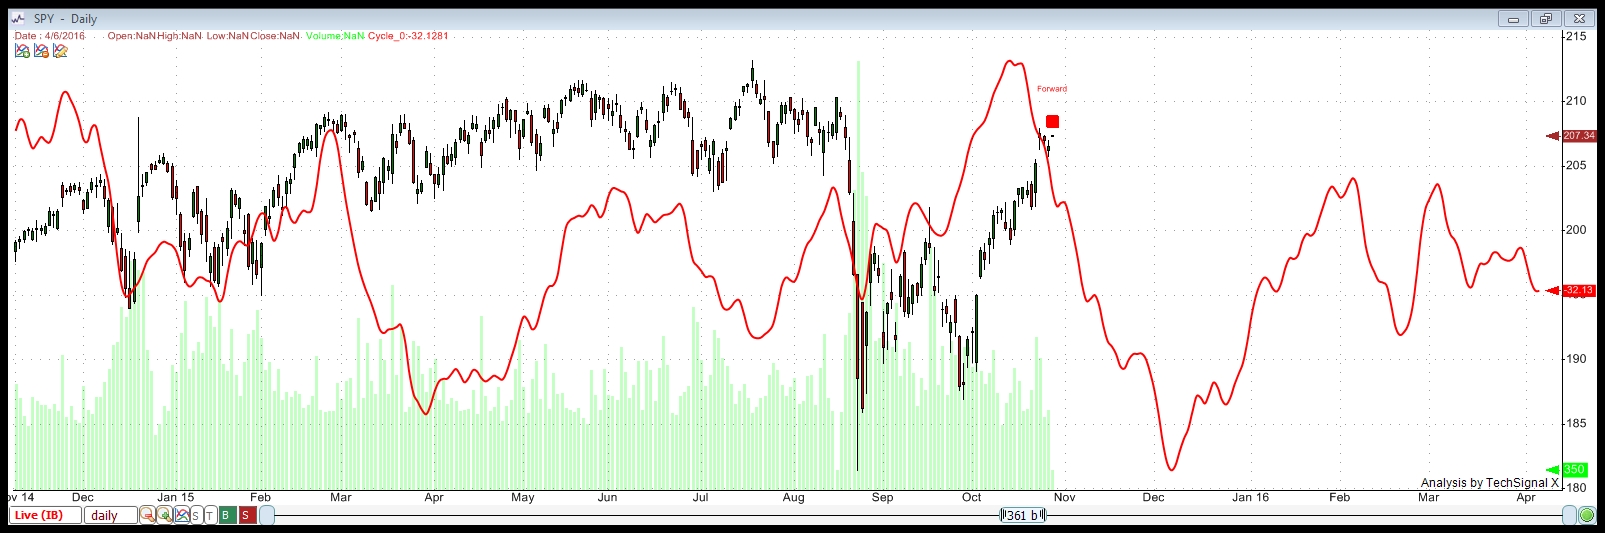
This cycles analysis uses Techsignal X from the Foundation for the Study of Cycles. I’m using data going back to 2002 this analysis of SPY (SPX) and displaying a compilation of all the cycles the software has found over that period. You can see how close-fitting it has been in the recent past. The fit with the current wave is quite stunning and therefore, something to pay attention to.
This analysis suggests a cycle top of October 13, so we are overdue for a turn down.
It shows a bottom to this set of waves down at December 7, 2015. There are Gann and astro projections for a December 12, 2015 bottom from different, very credible sources. I would suggest that these dates are the dates to watch.
I’ve gone a little deeper into what the analysis is telling me on a separate page. Here’s a more in-depth explanation of what this chart is suggesting.
_______________________________
The Panic Phase and the TPD (Turning Point Distribution) Principle
I provide the review of the TPD Principle one last time:
The TPD Principle describes a period in time of several weeks in which an array of cycles congregate, including gravitational, geomagnetic, and nuclear. It’s around this time that markets have historically topped. I was asked to include a reference to this in today’s blog post, which I’m happy to do. This principle generally refers to market tops (which we’ve already seen on May 20, 2015), but it’s interesting to note how many astro events we have occurring over the weeks surrounding the upcoming major turn in the market.
In his book, “the Universal Cycle Theory,” Stephen Puetz writes, “The TPD principle involves the eclipse cycle as well. The eclipse cycle normally peaks on the first new moon before a solar eclipse. Following that reversal point, it takes six weeks for sentiment to shift from euphoria to panic. Then on the first full moon after a solar eclipse, a panic-phase begins. A panic phase usually last two weeks—ending at the time of the next new moon.”
The dates:
Aug 14 , 2015 – First New Moon before the Eclipse (there is a New Moon happening at the same time as an Eclipse—Sept. 13)
***Aug 29 – Full Moon before the Solar Eclipse (peak of the eclipse cycle)
Sept 13, 2015 – New Moon and Partial Solar Eclipse
Sept 23, 2015 – Fall Equinox
***Sept 28, 2015 – Super Blood Moon Eclipse (start of panic phase)
***Oct 13, 2015 – New Moon (this would mark the end of the panic phase) – six weeks after the Aug. 29 full moon.
So … we are also due for a turndown based on the Puetz crash cycle.


Peter, I have only been following your site for less than a week, but I love it. It fits well with my interests. I have always found EW a bit frustrating because of the alternate counts, but your analysis is really clean and direct. Also, I see that Andre’ posts here, he’s great. I use to enjoy following his thoughts on another site. He’s got great posts, and if he finds value here, that’s good enough for me. Currently short. I look forward to following the discussion here.
Thanks, Steve,
Welcome!
As I’ve said often, as a trader, I need a count that I can “count” on … haha, so the EWI approach of multiple counts does me no good. I need to know the direction and when I’m wrong, so that’s the approach I try to bring to the table.
Thanks for the kind words.
11/2-3 is strong turnwindow. Tomorrow at the latest the turn will come.
Cheers,
André
We’ve already topped.
Thanks, Peter,
the market is trembling and resisting. Me too.
What is your feeling concerning the gold ?
I don’t see it too motive.
I’m still long GLD. It’s right at a 62% retrace so it should turn up right now. It’s in a countertrend move, though. It should retrace 62% from the peak. Currencies headed up (except dollar) – also corrective.
Just got short ES again. As per my blog, this should be the second wave of the 5th of the first.
I am somewhat concerned about the structure of the SPX now. I’m going mostly by futures. I don’t like what the SPX is doing.
This is all so profound! Seriously. When I look back to my youth and trading career it is all becoming a whirlwind. The idea of a “crash” or what EW calls an impulsive move seems to have become all to commonplace. If you look at the markets from 1950 to 1980 there weren’t really the opportunities to leverage small money to large money quickly. In 1982 through 1987 that all changed. Then the move up after the 1987 crash came. The tech crash of 2000. 2008 and now! 2015.
As Peter says above it is important to know where you are and to have a count you can count on. If this move happens as expected it can be life changing. Here is a little reality check from personal experience.
In 1987 I was holding 100 OEX puts that cost about $5,000. I believe I bought them in Sept and they were November Puts. As the crash approached, I sold them for $17,000. I was pretty happy with the trade. At their peak after the crash, they were worth over $100,000.
Still happy?
In 2008 my life was much more hectic on a lot of levels. I didn’t have the time to focus on the markets. I was pretty certain we were going to have a big downturn. This time I was holding SnP puts in a futures margin account. I bought them for around $5,000. In a couple weeks they dropped to around $1,700. I was in a tighter financial position and was nervous about taking a loss as I couldn’t add to the position in the near term to satisfy my belief that the market would tank. We had a downdraft in the near term and the options went to a value of about $6,000. I felt relief and closed the position for a $1,000 gain in a few weeks. The peak value of these options a month later was $270,000….
Not happy : (
I’ll never forget the morning I turned on the TV to see the SnP futures down 80. Then the same again the next day….
I say all this now to point out the reality of the possible opportunity ahead and the NEED to have a clear head and a plan. Although these moves have happened more frequently since 1980, there is no guarantee that will continue.
Current opportunities / realities. EVERYONE has to evaluate their personal situations and risk tolerances.
Based on the projections above. “If” we drop to SnP 1645.98 , a December 2015 2000 SPX Put costing about $2,100 will have a value of about $35,000. At SnP 1367.84 it would be worth about $65,000. This is assuming we hit these levels in early December.
This is my third crack at an opportunity like this since 1987!
I plan to end up happier : )
Good trading to all… that’s why we are here to share and learn… Thanks Peter!
Having an idea where the market is heading is one thing. Having a plan to take advantage of it is another. Consider scaling in and out of positions and not trying to hit a home run. Any other suggestions for trade management would probably be appreciated by many here : ) If that is considered out of scope for this blog, I understand.
Good lessons for all traders. I will hopefully keep you safe as this thing heads down. I’ve been expecting this for 8 years. The videos on my site are all about the future and whyu and will get more intense as time goes on.
Thanks for sharing your knowledge and thoughts. Important times. Unfortunately the world is asleep.
This should be the extent of the SPX move up right here.
S&P 2080 is Gann equilibrium price. Close beneath is confimation.
ES at a 62% retrace, which means we’ve done one wave down (it stopped in a strange place) if it turns here and goes to a new low. And yes, the low on 2080 SPX is the confirmation.
No, I’d say we’re going to the top. SPX has done some weird 3 wave configuration after coming down in 5 waves. So it’s messed up the motive count.
Futures still look OK to me. It’s cash I can’t quite figure out.
I warned you 😉
Next 24 hours are critical.
I’m listening … 🙂
Futures waves are corrective, though so they should not go to test the recent top. I can’t decipher the cash waves … they’re just too small.
Long term Gann timing gave 10/26, but short term timing gives 11/2-3. Tomorrow Venus conjunct mars, last quarter, major tidal inversions, sensitive degree of the sun.
So Tuesday is a magnet. As long term trend is down, the question is how strong this magnet is. That’s why I say the next 24 hours. Once it starts turning there is no stopping it. But that’s why the maket is stalling; it wants to go down, but it can’t-yet.
Well, you’re the timing guy, I’m just price 🙂
Maybe we could team up to combine both 😉
I thought that was what we were doing … haha.
It sure seemed to “start turning” on Friday’s close!!
Down 92 points in a flash. I understand your analysis Andre.
But, I can’t quite wrap my head around such a strong move up right at the beginning of the month.
It’s amazing how often the market just HAS TO do a double top, particularly on important turns.
Peter … do you know which number is worrying me :-((
?
I had a short term sqr9 that gave an inversion 11/1 (Sunday) and turns again 11/3.
Almost all crashes start with a lunar square. So I think this is the main reason for this move.
From a longer perspective, I could say that 9/23 should have been the high. But the (bearish) lunar eclipse gave an inversion.
If this is the major turn we expect, a lot of absorption has to be done.
So this market is severely overextended. But we are close; very close.
As far as I’m concerned, the wave structure is complete. We’re just tidying up. And currencies have turned … euro on the 15th I think it was. So there’s lots of pressure mounting up for a US turn.
André,
I now have additional cycles sources that also point to the third of November. And they also support December 11/12. The more, the merrier. Eventually, we’ll get this down to a science.
I urge you to keep Armstrong’s comments from today in the back of your mind.
It is noteworthy that the DAX DID penetrate it’s low a DAY before the ECM turn and has started moving up.
Martin is real clear. Either we “slingshot” down to new lows (now?) or we base for a while and “Phase Transition” to higher highs between now and 2017. First stop DOW 23,000.
NOTE: His comment that the overbought condition of the market in the past FEW YEARS has been worked off!!!
http://www.armstrongeconomics.com/archives/date/2015/11
“The Dow closed neutral on our indicators for the month-end of October. We have held support below and bumping against resistance. There are only two possible patterns which is either sling-shot, penetrating last year’s low and then swing to new highs is a blast to the upside. Or, we simply base and then enter a Phase Transition.”
“The fascinating aspect is looking at our Energy Model. We can see that despite the rally in October, the Energy turned negative in a full blown divergence. This means that the over-bought position of the last few years is being resolved. That opens the door for a Phase Transition.”
“Now look at the DAX. It bottomed WITH the ECM one day ahead of the turning point. Many individual stocks bottomed precisely with the ECM. The DAX did penetrate the previous year’s low intraday. The closing now for year end will be absolutely critical for the survival of Europe as a whole.”
I think I addressed my thoughts on that scenario in my blog post.
I am speaking from position of already being short. I am in general agreement with the market moving down into the end of the month. Very short term I have been expecting this topping action should be complete by in about 45 minutes.
Well, there’s the double top in cash. Futures are still in a second wave position. Let’s see that happens …
what happens, rather.
Well Steve that is also what the bradley is telling us it makes a sharp turn by the end of the week.
But watch out for November 15-17 it’s a Mercury date and the last one ( Okt 22) was spot on again.
So we have to go down hard this week into mid November.
Markets defy the gravity.
It would be surprise if SPX don’t go to touch 2100 by the end the day
An ending diagonal now on SPX.
It is just melting up with few large caps
SPX just hit the upper trendline so this is a very good place for a turn.
And how should we count this wave now?
ending diagonal. This is the end wave – has to go up in 3, so I think we’ve just done ‘e.’ That’s SPX. ES still in a second wave.
NYSE just tested the top. It missed by a buck or so a couple of days ago … should have been a clue (missed it).
Dmitri,
We’ll see how motive looking this wave down is.
Double tops on ES, YM, NQ. Need them to hold.
looks like ES wants to make a run at Friday’s 2094 high.
Now SPX is at the higher upper trendline of the ending diagonal. I was hoping the smaller one would hold but it didn’t. We’re just about done.
I just placed a chart showing the SP500 ending diagonal at the top of the post. I should be done or just about so.
And now ES and NQ waves look like 5, so they should do a double top and that should be the signal …. finally.
Ending diagonals usually have a “throw-over” – they exceed the (in this case) upper trendline, which is normal. The problem is that you really can’t pick a stop point, but I’m counting on the double top by futures to tell us that …
Just completed a big reverse Head and Shoulders at ES 2094 from 1:00am October 30th.
Be interesting to see if we reverse here..
Looks like a typical first trading day of the month buying frenzy.
Well, this is an obvious blow-off.
It looks like ES is morphing into an ending diagonal. In NQ, that would be the second one in a row – never seen that before. NYSE is almost at 62%. It’s interesting to note that currencies and gold (GLD in this case) haven’t budged all day long.
Peter
Ten more points and we should reach ES 2106 … and that should be it … I hope !
AZ
That’s exactly the number I have if this is an ending diagonal for ES. It’s also a wavelength ending. (an extension from the first wave).
2106 today without some kind of retracement?
Yeah, that’s what ending diagonals do unfortunately and today they’re all over the place … and all I can do is place a trendline at the other two tops (wave a and c and where it meets wave e should be just about the end, but as I said, they often do throw-overs). You just have to let them blow themselves out.
Gary
Yes, I think today .
AZ
NYSE is now $7 away from the 62% retracement level.
They have sharp reversals, like we did with the Sept 17 Fed meeting.
I don’t think the market will reverse when it has only 20-30 points to take for new ATH.
I put us near the top of the final 5th wave. One more small wave up, I think.
Peter,
My gut feeling is getting closer and closer repeat of 2007 the american way we just have to see a new record…
This frenzy may continue like this on low volumes on the back of AAPL GOOG FB TWTR MSFT until new ATH. They want to force the investors to believe in new bull market.
Who….. the Rockefellers (lol)
The bulls
Peter
The Highest reached ES 2100 .. I think we need just these few more points .
AZ
That’s the upper trendline, but the C wave at 2.618 X the A wave is 2106. Somewhere in that range.
NYSE just reached the target at 62%!!
And the steam-roller has suddenly ran out of stream
I should have named my post “View from the Room Just Under the Penthouse”
I didn’t see the ending diagonals coming …
This should lead to a very sharp drop. It will be important to try to find the top of the second wave. The second wave of the first wave down was very brief and sharp. The third that we’re set up for now will come down faster than the first wave did.
Do you still see ES 2106 in the cards?
Is the sharp wave down likely to happen overnight?
Thx…
No, we can’t really ever have a sharp move down overnight because any move down opens up a gap, which almost always has to be filled (except for gaps in the middle of a third wave). So we should be safe until the open tomorrow.
That’s why most of the time, you’ll find that futures reverse at night – they have to go somewhere, and down works if it’s the lower part of a wave that will get retraced anyway. I always keep that in mind at the end of the day if I’m thinking of taking a position or getting out of one.
I can still see 2106 in the cards. We didn’t quite end. I want to take a good look at everything tonight, but the wave structure looks like an ending diagonal to me … in several indices … and the fact that the NYSE hit the 62% target is a big deal to me. It’s the index I always look to when I try to figure out what’s really going on from an Elliott wave perspective.
Plus currencies have reversed and they run counter to the US market and then there’s the master: André. So my bias looking at all this information at day’s end is that this is still wave 2 and we’re at the top. (and all the bulls are in the market). I’ll look at some other technical info this evening and do some other measurements.
I fixed some typos in this … gawd, my typing sometimes!
Gary,
We look to have done a 4th wave overnight in futures so this reinforces that this wave in most of the indices is a fifth wave rather than an ending diagonal. We should complete a small topping wave today then, which may take ES to 2106.
It also could be the start of a first wave down. That would be if it continues down to a new low from here. The waves are so small, I can’t make out if it’s motive.
This tiny wave down looks like it’s down in 3, although trying to read these one minute waves is a bit ridiculous. I would expect just a little bit more up in the morning and we could be served an opening gap reversal. In other words, we may open a bit higher and immediately reverse.
The NYSE at the 62% retrace level is important to me.
Yes, I think you will be right Peter , we need just these few more points and it will be over.
AZ
Thanks, AZ … and it’s always a good thing to have confirmation (or not) from others looking at the same info. 🙂 So I appreciate the input from everyone.
Dmitri,
You might be right on gold. the last wave up was in 3 waves which would have been OK, except that this latest wave down has come down too far as of today. I may wait out today to see what happens. It’s also down in 3 waves.
5 waves forming in SPX, which could indicate a top here (ending waves need to be in 5). NYSE looks like it could turn at a 62% retrace, so things are looking good for a turn very soon.
It’s oil pushing the energy sector with DOW today.
It was Nasdaq yesterday.
If it is final 5th it should finish at 2110 ?
By fib measurements, yes. But looking at all the other indices, they look like they’re finishing up and we may not get there. Just have to see what happens here. NYSE is going for a double top now. All other indices seem to be finishing 5 wave rallies.
Currencies are also turning back up after a corrective move overnight.
DOW turned right at the target.
That was such a huge fourth wave in the ES and NQ, I’m back to the ending diagonal theory on both of them. It now looks like a wave in 3. I don’t think it changes the target … it could, but the upper trendline for the pattern ends at about the same place as the fib measurement (in ES).
In the DOW, if you measure wave A with a fib tool and look at the 1.618 extension, it goes to about 17897, which is a normal fibonacci stopping point for an ABC correction. We’re about $10 away.
And GDOW is pushing for the 62% retrace level after completing a fourth wave triangle (which forecasts the end of the wave). So there are a lot of telling signs out there …
Does 2106 still seem viable for the ES?
We might do a double top before we get there. That would be at 2100 ES. That looks more likely to me at the moment.
Peter,
after today’s action, are you still looking at a Wave I (end of 5 of I) bottom at spx 2058 / es 2050? or is that now the target of 3 of 5 of W-I?
Hmm. Actually, I probably am, because today didn’t really change anything technically. The fourth wave is still the fourth wave. It just means a bigger drop in a first wave. Good question. Valid first waves should stop at the previous fourth wave.
All we did was the last leg up in an ending diagonal.
LATEST SOLAR NEWS:
(Nov 2 2255UTC) It appears the coronal hole stream has finally struck. Geomagnetic storm watch begins!
(Nov 1 0911UTC) Sunspot number is on the rise!
This maybe the catalyst we need to see a correction in the market. The storm will effect the earth shortly. I have noticed several times in the past, like shortly before Aug 24th how the markets reacted neg. I have liquidated my longs from last thursday morning as posted last week. ( 5 best days of the year to be long) Good luck to all.
hi Peter
I thought I’d ad a little balance , your wave counts look clean
so no arguing on it at the moment .
My concern though is from my studies of James mars langhams work .
I mentioned back in late Sept this appeared to be an inverted crash and was looking for higher prices into Oct 13 , I also added that the puetz window technically ended Oct 26 ( 6 days before to 3 days after the full moon that was 6 weeks following the solar eclipse )
I also mentioned that I was not sure if Oct 26 would be a high or a low because there was a mars Uranus pair a sat Uranus pair and a jup Uranus pair and technically they turned bullish in the Oct 20-26 time frame . so far both thoughts have produced higher prices and I don’t see longer term bearish planatary pairs at this time . mars Uranus opposition is typically a high but I’m going to question that until I see the market when that date comes . the jup Uranus as well as Sat Uranus pair are in similar positions as 1927 just before the Dow blew off to the upside .
18300 must not even be broken by 1 point on a closing basis or it signals 19300 . right now I favor a break above 18100 yet a failure to make a new high and then a significant sell off which will probably be a deep and steep drop yet relatively short lived . the August lows most likely won’t even be tested . 16500 is now support 18100 resistance as far as I’m concerned . Nov 7 is the typical seasonal low into Jan 16 , my guess is that becomes inverted , Nov 7 high and Jan 16 low . I’m presently working on next year’s timing model yet I’ll agree with your Dec 12 date as a possible low since it also shows up as a low on my model . the problem though is Dec 12 is a short te cycle and the Oct 20-26th dates are longer term in nature . time will tell but my bias is after this drop were going to see much higher prices into 2018 , Andre you have the same date as me yet from different methods . benner business cycle low to high counts George Lindsay timing methods ,James mars langhams work and even the mats Uranus cycle from around Feb 2017 cycle low into around April 2018 mars Uranus cycle high . Oct 2017 to April 2018 should be a multi year massive top . a huge decline e to follow then . as for now ?
I’m sticking with the bullish side of this market using the 16500 level as my key level of support ,
good luck everyone
we all have to trade what we see and do our best to leave our emotions at the door .
Joe
After reviewing tonight’s charts, the count really doesn’t change. I’ve added two charts to the top of the post that I hope tell today’s story.
2080 is significant from a Gann perspective. 2116 is opposite this price level so pretty significant. 2098 lies in between.
Cheers,
André
Is there an upside number on any of the indices that would invalidate the current EW count? I’ve seen some trendline penetrations and double top violations.
Can’t give you one for futures, as I’m back to the ending diagonal pattern on those. In SPX, 2110 would the max for this wave.
A lot of indicator divergence ..
NYSE should be right about now … this wave should not exceed 10,600
Pretty strange. NYSE suddenly spiked from 10,593 to 10,608.
I say pretty strange because most other indices and the ES were getting weaker as NYSE was spiking higher..
We’re above 2110 in SPX, and the waves are so tiny, I simply can’t measure them properly, so I’m not going to keep trying. 2114 is a defining level for SPX.
There we are.
Looks like ATH will be taken by the end of the week
What is ATH?
All time high
Oh, I thought you were talking about an exchange or stock …
Well, this is a really major top, so this dance could go on for a little while. GDOW still trying to top. I see I measured NYSE improperly, but I think it’s almost done. We just seem to be beating our heads against this ceiling. Hopefully it holds …
Peter,
Nasdaq, Spx and Dow are just 1-2% from their all time highs.
I cann’t imagine them to throw the towel here after all this road up
I can. Seen it happen before. Second waves can to one tick below the top to still be valid.
ES reached 2102 , we could stop at any price between 2102 and 2106 . If we pass 2106 by more than 10 points then it means we are going into new highs …
That marks a complete wave count for me. We’ll see what happens here.
You mean a complete count on NYSE or everyone!
NYSE just hit 10,602.
It should be kind of the same thing. SP500 particularly, but they should all turn at once.
Peter.. I think the TOP is in … missed 2106 by 4 points ….not bad .
Early yet, AZ … hoping you’re right.
Want to see SPX extend this first wave to 2102.50
AZ, what kind of action are you seeing to make you feel confident this basing and surging is over?
thx…
Can anyone comment on the recent wave structure. It appears we have had a 5 wave up from 8:10 am in the futures, and it has reached an interesting price juncture at 2102.20 (Dec.). There is another level at 2105.4 and then 2110.2 that could be attractive to price.
Sorry, I should have added on a 10 minute time frame.
Gary .. I sent a post I think last week explaining it … but as Peter said it might be to early yet to call the TOP.
Looks like you got your 2106.
You got your 2106!
Yes, we got it Peter
Now we need to stop and turn down !
SPX 2116.48 is the measurement of the end length of the fifth wave right from the bottom of this C wave. That’s where we are now. If that’s the correct count (and I’m doing this on the fly), then we should turn here. ES has 2109/2110 as the same measurement.
If we don’t turn here, obviously this is not the wave I think it is.
Peter,
I think this week will be up it just will follow the bradley siderograph.
So next week the decline will start.
Maybe double top or even new high or just below time will tell .
The stockmarket is running in extremes so will the next decline too.
Cheers..
Well… I guess it’s hat’s off to all those bullish out there who have made a ton on this move up! As a spectator waiting and watching for a reversal, this is painful and absurd.
Absurd it is, because the small caps are just not participating. It’s just large caps. IWM is stalled. In fact it’s right at the previous 4th wave level with suggests a downturn is imminent. usd/cad is breaking out, and eur/usd is trying to start a third wave, so currencies will continue to put pressure on this market.
The really strange thing is that this large wave up, in order to be and ending wave, would need a fourth wave. There isn’t one in sight. So it’s still a corrective wave. And we’re so overbought. So something has to give here shortly.
Volume is ridiculously low.
You are right, Peter,
there no sellers. Nobody wants to stand in front of steam-roller.
Everybody is waiting when it gets out of steam to jump in.
The problem is that nobody knows how much steam remains
Interesting. SPX turned right at 2116. That’s a fifth wave of exactly 1.618 X the first wave of this huge C wave. I would expect a test, as the very least.
Peter,
Did you read my post above? 2116 was the level I mentioned. 2116 is 46 squared and opposite the 2080.
No, I must have missed it. I’ll have to write that down in future. Interesting that it’s exactly the same number!
Does it work with such precision up to the point for the waves of 240 points of amplitude ?
yes.
There is certainly an argument though that this has been a third wave and that if we turn here, we might go into a fourth wave (on the way to a fifth wave up). But if we turn here, we’ll see how the resulting wave down turns out. It will have quite a ways to go, either way.
This little ending wave (1 min charts), if it’s for real, has to go up in 5 and test the top (ES, SPX, etc.) The wave down is close to motive, but I don’t think it is.
Which top, Peter?
That one of today or all time high?
Today. I can’t tell what this wave down is yet. It is most likely a fourth wave. So far, down in 3.
Looks like we have to stay tuned til tomorrow … see what happens to futures tonight. The fact that we stopped at 2116 SPX looks promising. The wave structure is complete (has been for a while). I’ll properly measure the other indices as a whole tonight. I’ve been concentrating on smaller waves and perhaps getting too deeply into them.
That wave down is starting to look fairly motive. We’ll have to see what happens on the retrace.
Thanks, Peter,
it’s hard to deal with this crazy market
Oh, I know. I’ve seen this kind of action before. It was a part of the 2007 top, I think. At some point, we had a huge second wave that we thought would never stop. In those days, I wasn’t measuring waves as I am now, so I don’t know that part of the story.
The C wave is a perfect 5 waves up (textbook). I never thought it would go so far and I swear, the waves lower down measured smaller and smaller, and then we had this huge blow-off. But the overall measurement is correct somehow … in SP, anyway. I’ll look at the others a bit closer tonight.
SPX will now have to get below 2079 to confirm a change in trend. (same number André has).
GLD has turned up a bit and looks to have done a small 5 waves up. It came all the way down to the previous second wave, so I’m hoping it’s setting up for a third wave up (still a C wave, though).
These are all huge moves in a volatile market going to extremes in both directions. Tough market.
It seemed like it was crazier than it was SPX ended up $6 higher than yesterday.
The problem is not that the market is advancing.
The problem is that the market is in few points now to negate all our count if it goes to the new highs.
Yeah, it can’t go above 2116 or the count doesn’t make sense. Futures I still put in ending diagonals, which really don’t have targets. They stop when they stop. I want to re-measure NYSE tonight. I don’t think I had a count on it other than the 62% retrace, which it exceeded.
GDOW is the only index that hasn’t retraced to 62% but maybe it will overnight. It’s only about $7 away. It looks like it needs one more small wave up to complete the pattern anyway.
If everything has topped, they’re all going to come down together … look out!
OK … NYSE. If you go and measure the first wave of the C wave, then measure 1.618 X wave 1, you get to 10,205 (I have to move my wave 3 label, as I had it higher). Next measure from the 4th wave (just below that point) and 1.618 again above that is exactly where we stopped … 10,640 or so. That should be the end of the C wave.
So I think we have a top. I’ll check out the others..
In the DOW, same routine. You’ll find wave 3 is 2.618 X wave 1 (roughly) and wave 5 is exactly 2.618 X wave 1.
The Nasdaq appears to be a little off at the top end … possibly slightly short.
Yep, this move the last 5 weeks is crazy. Congrats to all the longs (if there truly is any) for being up 2% for the year, lol. Nobody (other than algobots) would be buying at these levels right now. RSI on the daily is now over 70. It’s just a matter of time…
Peter,
I really appreciate all your hard work. As well as the other contributors to
this site.
Thanks Robert!
New post up: https://worldcyclesinstitute.com/a-watershed-moment/
I’ve tried to keep this to the big picture, as I’m of the opinion the picture has changed.