
 The Megaphone Pattern
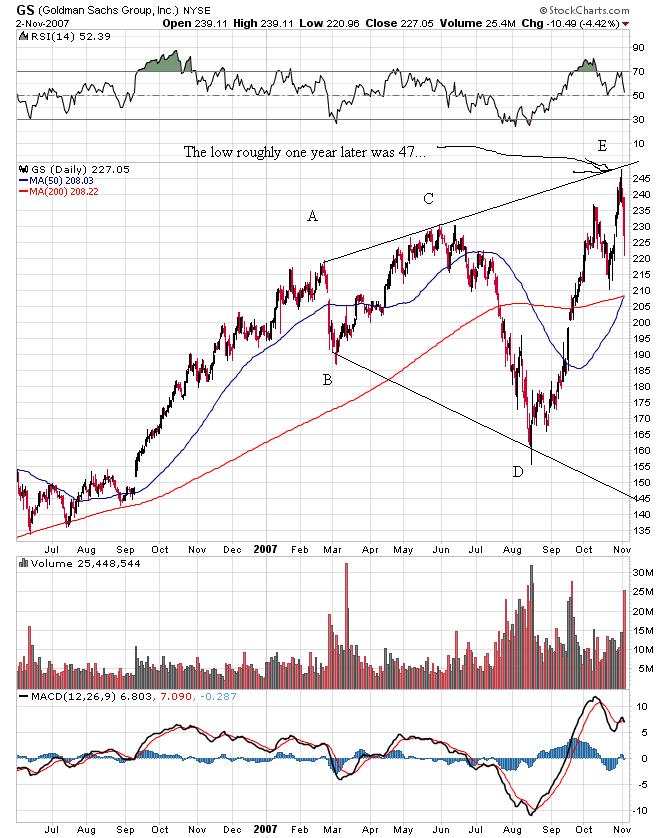
Broadening tops are not an Elliott Wave pattern. The question I’ve been attempting to research this weekend is if we are going to have a wave up in three waves, or five waves.
My conclusion (because I’ve found examples of both), is that we’re likely to get an ABC wave up in the SP500. However, there may be a “corrective” fourth wave in ES while NQ completes a normal fourth wave.
I don’t know for sure, but these charts may come in handy for you as you contemplate how to trade this extraordinary rally … the last one of these we’ll see for a while.
Broadening tops are extremely bearish and I expect this wave down after the top is one that will hit the headlines all over the world. Stay tuned.
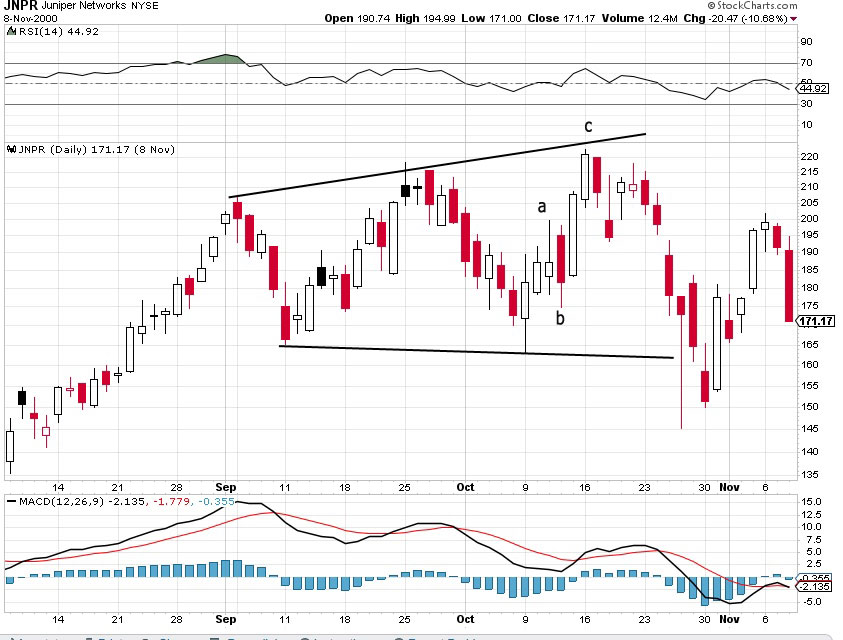
The broadening top here shows three waves up in the final wave, while the first example above shows five. We’ll have to see what happens.
_______________________________
Technical Challenges at Cycle Tops
One of the central themes of any cycle top, but particularly the 500 year cycle top, is the explosion of complexity within society.
You see it everywhere; it’s becoming extraordinarily obvious. Governments are so huge that nobody is in control; there are vast amounts of taxpayer money spent with no oversight. Teslas are exploding left and right, and of course, we’ve had a couple of 737 Maxes fall out of the air. That plane may never fly again.
You also see out-of-control complexity all across the internet, something I have to deal with everyday; it’s getting to the point where most of my time is just dealing with technology. It starts with the fact that web applications change every day, with little to no explanation. I have to learn new screens every week, because buttons move, or pages get re-designed, or pages just aren’t there anymore. But, it’s gets much worse.
The week before last was with Apple’s icloud technology. There’s hardly any understandable information out there on how this system works, but it’s like One Drive in Windows. It’s a file sharing and backup system.
This system stopped updating some of my applications (specifically my calendar) but I was forced to ignore it for almost two weeks. I was simply too busy to do the research on how to get around the problem of a full drive without just blindly paying more money to Apple to increase the size.
The issue was that my calendar had lost some of the dates for meetings I’d scheduled into July. I don’t knowing use the technology (it’s on by default) and so I was not going to pay more money for something I don’t use.
I contacted Apple, and after the first “techy” hung up on me, the second higher-end expert (I got upgraded to him during the call) ended up losing ALL my dates and leaving me with blank screens before quietly hanging up on me. It became obvious that his Apple representative had no training on how to work with a customer, as he didn’t explain anything he was doing (I had shared my computer with him online); he just did it.
After he left, it took me a couple of hours to figure out how to get most of it back.
Next came trying to fix two WordPress websites that members of my favourite professional speaking organization had almost destroyed. After spending an entire night (yes, around the clock) trying to fix it (I fixed most of it), I’ve turned it over to the developer of one of the plugins to try to finish the final “fix.” That one’s in the works.
There isn’t the knowledge out there amongst the general public to be able to use any of this technology properly. People are destroying website due to lack of knowledge (and apparently no desire to learn).
And now this week, where I find that NVidia, a company that provides display drivers for Apple computers is having some kind of war with Apple. On May 15, their drivers got updated on Macs (without anyone really being aware) and now my cursor doesn’t show up in the live webinars I do on Wednesdays.
It took me 12 hours on Saturday to finally get to what the real problem is, because this information is out there, but it’s incredibly difficult to find. At the point I discovered the display problem, I’d spend eight hours testing just about everything else.
So, I still have to come up with an alternative to this for Wednesday, which may mean rolling back to another computer with an earlier system on it. One way or the other, I’ll figure it out (without wasting my time with “tech advisors” — a complete waste of time).
That’s why this blog post is down to the wire this weekend.
This technology “stuff” just doesn’t end. The next task for me is to find out why, when I make a currency trade, the chart for that currency goes blank. That’s on Windows. It isn’t just Apple that’s having problems; it seems to be right across the board.
So, I’m starting to think about how to simplify things going forward, because I think we’re seeing just the start of these kinds of issues. Just keeping my website ticking along is a full time job and is robbing me of my ability to do just about anything else.
More to come …
__________________________________
NYSE Update
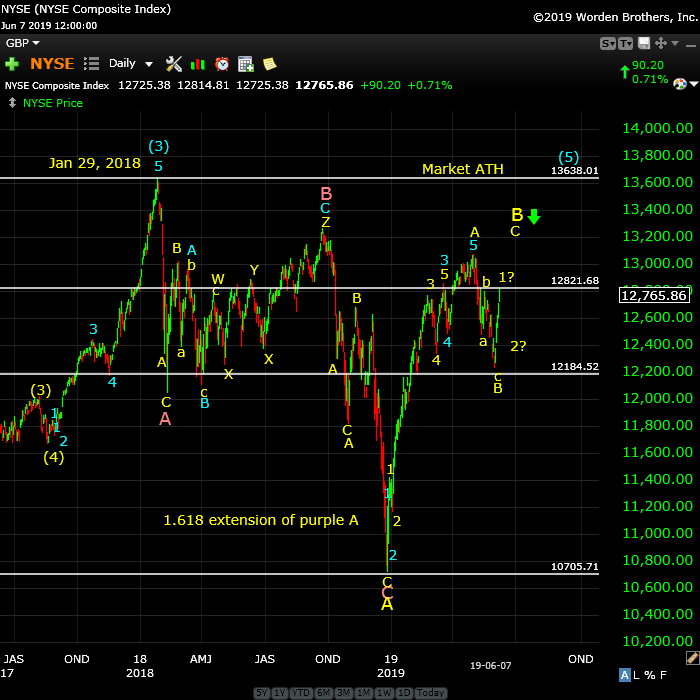
Above is the daily chart of the NYSE showing the large ABC fourth wave that we’ve been in since the top of blue circle 3 on January 29, 2018.
The most recent wave up from Dec. 26, 2019 is corrective but I’ve numbered it in five waves (they don’t follow the impulsive wave rules, so they’re corrective). I’ve re-labelled the first portion of this A wave up as a 1-2,1-2 pattern, resulting in a 3-4, 3-4 pattern at the top of the yellow A wave (slightly above 13,200).
This weekend, we have a B wave down complete (the white line at 12,184.52 is the 38% retrace level), and we’ve begun the predicted bounce. Normally, I would expect 5 waves up in this subwave, but I’m not sure we’ll get it, with the corrective wave that’s possible in SPX. A top will result in a very deep wave down to a new low below 10,700.
Possible timing: I’m now expecting a high somewhere in June now (the market is moving quickly now), with perhaps our big drop beginning then and lasting through early September (my dates here are speculative).
As I often say,
“Trade what you see, not what you think.”
___________________________
Elliott Wave Basics
Here is a page dedicated to a relatively basic description of the Elliott Wave Principle. You’ll also find a link to the book by Bob Prechter and A. J. Frost.
____________________________
Registration for Commenting
Want to comment? You need to be logged in to comment. You can register here.
If you register, it protects your information. It also allows you to comment without filling in your information each time. Once you’re registered, simply go to the home page and click on the login link top right in order to log yourself in. Usually, you’ll be logged in for several days before needing to be logged in again.
______________________________
Problem receiving blog comment emails? Try whitelisting the address. More info.
______________________________
the real deal SM 2
The real deal …‘Educational, insightful and thorough market analysis for all levels of traders. It’s Elliott Wave at its best….Peter Temple is the real deal’ —SM |
Tops in your field DZ 2
Tops in your field …You are tops in your field. Tried to follow Elliot Wave international for years. They were always behind the market. After discovering you, I perceive that you are an expert in reading the waves, which puts you way ahead of the rest of your peers. And you can read the Waves like you are reading tomorrow’s financial section. I pray you stay healthy. —DZ |
Get an upper hand … JC 2
Get an upper hand in trading …Seeing all the different currency pairs and the wave structures and hearing you explain why this has to do that on a nightly bases gives one a upper hand when trading. Elliott Wave applies to all stock and indices and can be applied to any candlestick chart. If someone ask what you want for Christmas – Tell them a membership to Peter’s “Traders Gold!”—JC |
Rise above the rest … SM 2
Rise above the rest …I have only ever met a few people who, in their chosen fields (astrology, medicine, music, martial arts, technical analysis), rise above all the rest and you are one of them…you have ‘the gift’…and that’s why I’m a Trader’s Gold member. —SM |
A true expert in Elliott Wave FL 2
A true expert in Elliott Wave …You are a true expert in EW analysis. What you provide is not available anywhere and is priceless. Subscription on your services is the best thing I have ever done. Many thanks for your effort to make me a better investor. I now have more trust in my investment decisions. I hope you will continue the excellent work! —FL |
The best of them JL 2
The best of them …Last couple of years, I subscribed to several ‘market traders’. You are by far the best of them and the personal contact is awesome. Daily and daily updates are very well written! Besides your expertise in EW, I also like your cycles analysis. Best investment I ever made! —JL |
Have not had a losing week RW 2
Have not had a losing week …I have been with Peter almost a year. The only thing that matters is have I made money with his service. I think I have finally turned the corner using Peter’s EW. I have not had a losing week in the last 5 months. Thanks Peter, for your amazing amount of hard work. —RW |
Couldn’t be happier … KK 2
Couldn’t be happier …The analysis and insight you provide is simply amazing! I’ve been trading the futures and equity markets for well over thirty years and usually average around 5% monthly. Since joining your Traders Gold Service two months ago, that number has better than doubled. I couldn’t be happier.—KK |
US Market Snapshot (based on end-of-week wave structure)
This chart is posted to provide a prediction of future market direction. DO NOT trade based upon the information presented here (certainly NOT from a daily chart).
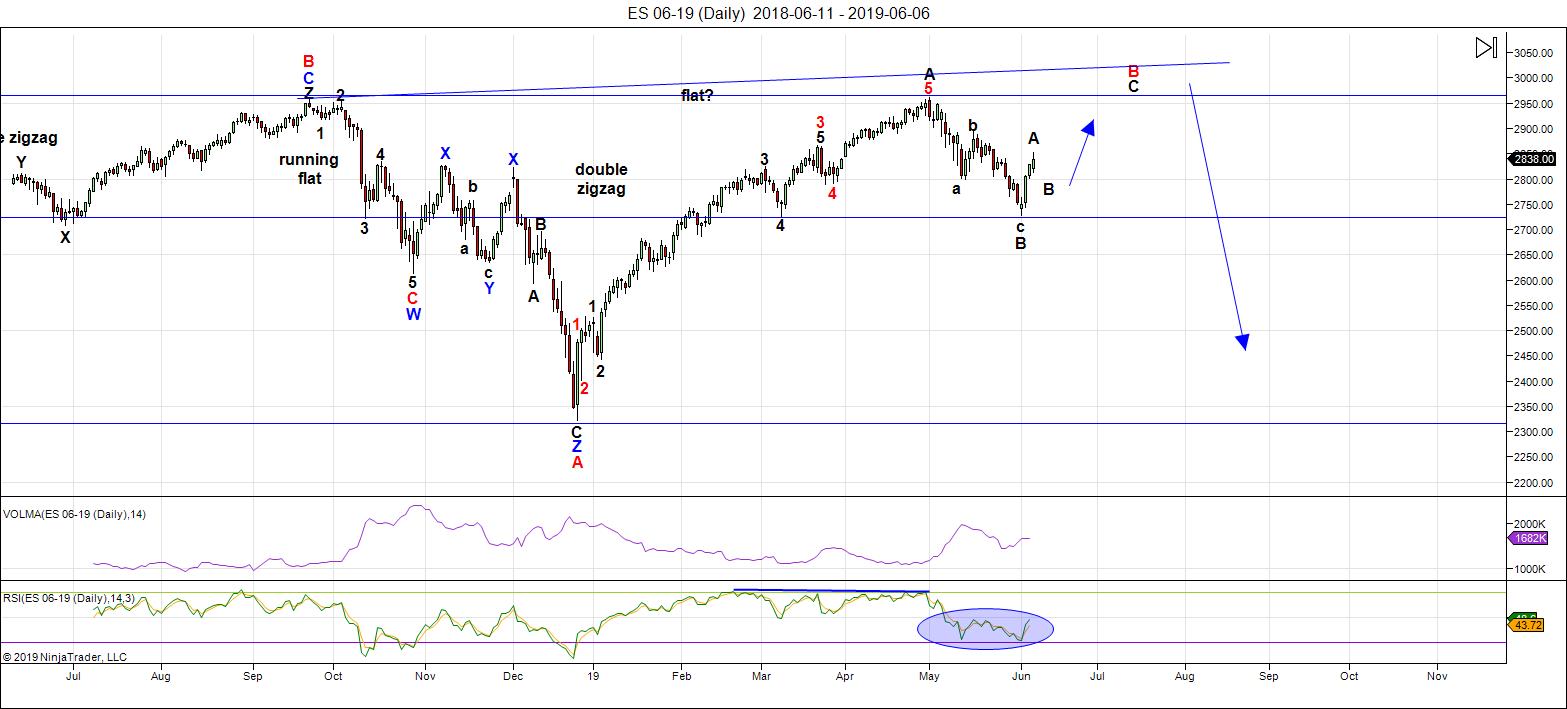
Above is the daily chart of ES (click to enlarge, as with any of my charts).
As predicted last weekend, we bottomed and rallied strongly the remainder of the week. While I expect weakness this weekend, more rally will follow.
It's important to remember that we appear to be in a broadening top and so the expectation is for a corrective wave to a new high, but not above the upper trendline. Then down, down, down in possibly the C wave of an expanded flat (there are other possible patterns, but this seems the most probable at the present time.
As I've been saying for some time, after we reach the final high, we'll see a turn to the downside with a major move to a new low under 2100.
It's impossible to successfully analyze this market without taking into account the movement of a number of related asset classes. The market has gradually been aligning across these asset classes and now virtually everything si moving more or less in "lock-step." When you trace out a major top, all major indices have to top at the same time. This 500 year topping process will include many international exchanges.
Summary: Expect the bounce to continue to a new high to complete this large, corrective "B wave" up from the Dec. 26 low. That will result in a very large ABC corrective wave, which must fully retrace to a new low.
Once we reach the high, I'm looking for a dramatic drop in a 4th wave to a new low. The culmination of this drop should mark the bottom of a large fourth wave in progress in the NYSE since January 29, 2018 - a year and a half of Hell. ES will eventually target the previous fourth wave area somewhere under 2100.
Once we've completed the fourth wave down, we'll have a long climb to a final new high in a fifth wave.
___________________________
Trader's Gold Subscribers get a comprehensive view of the market, including hourly (and even smaller timeframes, when appropriate) on a daily basis. They also receive updates through the comments area. I provide only the daily timeframe for the free blog, as a "snapshot" of where the market currently trades and the next move on a weekly basis.
______________________________________
Sign up for: The Chart Show
Next Date: Wednesday, June 19 at 5:00 pm EST (US market time)

The Chart Show is a one hour webinar in which Peter Temple provides the Elliott Wave analysis in real time for the US market, gold, silver, oil, major USD currency pairs, and more. You won't find a more accurate or comprehensive market prediction anywhere for this price.
Get caught up on the market from an Elliott Wave perspective. There’ll be a Q&A session during and at the end of the webinar and the possibility (depending on time) of taking requests.
For more information and to sign up, click here.
| "I think you are the only Elliot Wave technician on the planet who knows what he's doing.” |
| m.d. (professional trader) |
All registrants will receive the video playback of the webinar, so even if you miss it, you’ll be sent the full video replay within about an hour of its conclusion.


Nice post on Broadening Tops … will be forwarding to several friends. You can probably guess one of them. LOL.
“So, I’m starting to think about how to simplify (tech) things going forward, because I think we’re seeing just the start of these kinds of issues. ”
I have Windows Update set to off. I have Firefox auto update set to off. I have their extensions set to no updates. I have my charting program updates set to off. THEN … I chose when to update them. I do, but its on my schedule when I have a buffer of time in case of issues. (I still haven’t updated from FF52 because of critical features that would have died with FF57/Quantum. FYI — MS support for Win7 ends next spring, even though its still 30% of the installed windows user base. F ….rs.
Yeah, the updates are killers. I do the same thing. The don’t test anything properly any more.
Some are certainly going to call me “crazy”, but the kinds of things Peter is having to deal with I have been expecting as we approach a generational top. The cabal knows exactly what is on the horizon. I suspect technology “glitches” are going to get a lot worse. Does anyone think they will be allowed to trade the coming carnage in blissful quietude?
Think again!
You will increasingly see unexplained delays in order execution, delayed data feeds, frozen accounts, and yes, even some completely disappearing. I have been saving AND printing weekly shots of ALL my accounts for the last few months.
As tedious as it will be, I will resort to doing this DAILY after a top is in. It is going ti get crazy!
Hi Peter and friends
energy chart for this week attached
https://imgshare.io/image/june-10th-17th-energy-chart-red-and-blue-line.5jKHP
Thanks Tom,
My turn date June 11, next one June 16-17.
Thank you Mr. Temple, Thank you Tom!
Hi Tom,
from 11th(half) till the weekend the same picture
10th – High open and decline into 11th
11th – Low between 4 hours before open US markets and the open itself.
12/13th – The High and down into 14th
14th – The Low and slighly up
(17th High open futures and the decline starts again)
Unclear witch High is Higher 12/13th of 17th
similar to the pink line chart
https://screenshot.net/wppq6f4
Based on 3 day forecast.
https://www.swpc.noaa.gov/products/3-day-forecast
We should see a ramp from early morning tomorrow till early morning Wednesday.
Thursday we should fall sharply.
Some comments on the Fed – the market is now pricing in July ease as an almost done deal. If the Fed sticks to its previous playbook, then they will use the June meeting to set up that ease. This will make the rest of June (post the Fed meeting) very bullish. That would tie into what Joe’s expectation for June was (part of which has already played out). Going by history, when the Fed starts easing, thats when stocks are close to a major top. That would put either July 16th or Aug 15th as the potential high before the big drop. There is a lot of time between now and then. I will go back and do my research on solar eclipses. Joe is correct about there being a lot of info out there. Might as well do the research on my own to be sure.
Important considerations no doubt.
Far better to look at what the charts are telling us.
Shooting starts, spinning tops and dojis galore.
Size of move off the top pointing to at least a small degree trend change…it could be a corrective move a a push higher no doubt, and time will tell….
Yeh, Stars and dojis after 4 gaps in 5 days… 25 of 30 DOW stocks had RSI@ >90 this morning, and higher now. Usually see before pullback. See if Bull flag holds.
definitely some bearish signs today. I reduced some of the longs, but I will not position for a big fall till some trend lines break. This market has taken me to the woodshed way too many times for going bearish too early. 2800 is now the big support level. A pull back to 2850 region is likely a buy if it happens over the next week
Went through elliott classes in Atlanta twice in the 1980’s. Learned that a broadening top is an elliott A-B-C wave 4 correction with the B wave going to a new high. The B wave going to a new high means that the fifth wave goes to a newer high. ———Mr John Harder wrote his book THE REVERSE WAVE based on this pattern. Most stocks in the 1920’s ended with this pattern. The B wave will become the left shoulder of a head and shoulders. Head is the fifth wave. The right shoulder is wave two of the coming decline.
Interesting anatomy of a crash posted this afternoon. All I have heard for the past few days is about how many cuts in rate the FED will do this year ! Look for in the image ” faith in the central bank is the new religion” . I am posting this because it looks like it aligns with Peter’s analysis of E.W. , just adds commentary on the herd mentality. https://www.zerohedge.com/news/2019-06-10/stock-market-crash-scenario
Hi Peter: when you mentioned the Wave 4 down will be around 2100, then long climb to final new high in wave 5. what do you mean by “long Climb”? few years ?
and what is the best investment tools to park asset when wave 4 down strike? is that the deflation period you are talking about? how long do you think the deflation will last?
thanks a lot for your knowledge!
Hi Peter,
Same good questions, but how to consider also fiat currencies devaluation?
What is your advice for gold?
Thanks for your help.
Serge
Fiat currency devaluation is, of course, inflation. We’ve had two hundred years of that. Now we’ll have a depression and deflation. Gold and silver coins should be a good currency at the eventual bottom, but gold doesn’t appreciate in value in deflation where the reserve currency is still the US dollar (and when it’s priced in that currency). Gold will eventually hit about $700.00.
A little more than a year, I think, to the top from the coming 4th bottom. The best place to invest is in cash (the only place, really) once deflation sets in. I figure seven years to the bottom and another 20 or so (at least) before you see any inflationary “green shoots.”
Peter T
Your opening on the issues with technology has hit home with me .
I could go on with what I have gone through on several things but ill sum it up
with something my father told me many years ago .
My dad was born in 1929 and is long since passed but what he has told me over the years still hods true today .
Way back when there was a company named cooper tire company . they made a tire back near 1939 that basically was to last ” forever ” . The problem was that it just about put them out of business because nobody needed to buy tires for their car afterwards.
Today’s technology company’s know that a basic telephone will still work , even a dial phone or push button with no upgrades at all. So they keep changing the game ( for our improved experience of course ) .
The improvements for the most part are not really an improvement but we are stuck trying to ” keep up ” even though we are not really advancing .
Computers may get faster yet then the operating system needs more memory .
I’m sure you get what I’m saying .
I am reaching the point where im seriously questioning going back to a basic flip cell phone with no internet access .
A couple of years ago I had a fairly big computer build so I could use it to put a lot of my trading stuff together .
What I learned ( the hard way ) was that it really does matter a lot to match your hardware with your software ( apple does this and that is why you cant just go by an apple operating software )
Microsoft attempts to fit as many different setups into their software which is why its buggy . But some hardware developers are much better keeping up with Microsoft than others .
It cost me an extra $1000 bucks to get it right .
The tech companies cannot survive with out change and for the most part cell phones and tech in general is saturated ( most everyone already has it ) .
So they change it up and force us to deal with the changes , the upgrades the replacements etc……
My windows 7 laptop I purchased in 2012 I set up to not do updates and today it works the same as the day I purchased it My high end windows 10 desktop has plenty of horse power yet a week ago I was forced by windows to accept a new agreement in order to use excel . We are being forced to share data .
I find it extremely frustrating at times . I have a couple software programs I want to purchase and they are exactly what I want except I have delayed these purchases because I want to make sure they have the bugs worked out for windows 10. and even that I am hesitant because I am not sure what tech changes will come that will render the software useless .
sure the creator can fix these issues as they come but at some point it comes at a price.
I feel like were actually going backward and not forwards because of this .
I feel your frustration and I’m sure many people do as well .
Joe
Some good stuff in here, Joe. I’m going to keep for some of the examples. Thanks for sharing.
I have some great software that I still run on Windows 98!
Some of the earler children’s software and games remain unmatched in their artistic beauty, and creative genius. Most of what is being churned out these days is absolute crap.
As of today ( Monday )
The lesser weighted stocks that make up the dow have come back
to a smidgen of making a new all time which was made in late april .
The heavier weighted stocks that make up the dow are not even close to all time highs made in oct 2018 nor the lower high made in late feb nor the lower high made back in late april .
Its been a very good run higher yet under the hood it really has not been very impressive .
Im going to place a stop on my futures positions at today Mondays late swing low .
26064 dow futures
this is equal to the ES at 2886.25
Not changing my bullish bias for June I’m just protecting gains
and ill keep the roll over of the futures from June to sept in mind as we move through out the week .
For now staying with the trend until I’m forced to exit .
Hi Joe,
Do you also have such a bullish scenario for July till August 15?
I have a top today and maybe we will see some profit taking till June 14-17, after we will resume the uptrend till June 24.
Thanks in advance
John.
Looks like spike to 5/16 rebound before last downturn… QQQ hitting, SPY above, IWM IYT below. It will be interesting to see what this does to counts.
They attempted to reclaim the all-important 2910-2920 former support shelf with that gap up this morning. So far, they failed!
Peter:
Thanks for your answer, so you mean we will have inflation first ( failed fiat currency) , then deflation which will last 7+ years, am I reading your post correctly?
thanks again
Shunn
We haven’t had inflation for years. Economists call it all kinds of wonderful things to try to get around the fact that we’re heading into deflation (disinflation, stagnation, etc.) Inflation is done. Your dollar is worth less that four cents to what it was a hundred years ago. You can’t get blood from a stone, as the saying goes.
Hi Peter,
I’m new here. Really enjoy your site. I watched your interview with Steve Puetz. As i understand his work a crash window opens today and lasts through 6/20. Another one opens 7/10-7/19.
Any additional thoughts? Thanks.
John
John,
Joe is the resident expert on Steve’s window. It’s likely he’ll see this and reply or you can reply to one of his comments and he’ll get back to you, I’m sure.
Hi John,
Regarding the crash windows, you are pretty much spot on with how I follow it. I would heed Joe’s insights in remembering that crashes are indeed rare events – though I believe at a minimum you do almost always see weakness, but not always, in an index you are following – and that most crashes tend to happen after the SE.
The crash window is actually just one facet of the Puetz eclipe cycle. It tops one new moon before the SE, with a tipping point usually around the FM after the SE. Any panics tend to run for 2-4 weeks. Bottom of cycle is about 8 weeks (from memory) after SE which the eclipse cycle turns up for what is usually a nice run up in price till the cycle repeats. Thats the idealised Puetz eclipse cycle – now there are variations on a theme, where prices can generally top one cycle ahead/following the idealised cycle, and/or prices can run straight up into the FMLE.
Dan.
P.s. I highly recommend Puetz’s first book and his newsletter if you want to learn more about this.
Bearish engulfing candle developing.
Nine confirmed Hindenburg Omens on the clock.
This is a very dangerous market for the unwary, so tread carefully…!
Move below ES 2879.38 confirms a “C”, or third down underway.
A VIX gap higher would point to the more bearish scenario, imho…..
thanx tom!!
QQQ ugh…stubborn today won’t break!!
so close…but…still thinking one more up..
Looks to me like a 5,3,5 upward correction…😉
John
from what I have observed regarding most all cycles based on planets or the moon
is that there are times when these cycles invert . I don’t consider these inversions failures I consider them as just inversions . I have followed and used the puetz cycles for many years since they show up roughly twice a year . there is a theme to them most of the time ( not everything works all the time )
from reading your question im asking myself how do you come to the conclusion
that there is a puetz window opening Today ? and lasting through june 20 ?
where do those parameters come from and do you have any examples to go by ?
I ask this not to sound like an ass but to get you to look at your parameters in hindsight ( looking at an actual chart and looking at the history of that scenario to see if it has any statistical history to gauge its accuracy )
I have found that Steve Puetz work on this cycle is very accurate historically but it is not always Bearish . Many people have argued over the years about this cycle and in my opinion have taken various reasons to put labels on it and claim it as something other than what it is .
im going to post something off the web for you to read and then comment :
You should read the entire article . My comments below .
https://stormchaser80.wordpress.com/puetz-crash-window/
Steve Puetz (mathematician, statistician, and financial expert *1) has found that many of the stock market crashes have occurred in proximity of a lunar eclipse close to a solar eclipse.
“He emphasized that he is not contending that full moons close to solar eclipses cause market crashes. But he does conclude that a full moon in general and a lunar (eclipse) full moon close to solar eclipses, in particular, seem to be the triggering device that allows for the rapid transformation of investor psychology from manic greed to paranoia. He asks what the odds are that eight of the greatest market crashes in history would accidentally fall within a time period of six days before to three days after a full moon that occurred within six weeks of a solar eclipse? His answer is that for all eight crashes to accidentally fall within the required intervals would be .23 raised to the eighth power less than one chance in 127,000.” *2
“. . .Puetz used eight previous crashes in various markets from the Holland Tulip Mania in 1637 through the Tokyo crash in 1990. He noted that market crashes tend to be lumped near the full moons that are also lunar eclipses. In fact, he states, the greatest number of crashes start after the first full moon after a solar eclipse when that full moon is also a lunar eclipse . . Once the panic starts, Puetz notes, it generally lasts from two to four weeks. The tendency has been for the markets to peak a few days ahead of the full moon, move flat to slightly lower –waiting for the full moon to pass. Then on the day of the full moon or slightly after, the brunt of the crash hits the marketplace.” *2
My comments :
first off is a COPY OF THE ABOVE :
He asks what the odds are that eight of the greatest market crashes in history would accidentally fall within a time period of six days before to three days after a full moon that occurred within six weeks of a solar eclipse? His answer is that for all eight crashes to accidentally fall within the required intervals would be .23 raised to the eighth power less than one chance in 127,000.” *2
Would you say that this is a rare event ???
So based on this you would be looking for a crash when ???
I will note that the crash is most likely an end point in time and not the beginning .
When is the next full moon following ( following is a key word here ) 6 weeks after
the solar eclipse ???
Lets take the year 1987 as an example since it is a very good example .
we must look at history and then see when these cycles fail as well as work .
you can look up both solar and lunar eclipses here : https://eclipse.gsfc.nasa.gov/SEhistory/SEhistory.html
solar eclipse Sept 23 1987 ( soros series 134 ) ( these soros series tend to repeat every 18 years )
What day did the stock market , ( dow or spx ) peak in 1987 ????
Lunar eclipse : Oct 7 1987 ( where was the cash dow or spx on this date ? )
If you add 6 weeks to the solar eclipse date and find the full moon surrounding
that time period what date do you come up with ??
Also ill ask that you look for the first new moon following that lunar eclipse.
ill go through the break down .
Aug 24 1987 New moon
https://mooncalendar.astro-seek.com/moon-phases-calendar-august-1987
Sept 23 1987 Solar eclipse
Oct 7 1987 Lunar eclipse
Oct 22 1987 New moon
https://mooncalendar.astro-seek.com/moon-phases-calendar-october-1987
Nov 5 1987 Full Moon
https://mooncalendar.astro-seek.com/moon-phases-calendar-november-1987
Now lets take a year like 1937 ———
do the same thing ——-
Take any year with a steep decline that stands out like a sore thumb , I don’t care if its a 10 percent drop or a 5 % drop but look at several .
Also just to compare a few things go forwards or backwards 18 years and check the saros series and see if they are the same .
the saros series are usually the same but not always , and there are times when
you see the same saros series line up on both the lunar and solar eclipses.
all that considered there will be times when everything inverts .
By an inversion im saying you get the turns in the market correct but what was
a high in one cycle is a low in a different cycle yet the pattern is almost an exact opposite .
1987 plus 18 years would be the year 2005
1987 minus 18 years would be the year 1969
For a complete run of the mill back check
take the year 2019 -18 yrs = 2001 – 18 yrs = 1983 – 18 yrs = 1965 – 18 yrs = 1947 – 18 yrs = 1929
2020 – 18 yrs = 2002 , 1984, 1966, 1948, 1930 .
Im sure you are noticing some important historical dates showing up .
I know I did not answer your question but I think it is up to all of us to take the time and print out a chart note the dates of the market turns and to pay attention to how these cycles line up , invert , or fail .
I have been following peter on this site for around 5 years now . There have been times when my timing has just been terrible yet I was doing the same thing then as I am today .
When this stuff works it blows me away yet when it fails it fails badly .
this past year and a half things have been working very well and for the most part pretty accurate so ill go with it until it fails .
I use many different approaches to market timing and the puetz window is just
one piece of many .
The reason I look at the puetz cycle is because it shows up at least twice per year and it tends to last 2 to 2 1/2 months .
Those 60-90 calendar days twice per year come out to 4 to 6 months of trading .
If my other stuff fits into this as well , it makes my swing trading a bit simpler.
I have no opinion of the market right now today short term .
If everything sticks to plan though we just see a cycle high near july 2 ( the solar eclipse )
Trade by your own research though and don’t take my word when risking your own money .
Take the time to do a bit of research to under stand how this one cycle has worked in the past .
I wont confuse you by adding in the others im currently working with .
A Lot of things Are lining up is about all I can say .
Peter T using Elliott wave theory has done an excellent job navigating these markets .
Combined its pretty impressive .
That is about it
Print the response , use the links and see for yourself before assuming its always a crash , Inversions can be your friend if you understand them .
1937 the year
solar eclipses : https://eclipse.gsfc.nasa.gov/SEcat5/SE1901-2000.html
Lunar eclipses : https://eclipse.gsfc.nasa.gov/LEcat5/LEcatalog.html
Solar – Dec 19 1936 – Saros series 126
Solar – June 8 1937 – Saros series – 136
Solar- Dec 2 1937- Saros series – 141
Solar – May 29 1938 – Saros series – 146
Lunar eclipses :
Dec 28 1936 – Saros series – 143
May 25 1937 – Saros series – 110
Nov 18 1937 – Saros series – 115
May 14 1938 – Saros series – 120
1937 plus 18 = 1955 , 1973, 1991, 2009 <————
Year 2009
Solar eclipses :
Aug 1 2008 – Saros series – 126
Jan 26 2009 – Saros series – 131 <—Note ( odd one in the mix )
July 22 2009 – Saros series – 136
Jan 15 2010 – Saros series – 141
July 11 2010 – Saros series – 146
Add 6 weeks to Jan 26 th 2009 and find the full moon
( im keeping this very simple )
https://mooncalendar.astro-seek.com/moon-phases-calendar-february-2010
2009
Lunar eclipses :
Feb 9 2009 – Saros series – 143 ( note same series as dec 28 1936 )
July 7 2009 – Saros series -110
Aug 6 2009 – Saros series – 148 Note ( odd one in the mix )
Dec 31 2009 – Saros series – 115 ( same series as Nov 18 1937 )
June 26 2010 – Saros series – 120 ( I believe we had the Flash Crash in June 2010 ? )
Dec 21 2010 – Saros series – 125
Note : Feb 25 2009 was a Wednesday New moon, March 22 was the full moon roughly 6 weeks following the Jan 26th solar eclipse , The puetz window did work back then
yet there was also a Mars Uranus crash cycle in effect which ended on
March 6th ( a Friday ) Monday march 9th was a Monday .
My brain is about fried going through all this but it is an example of a back test .
Now based on the above ( assuming I did not make any errors )
I would line up the 1936- 1938 eclipse periods to 2008- 2010 eclipse time periods.
It does not matter to me if the dates are a bit different ( aug 1 2008 vs dec 13 1936 )
and running it to its end points of ( May 14 1938 vs June 26 2010 )
yes I could go a bit further towards dec 2010 date and the next one in 1938 not posted . my point though is at times these line up and can be used as a guide only .
Keep in mind I can also show BULLISH SET UPS AND THESE ARE NOT ALWAYS BEARISH .
It takes several hours to go through all of these and I have pages and pages of examples which I do not intend to post .
If I was to go further
id also include Venus transits of roughly 8 yr intervals
and mercury transits
also mercury retrograde time periods
there is even more to all of this and it is important to never hang your hat on any 1 theory by itself when it comes to timing .
Typically when all this stuff is lining up you will begin to see a Fibonacci time series also line up .
So Fibonacci calendar days , trading days , weeks , months etc should be considered as we move forward .
This is all I can say with out writing a book .
I think that was your first chapter 🙂 thank you for sharing it!
Stocks – Profit-Taking and Fatigue Keep Market in Check…a headline ?!!! who writes this stuff ??lol
Tom C.
I have no opinion on this but im curious to know if you see any value in this kp forcast.
Not asking for your formula just curious if im starting with something you may
find useful .
https://auroravillage.info/forecast/
Hi Joe
I’ve never seen that kp page before
not very detailed
my indicate possible turn dates
you will have to do some back testing to confirm
guessing some of this as informational as well
http://auroraforecast.is/kp-index/
I think based of 3 day forecast. Best time to buy futures put options would be tomorrow evening/night for friday expiry.
https://www.swpc.noaa.gov/products/3-day-forecast
12 minute video for those interested in the present sun spot cycle .
its just one guys thoughts yet he does conclude we are into a global cooling period
https://www.youtube.com/watch?v=KhxRU_mqUSY
https://www.youtube.com/watch?v=ztninkgZ0ws
Gentlemen, just came across this interesting posting.
“There is nothing on the face of this earth that can painlessly prevent or reverse the economic disaster that this Dollar Index Chart is telling us is about to happen.”
http://www.321gold.com/editorials/rosen/rosen061219.pdf
Feedback welcome.
Other than the fact that the guy doesn’t understand EW and is wrong ….
Why would a dollar collapse lead to financial meltdown ? Given that its the reserve currency of the world, that would be a good thing for risk assets (and commodities – in fact anything measured in dollars). If the claim is that some other currency is about to replace the dollar as the reserve currency, then maybe… but that seems unlikely. The other way it can work out would be that this would be the end of fiat currency era that started about 100 years ago. That too doesn’t seem likely. I would have expected negative interest rates for a few decades before governments were forced to give up this easy money source.
I don’t understand how this comment relates to the last one, which was (I thought) about the EW count on the US Dollar Index. The projection of a third wave down without a first and second wave makes no sense.
Your most recent question is imho, a bit of a non-sequitur. A financial meltdown historically doesn’t necessarily relate to movement of the reserve currency of the time, but rather a result of unmanageable debt and a collapse of the banking system. You can go back to 1320, 1492, 1663, 1835, etc and it’s the same thing.
The wave counts don’t make much sense to me.
the dollar index was fairly overbought back at its highs yet a lot
of time has gone by with no price drop .
I only look at the dollar from a distance so ill just say that up front .
I look at a monthly chart of the dollar index maybe twice a year at best .
The indicator I use on the Monthly dollar index has come back a long ways
from its april 2016 and april 2017 peaks .
Even though the index is down for the month ( maybe a bearish puetz window in effect ?? ) Its looking a bit oversold ( not extreme mind you )
The rally in the dollar index from sept 1992 to july 2001 though lasted 106 months . The rally from the march 2008 low to the Jan 2017 high also lasted 106 months .Gold did put in a low between may 21 and june 3 so ???
other than that id say the dollar index will probably go much much higher and that as the dollar bottoms , most likely the major stock index’s will peak
Just my opinion mind you so take it with a grain of salt .
Yes, this is the scenario setting up based upon the EW count and wave structure. I analyze the dollar index every day.
Banksters trying to defend QQQ 182.93, SPY 289
and want VIX < 16
Keeping my thoughts on the stock market to myself this morning
yet the cash dow ( not futures ) back above 26065 is technically bullish to me.
Leaving my powder dry on spec trading and will most likely
sit out the week and just let the stocks I own do the work .
Options and futures expiry is the 3rd Thursday of the month .
That is June 20-21st ( not this week )
No opinion short term on this market .
Marie
headline for you ( made up )
Stocks go nowhere because of no trump tweets 🙂
depending on the close I can change that to
Stocks ( rise or fall ) because of no trump tweets .
lol
have a good week everyone
Joe.. ha 😉
qqq 2 hour ppo and ema soooo close to crossing …but they prob won’t let it go,,
unless the astro guys are right and sharp drop tmo..
also NVI still in a channel..on upward slope atleast at this point…
meaning negative volume index for QQQ
So far, June 11 is a top. We can drop down from here or go sideways till June 17,
After that we go up till June 24, That is a very important date in my opinion.
Tom,
How does this picture relates with your Pink Panther chart?
Banksters defending DJIA 26K with a singlemided ferocity I have seldom seen
Wassup wid dat? 😁
May have something to do with a risk/parity trigger
Yeh, I still it pivots around 16 VIX, closer to bottom of range than top… we’ll see
John, I have been tracking your stuff on my charts..you are pretty close to on spot with the dates.. ….awesome job..
Thanks Marrie
Peter T – I cannot attend your chart show live – so I end up watching a replay later in the day when I can find the time. Today’s replay was only about 3 min. Another one of technology problems for sure. Is there anyway you can upload the full show. Thanks.
I was going to do that today also
energy chart update
https://imgshare.io/image/june-10-th-june-14th-energy-chart-motop.5osZc
Thank you Tom! So, the energy chart ramps up tomorrow. Hope I can get a decent hedging (long) entry in the morning for my existing short position.
Thanks Tom.
Rather amusing price action in the futures market. A violent decline below DJIA 26K was met with frantic cash infusions of BILLIONS! As bearish as I tend to be, the panicky behavior of the banksters is starting to worry even me…! Lol!
A new high in VIX will signal their failure, regardless of where the market is trading.
Caveat Emptor!
From an EW perspective, did anyone else think the ES and Cash charts looked different? Maybe ES caught up last night with its own expanded flat with both completing C waves up today, Just thinking out loud,,,
The different counts are playing out with catch up on QQQ and others, as Peter highlights. This 1st half hour and pre-market will be tricky with moves above and below resistance/support. How is that for decisive 🙂 Markets more OB than OS so I will hold my hedges.
I cashed out hedging SPY 288 calls for a quick double shortly after the open.
I expect 2900 to remain formidable resistance. Any move above means its time to reload hedges imho….
Looks like possible pocket entry to shorts or VOL, but until VIX stops doing chin-ups below 16 and moves higher, banksters and machines in play.
so of course I opened a pocket :/
Thanx Tom!
From an astro point of view, I see a big move down around June 24/26.
Till that time we can go higher starting June 17 or go sideways…till June 24/26.
Well 3 day forecast changed … earlier it was showing weakness till mid day /end of day today. Now it shows weakness was earlier in the morning or late night yesterday after that it was all ramp up . So this forecast does change.
https://www.swpc.noaa.gov/products/3-day-forecast
3rd or 4th time machines try to push back on QQQ 182.93 and SPY 189…
Closing above 26065 for the week is a bullish signal .
The market though appears to be deteriorating .
This is typical of the market topping process .
what this means is that as the major index’s go to new highs
many individual stocks stagnate or break lower .
its take a while before these divergences finally break the entire market
along with the index’s .
The hours Trin has gotten oversold ( its a very short term indicator .
The 10 day Trin is on the verge of giving a Sell Signal
The 10 day advance decline line is near its upper range
the 5 day advance decline line made a high on june 7th pulled back
and is now heading higher yet its not making a higher high even though
the 10 advance decline is .
I am seeing bearish divergences .
Technically these are all bearish signals .
My issue personally is :
Timing says we go higher into july , we have options and futures expiry next week.
A close above 26065 on the cash dow is bullish ( weekly close even more important )
Yet technically , internally , the market is not looking very good .
I am going to stick to my Mid August cycle high despite what im looking at
as long as the dow can get above 26065 .
Im more interested in how the market moves after next weeks expiry then this week.
Short Term Timing im not touching at this point
Spooky Joe, this QQQ 182.93 has been nagging just like your 26,061… it’s like a ghost HaHa
http://www.fiendbear.com/bear1939.htm
The secular bear market that began at the height of optimism in 1929, finally reached its bottom at the height of despair in the early spring of 1942
Lindsay time count
Sept 1929 plus 12 yrs 3 months to 12 years 8 months .=dec1941 to may 1942
———-
Investors who once thought that the good times would never end in 1929, now feared that stocks and the economy would remain depressed indefinitely. The Dow reflected this sentiment and fell to its final low of 92 in late April with volume on the NYSE reaching only 300,000 shares traded. This incredibly low volume (even lower than at the 1932 bottom which had over 700,000 shares traded) was indicative of a complete disdain for common stocks by investors.
July 19 2007
Oct 9 2007
Oct 31 2007
Dec 10 2007
Keep it simple
The last major top began between July 19- Dec 10 2007
Adding 12 years 3 months to 12 years 8 months to this date range
from shortest period to longest
calls for an important low by just this lindsay time count
of which there are a couple methods to add to this once we see the actual high .
The general area of time at this point should be .
Oct 2019 to August 2020
This time frame does not include any planetary aspects .
The year 2020 should be a bearish year
This is just something to be aware of as we reach the mid august cycle high .
This website is for educational purposes relating to Elliott Wave, natural cycles, and the Quantum Revolution (Great Awakening). I welcome questions or comments about any of these subjects. Due to a heavy schedule, I may not have the time to answer questions that relate to my area of expertise.
I reserve the right to remove any comment that is deemed negative, is unhelpful, or off-topic. Such comments may be removed.
Want to comment? You need to be logged in to comment. You can register here.