
 It’s that time of year again! Time for a feel-good rally, just in case, you haven’t had enough “feel good!”
Happy holidays!
Reality lies just under the surface, however. We have one of the most persistent rallies in history that’s coming to an end.
We’ve been stalking a short entry for awhile now, but it isn’t going to happen until the last subwaves have played out. If you look at the SP500, you know we’re close. In fact, we’re in the fifth of the fifth of the fifth, with a pattern that threatens to move sideways to slightly up until the underlying positive social mood turns down.
We’re in a triangle—whether a contracting triangle, or an ending diagonal is still to be unveiled. That’s the situation on the NYSE side of the equation. On the Nasdaq side, we’ve just completed an impulsive first wave up of an expected five wave move to the final high.
But the impending trend change doesn’t just involve the US market; it’s an international phenomenon. The DAX is threatening a trend change after what appears what could be the start of a first wave down already in place. Whether we have one more top here is questionable. Other indices are showing extremely bearish patters: FTSE and TSE are great examples.
For almost two years, I’ve been talking about “all the same market,” which means that all assets are gradually move closer and closer in parallel moves to a final high.
Over the next couple of days, you’re going to see just about every asset class move into the final subwave heading for the final change in trend.
- USD currency pairs are all within hours of bottoming out (USDCAD and USDJPY, which move opposite the other USD currency pairs are topping, of course).
- WTI oil is at the bottom of a fourth subwave with a final high in its sights.
- Gold and silver have dropped, as expected, into their final waves down before they bottom. I’ve been predicting their bottom with the top in the US indices.
It looks like Santa is coming to town for the usual seasonal rally. I expect a final rally to last through the holidays, with a top expected either at the end of the year, or into the very early part of 2018.
Time for a look at the really big picture:
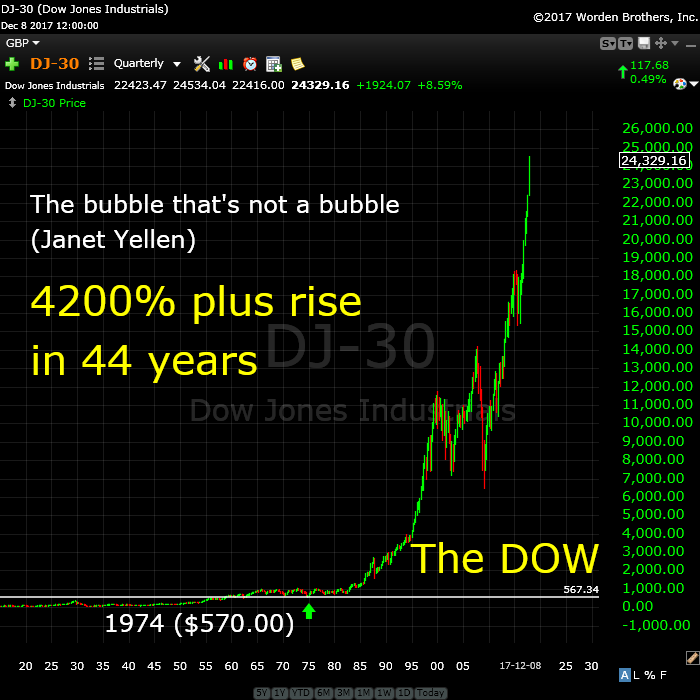
Above is the quarterly chart of the DOW as an arithmetic chart. A bubble perhaps? How about the biggest bubble in history, Janet? I think the chart otherwise speaks for itself.
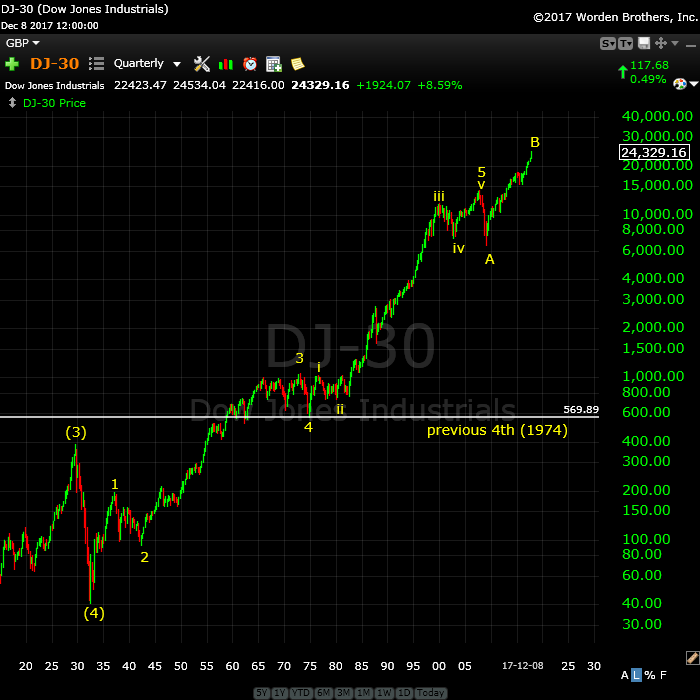
Above is the same chart as above, but as a log chart. This version exposes the underlying wave structure from before the crash in 1929, which was the second wave. The fourth wave of the third was in 1974 and this is typically the area a major correction would revert back to. I’ll let you contemplate that.
This wave count brings into contention Bob Prechter’s assertion that you can’t have an “irregular top” (page 58 of “The Elliott Wave Principle). However, Ralph took great pains to discuss the phenomenon in great detail. If you’ve been reading this blog for awhile, you know that I’ve been maintaining the final wave up (wave B) is corrective. I have been unable to come to any other conclusion given an analysis of the subwaves. The wave being corrective also support this count. I have no other option that to label the final wave a B wave (that I can come up with, at any rate).
And finally …. fiat on steroids!
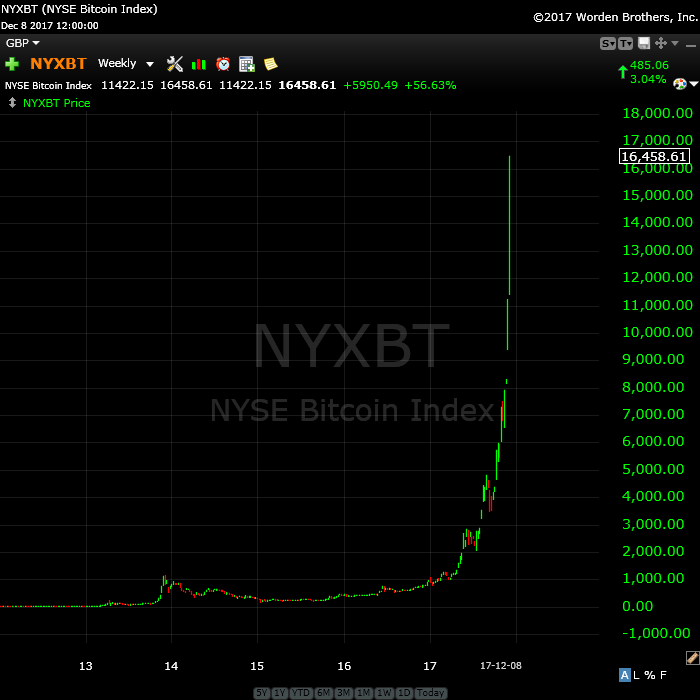
Above is the weekly chart of the NYSE bitcoin index. Note that it’s generally agreed that bitcoin has no intrinsic value (hence my comment above on “fiat on steroids).
Blockchain, the technology it’s built on is a method or securing the transactions in a way that makes them impossible to lose, unless hacked (and we’ve already seen some of that!) Everyone seems to be focused on the technology, not on the fact that it’s subject to the same market forces as other fiat commodity (or currency). However, this is not a currency; it’s a speculative commodity built on a new technology that has uses in many areas, but not necessarily as a currency.
I wait to see the outcome. To me, it’s obvious.
________________________
Problem receiving blog comment emails? Try whitelisting the address. More info.
______________________________
Couldn’t be happier … KK 2
Couldn’t be happier …The analysis and insight you provide is simply amazing! I’ve been trading the futures and equity markets for well over thirty years and usually average around 5% monthly. Since joining your Traders Gold Service two months ago, that number has better than doubled. I couldn’t be happier.—KK |
Have not had a losing week RW 2
Have not had a losing week …I have been with Peter almost a year. The only thing that matters is have I made money with his service. I think I have finally turned the corner using Peter’s EW. I have not had a losing week in the last 5 months. Thanks Peter, for your amazing amount of hard work. —RW |
The best of them JL 2
The best of them …Last couple of years, I subscribed to several ‘market traders’. You are by far the best of them and the personal contact is awesome. Daily and daily updates are very well written! Besides your expertise in EW, I also like your cycles analysis. Best investment I ever made! —JL |
A true expert in Elliott Wave FL 2
A true expert in Elliott Wave …You are a true expert in EW analysis. What you provide is not available anywhere and is priceless. Subscription on your services is the best thing I have ever done. Many thanks for your effort to make me a better investor. I now have more trust in my investment decisions. I hope you will continue the excellent work! —FL |
Rise above the rest … SM 2
Rise above the rest …I have only ever met a few people who, in their chosen fields (astrology, medicine, music, martial arts, technical analysis), rise above all the rest and you are one of them…you have ‘the gift’…and that’s why I’m a Trader’s Gold member. —SM |
the real deal SM 2
The real deal …‘Educational, insightful and thorough market analysis for all levels of traders. It’s Elliott Wave at its best….Peter Temple is the real deal’ —SM |
Tops in your field DZ 2
Tops in your field …You are tops in your field. Tried to follow Elliot Wave international for years. They were always behind the market. After discovering you, I perceive that you are an expert in reading the waves, which puts you way ahead of the rest of your peers. And you can read the Waves like you are reading tomorrow’s financial section. I pray you stay healthy. —DZ |
Get an upper hand … JC 2
Get an upper hand in trading …Seeing all the different currency pairs and the wave structures and hearing you explain why this has to do that on a nightly bases gives one a upper hand when trading. Elliott Wave applies to all stock and indices and can be applied to any candlestick chart. If someone ask what you want for Christmas – Tell them a membership to Peter’s “Traders Gold!”—JC |
The Market This Week
Here's the latest daily chart of ES (emini futures)
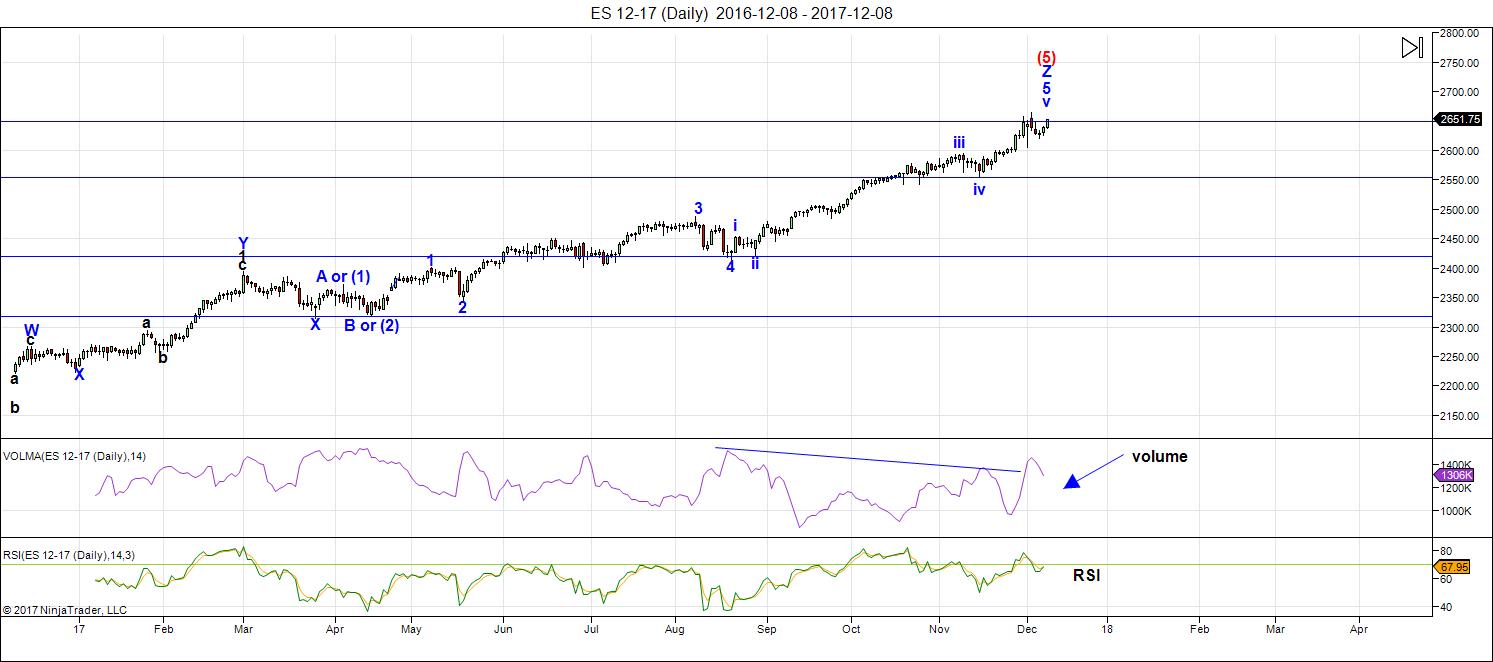
Above is the daily chart of ES (click to enlarge, as with any of my charts).
There have been no material changes to my prognosis. We are at the high. I expect this final wave to breach the previous high for the final time.
We're now down to hourly charts for all the action. It's been a day trading environment for the past few weeks.
Volume: With the sharp drop this week in a fourth wave, volume has spiked, as would be expected. That's the selling starting. However, we still have one final high left to go.
Summary: The count is full for the US market in general, except for small subwaves that form the balance of a motive set of waves in SPX and some other major US indices. I put us in a final triangle in ES (either a conventional converging triangle or an ending diagonal—it's too early to tell which one it is). For the Nasdaq, we look like we'll get a final 5 waves up to a new high.
_______________________
Here's the latest 60 MIN chart of ES (emini futures):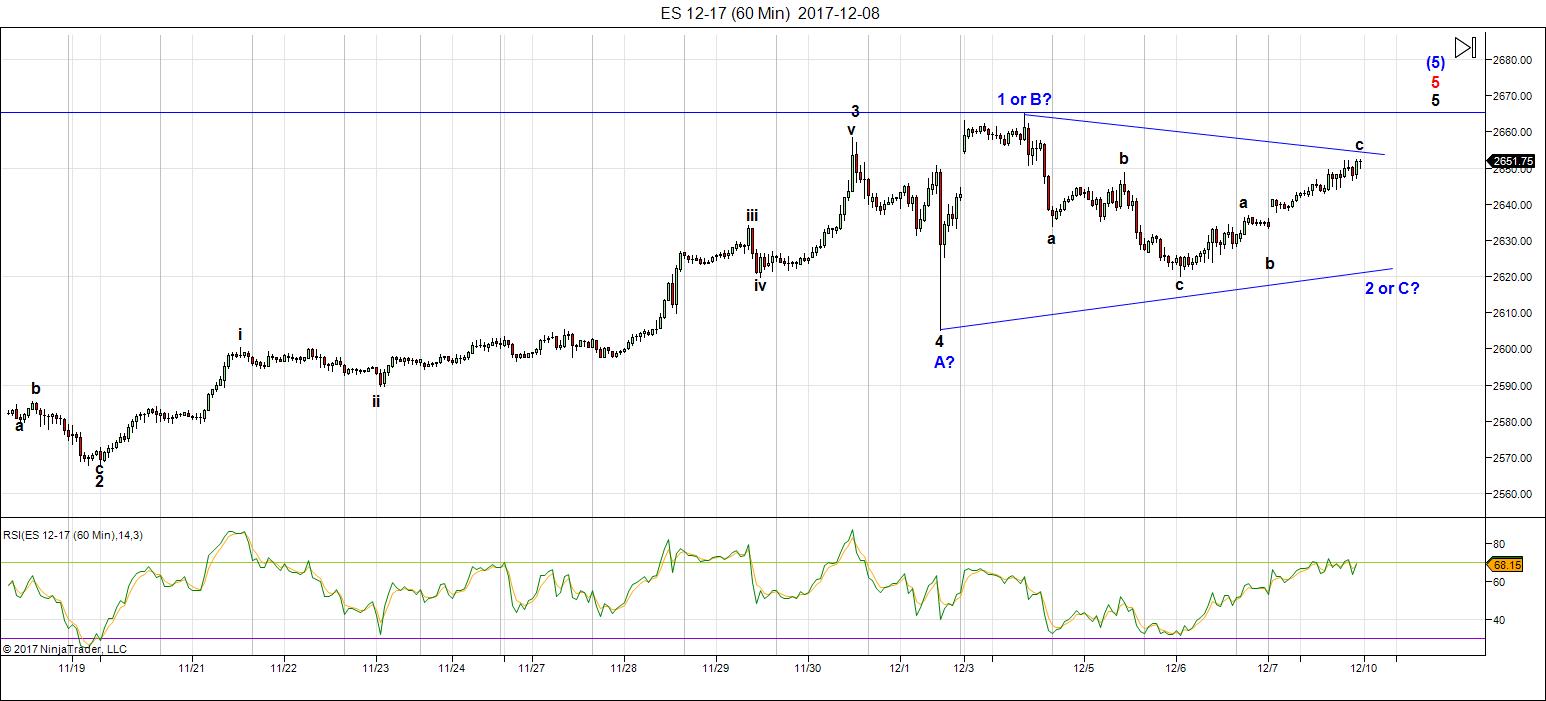
Above is the 60 minute chart of ES (click to enlarge). Please watch the video to get the full story on what's happening short term.
There's no question that ES is tracing out a triangle, but what kind of triangle is still up in the air. The obvious indicator was the wave up to a new high on Monday, December 4. This wave up was in three waves—no question about that!
I've started to label the points of the triangular structure. A contracting triangle (labelled in letters, because it's corrective) would include the fourth wave. An ending diagonal is labelled with numbers (because it can be found at the ends of both impulsive and corrective waves) and is a fifth wave pattern (it does not include the larger fourth wave in its structure).
Because the C wave of a triangle (or 3rd wave of an ending diagonal) is the usually the most complex wave, and because NQ needs to drop in a second wave, I would expect ES to drop to a new low slightly below the c wave (to the area of the lower trendline).
It's otherwise too early to provide much more information. However, my preference leans towards an ending diagonal as NQ looks like it has a full five waves to trace out, which will take it to a much higher high.
Short term: The wave count is now virtually complete. We're tracing out a final triangle in ES, which is a final pattern before a trend change.
___________________________
Trader's Gold Subscribers get a comprehensive view of the market, including hourly (and even smaller timeframes, when appropriate) on a daily basis. They also receive updates through the comments area. I provide only the daily timeframe for the free blog, as a "snapshot" of where the market currently trades and the next move on a weekly basis.
______________________________________
Sign up for: The Chart Show
Next Date: Thursday, December 28 at 1:00 pm EST (US market time)
NOTE: No Chart Show on December 21—cancelled.

The Chart Show is a one hour webinar in which Peter Temple provides the Elliott Wave analysis in real time for the US market, gold, silver, oil, major USD currency pairs, and more. You won't find a more accurate or comprehensive market prediction anywhere for this price.
Get caught up on the market from an Elliott Wave perspective. You’ll also get Andy Pancholi cycle turn dates for the SP500 for the balance of the current month. There’ll be a Q&A session during and at the end of the webinar and the possibility (depending on time) of taking requests.
All registrants will receive the video playback of the webinar, so even if you miss it, you’ll be sent the full video replay within about an hour of its conclusion. For more information and to sign up, click here.


I always look forward to your start to the week article.
Great post!!!
???
Thanks, Jody.
Boss – mucho gracias!
although – as usual i will need to throw my usual sunday evening…….. BE WARNED!
this is what i am seeing in the ES – you told last week to find the ED because all i was seeing were 3 wave structures……………..well here it is – right underneath your nose, upon your face……………………. https://invst.ly/61sqr
any drop off from here is a failed 5th……………… verne, jody…..BE WARNED!
Keep up the very good work. After 15 years in the business this is no where to be found!!
Have a good and profitable 2018 From Holland Sweet Lake City
crickets??? hmm……….
verne…..verne…….”VERNE”…….
wake up verne……… you dosed off…….[pointing to “saliva” pooling upon the right shoulder of his shirt]……. “hey” , did you “drool”??…… verrrrrnnnne!!
Awake and aware! 🙂
Here is a most remarkable graphic, on the verge of a historic first.
Could we possibly see its mirror image for some 12 month period in the future?
This is unnatural in the extreme and entirely contrary to the notion of market ebb and flow. You cannot look at a situation like this and fail to recognize the new paradigm of CB intervention in maintaining a constant bid under market price. Remarkable!!
https://www.marketwatch.com/story/global-stocks-could-make-history-this-month-by-refusing-to-fall-2017-12-08
verne,
unnecessary reading. we know what CB’s are doing. We also know, they will pull the rug from under their bubbles. Societies have never collapsed in deflation. Societies have in fact collapsed through hyper-inflation. A collapsed society implies a collapsed central bank………. hmmmm……
deflation looks like the soup du jour……………….. and speaking of soup….what say you on my ED chart???????????? verne….huh???
https://invst.ly/62285
Not sure if we are going to see an extended fifth. It sure does seem interminable doesn’t it? It is what one would expect for a historic 500 year top.
The sideways consolidation pointing toward at least one more move up.
Interesting read ….. http://www.rationaloptimist.com/blog/block-chains-bitcoins-and-distributed-ledgers/
Peter, You have market the upmove since 2009 as a B wave. How high can the B wave go with respect to A wave? Is there an upper limit for B wave beyond which you have to consider an alternate count? Like B<2*A.
*marked the uomove since 2009
Amit,
I have no way to predetermine the length of a B wave in this situation. That’s where the subwaves come in. We’re in the final wave so the top is nearby.
Possible third wave of ED in ES now looking better at higher than first wave. Not sure if it is shorter though….
If that is what we have another zig zag for a fourth wave should immediately ensue…
Possible fourth needed to move below 2660.38 which it did. Unless that was just the first “a” wave of the ZZ, new high should be just ahead….
verne,
i am expecting a ‘failed” 5……… the implications is that dec 4th was the intraday top.
at the 1 min level on the ES – from the ED chart above…..we another ED pattern playing out……..https://invst.ly/6237c
The explosion of three wave moves is really quite remarkable; never seen anything quite like it…
An overthrow of the 1-3 trendline is more common. Everyone is expecting a SC rally. There is no mistaking the end of EDs. It is typically swift and brutal, retracing quickly to the inception. We simply have not been seeing that happen with waves that start out looking like EDs, but that end not acting at all like them.
Perhaps we slowly grind up (seems to be what’s happening) then Janet “The Grinch” strikes on Wed & the Santa Claus “rally” is just a 62% retrace of the drop… Not what I think will happen, but who knows, anything is possible.
QQQ close 155.9 🙂 https://worldcyclesinstitute.com/a-teetering-top/#comment-25013
First time VXN breached Sept. 15 low.
I think the only chance we have left for a top is when / if lury stops expecting / calling that failed 5th 😀 ahah sorry lury – I love your posts and ultra-love your style, you really brighten my days – but I tend to trust Peter’s judgement on the non-existance of such a wave…
Peter…in your post I don’t understand (fault is on my side) if you expect the top in 24/48 hours (right about now…since S&P is shooting for the moon) or at the end of the month…with this rate of ascent, by month’s end we will be over DOW 30.000 🙁
dearest mark…….. cough…………………………..
i will begin this filibuster by reading names from the phone book…….afterwards, i shall read ‘select’ passages from “The End of Days” by zecharia sitchin….. ahem……
……sigh………..dear mark — BE WARNED! https://invst.ly/62530
Mark,
I’d forget the failed 5th idea. The structure isn’t giving a lot of clues, but it looks like the contracting triangle option for ES/SXP is dead with ES going to a double top after the session close (there are other possible triangle options (running, barrier)). We may still have an ending diagonal in play, but I need to see where we open tomorrow.
While I thought we were most likely looking at month end, today’s action may have advanced the final top.
We have the Fed rate decision on Wednesday, along with the ECB and BoE rate decisions on Thursday, so we might see a lot of volatility this week. A top? Certainly possible … perhaps any day now.
Yep! 🙂
The guys over at EWI are very strenuously insisting that a top is in. Quite remarkable really. What IS the matter with those guys???!!! 🙂
How can this be the top when TSLA just kissed 200 sma & 50 sma?
Unless, it’s the kiss of death … Look at TSLA chart 11/25/15, 12/16/15, 12/30/15.
49.49 x 49.49 = 2449
2449 + 216 (Oct ’87 crash low) = 2665
Anyone believe in double tops these days ? will know soon.
Geometry…….
Concentric Circle pegged off Oct 2007 top (1576) dragging down to March 2009 low (666) to align with 76.4 level. Bull market now touching 100 level….levitation!
Range of 1987 crash low (216) to March 2000 top (1552) = 1336
1336 x 150% = 2004 + 666 = 2670
like 15th & 23rd August 2016 ???……
Wayne,
Trying to understand your post. Why did you use 49.49 x 49.49? Do you have a concentric circle diagram or chart you can post? Lastly, why a 150% x the range created by the 1987 low and the 2000 high?
Yes very good questions Ed, sorry the post was WD Gann orientated
ie: past bottoms/tops tend to provide next tops/bottoms – 100%, 125%, 150% & 200% of past ranges.
Gann was big on ‘boxing the market’ which is running ranges of previous bull runs off next bottoms. Similar to Fibonacci and how Peter uses 100% – 162% of previous waves to predict turns.
the 49.49 is abstract. Gann referred to 49 as the death zone….. 7 squared.
I was more interested in the 2449 which covers hours in the day ’24’ and square root of 49 = 7 number of days in the week…..bit different for the numerology fans.
Concentric Circles are not Gann but geometry…with Fibonacci ratios. Like any technical element, you can run many parameters until you find one that works. Then you hope it keeps working : ) Will try add chart for you
https://imgur.com/CPtsj9J
Wayne,
Thank you for your response! Very interesting!
I am now expecting to see a final “melt-up” move to conclude this long running drama. We have had Santa Claus Rallies each of the past eight years or so. It will be fueled I think by some serious extra pumping to down-play any rate hike as the banksters assure the crowd- “Nothing to see here! Move along!”.
Of course we all know that rising interest rates is going to ultimately have a significant impact on the price of equities. I consider a break below 2620 necessary for any confidence in a significant top.
cough…….. morning verne…….
https://invst.ly/62cns
Top”O the mornin’ luri… 🙂
Nice! 🙂
I have to say it is very surprising how many very good analysts are confidently asserting that the impending too is only a high degree (intermediate or primary) third wave, with the end of the bull market 1 or more years away. Few folk other than Peter talk about the historical implications of where we are, much less seeing us in a final wave up. Among the few are people like Harry Dent and David Stockmann, both of whom greatly underestimated the pumping prowess of the banksters and were way too early, of course our hapless friends at EWI (broken clock syndrome), and Robert McHugh. Two analysts at SafeHaven, Enda Glynn and Adam Taggert are also calling historic tops. Is everyone asleep?!
no verne – i am awake and charting.
the “others” you refer to are counting 5 waves to a top. Peter is counting 3 waves ABC to a top…..which is the “why” behind the discrepancy.
I am in full agreement with peter that the move off the 2009 lows are “corrective” in nature. For me it all resides in the wB versus w2 argument. What we are calling a wave B bottom back in 2011 – they call a w2…….. time will reveal all that is…..
is this the triangle you were bellowing about for the last few days??
https://invst.ly/62djl
and remember verne,
expect the unexpected………………………………for no one “expected” the spanish inquisition!!!
for example,
versus a “thrust”, which you “expect”…….w5 could look as follows….
https://invst.ly/62e21
Yep. I like your label better as I would otherwise have to envision a particularly dwarvish E….thrust up notwithstanding…
why i think ED for ES…is because INDU$ may have topped already.
https://pbs.twimg.com/media/DQ2mXmZW0AE3Uvx.jpg
Both the C leg of a corrective larger b wave and a regular impulse will count as five so either way you END with five up…
there are 5 fingers on my hand verne …………. 1, 2,3,4 [and i am assuming my two thumbs will count as one finger] 5!!
………………….i am lost in translation……………..so i need to give you the patented luri — “HUH?!!?”
verne – here is us in an ED for the ES?? thoughts?? i am throwing a bit of spaghetti right now….. but the next 4 days sport the crescent moon. Market plunges have the greatest potential to occur during the crescent moon…..
https://invst.ly/62fqp
Aha! A yet unfinished third wave! Proportions look great to me and I think the label of the triangles as fourth waves is absolutely perfect. This also makes sense with what RUT and NDQ are doing in expecting another move down prior to the final wave up as they have yet to make new ATH…
The current article by Adam Taggart on SafeHaven is scintillating.
One of the more informative and insightful pieces I have read recently. I sometimes wonder if my outlook is overly gloomy. His about the exponential nature of the kind of bubbles we are facing suggests I may not be sufficiently so…
http://www.safehaven.com/article/44865/youre-just-not-prepared-for-whats-coming
Seems like we need to at least touch this upper trend line if not thrust through it one more time before the reversal.
https://invst.ly/62esm
ted,
my thoughts exactly…..meaning we are “there” …..there…………………rather than “there”[two weeks from now – there]……………………
from the 45 minute time frame as compared with your chart…..it is…..”THERE – THERE”…https://invst.ly/62fk5
And ES keeps tracking higher. Will it ever stop? Or top?
No….Never!!!! 🙂
So far so good. I want to see VIX continue to chase this fifth wave to confirm we are not going to get a fifth wave extension…
Another hedge fund manager walking away. What will John Burbank venture into next?
You guessed it!
Cryptocurrencies! 🙂
Oh….my…..!!!!!
I love trading triangles and consider them one of my “bread and butter” trades. Although I was fully expecting this bolt higher, I just could not bring myself to trade the move up. I am waiting and watching, or as my Jamaican friends would put it…I an’ I mon a watch an I a wait! 🙂
v,
what kind of triangle are you seeing so clearly? is it an ED? or a w4 triangle? if w4 what kind of triangle??
i need your insight….
I am absolutely awful at putting the triangles properly within a larger wave form context. I can see them on the sixty minute chart get the direction with pretty good consistency but am not at all sure that what I am calling triangles would fit the formal EW definition. I pretty much just look for three wave sideways movement and try to determine what the trend was prior to price entering that consolidation “triangle” zone. The problem is that triangles can and often do form part if a more complex wave structure like double combinations and the pattern is often not clear until the entire movement is over….
BTW, the chart you posted this morning showing the triangle finishing a wave four I had labeled as having a possible tiny wave E with a thrust up from it.
In other words, just in case my prior musings made the matter perfectly cloudy, the triangles I am referring to are ususally just the sub-waves…capsice???! 🙂
gotcha…..
because of the new high – i have two choices……
#1….https://invst.ly/62i5a or
#2…..https://invst.ly/62i5u
Neither one of them is correct, imho, but you’re warmer on the first one.
……. warmer???…..peter that is like calling someone “fat”……… grrrrr….. please pass the cheetos por favor!!!
I will work on it some more, but i have cycle- timed that the market will “plunge” either tomorrow night 12/13, or thursday night 12/14….. while the markets are closed….. as a result, no one will get out of their long positions……….
there seems to be NO respect that these are the most DANGEROUS markets in all of history.
Yep! Yep! Yep! Everyone is convinced that they will have all the time in the world to make the flight to safety. Sez who?
I have long had the opinion that we will see the carnage begin in futures.
Of course after we saw the might of the central banks on election night last November….Eeehh! What’s a little old thousand DJI points down? No worries mon! They’ve got our backs. I have no doubt that perhaps even TWO thousand points down are not going to ruffle too many feathers. Buy that you-know-what- dip dudes! We’ve been doing it for years! Anybody noticing those monster candles in futures on the 30 and 15 minute chart? Although they all closed green, it sure is looking to be like somebody’s a’ sneaking out the back door…. 🙂
verne,
an event – with a global impact – will dry up the liquidity, and all the Central Banks collectively will be helpless………… you heard it here FIRST people’s……………….. either the overnight session of 12/13 or 12/14 is timed to “see” such an event……………………………………….
equity markets will plunge – and/or regulators will have the markets closed……….. CB’s will be rendered impotent………
peter,
is this what you are seeing? https://invst.ly/62jm9
Going with Peter’s preferred count I would say we have an ED in process. It could be the slowing momentum of the third wave is a function of market exhaustion. I am also wondering about the fact that the third wave is longer than wave one so the diagonal is not contracting but I don’t think that invalidates it. If correct we have one more down and a fifth wave throw over to end the final wave up.
I did a bit of checking and as long as the POINT distance contracts to ensure trend line convergence going from one to three, a long three is O.K. 🙂
I would still prefer a third wave where your 1 of the c wave is, and a second wave where you have a b wave. This seems to me the best fit. Wave four today, assuming three is done, has to end above wave two to maintain diagonal’s upward slope, then of course the final zig zag up for wave five, hopefully breaching the 1,3 top trend line. If price goes below the wave 2 low, I am stumped for now…
verne,
for you – an early stocking stuffer…..
https://invst.ly/62sr1
Lol! I had the exact opposite reaction from Peter because of the momentum difference for 3 and 5. Shows how much I know…. 🙂
verne,
i thought as you thought…………..for the same reasons!!!!!! :-]]
Consider the possibility that tax reform fails .
We are now entering the next time frame of Dec 13-14 th .
This is not just the end point of the Venus bull cycle nor just
The beginning point of the Venus bear cycle .
It is also the 10 day lag from the start of mercury retrograde .
Mercury went retro Dec 3 and add 10 days you get Dec 13 th
Mercury retro Dec 3 to 23 rd ( the solstice being Dec 22 ? )
Yet mercury retro Dec 3 to Dec 23 plus 10 days
We get Dec 13 Jan 2 .
The door is now open for a decline .
The next door following is Jan 15-18 th into April 4 2018.
Time to get my feet wet 🙂
Look back the past few years .
Mercury retro start date plus 10 is typically a low but not always the case .
Look at around 2003 to 2006 ( I don’t recall all of them )
The 10 lags would put in tops and produce what I called back then
A mini crash .
The door is opening that’s all I’m saying and they are now stacked up into April 4 2018
With more to follow .
As my dad used to say when I was a kid .
Be careful what you wish for, it may just come true .
A tax bill by Monday ??? Not so sure that’s a good bet .
All for now
Joe
Thanks for your post Joe, appreciate you sharing your esoteric knowledge. Astros can be overwhelming at times due to the many components involved.
All I can say at this point is that we have to trade what we see. Progstication of all kinds have by and large been entirely unequal to the task of correctly and consistently predicting what the market will do ahead of time. I think the futures market is as good a thermometer as we will ever get. They are pointing to more sideways or upwards movement at the moment.
I still do greatly appreciate the efforts of those posters trying to find correlation. I certainly remain open to trying to learn a thing or two if I can.
Sorry, I meant prognostication…
Hi Joe,
Your dates match with the bradley, next turn dates after 13/14 Dec are Dec 18/23 and after that Jan 4.
http://time-price-research-astrofin.blogspot.nl/search/label/Bradley%20Index
Goodluck.
John.
Even if tax reform passes, sentiment is going to change. From what I understand, corporate reductions don’t kick in until 2019. Don’t you think the market will want to “wait & see” it’s effects?
From astrological standpoint, I have windows from Dec 15 to Jan 8 for a top and stronger alignments in March 2018.
Joe,
Thank you for sharing your insights! I always look forward to your comments!
The melt-up continues apace. No sign of a reversal so we may as well enjoy the ride!
https://invst.ly/62uir
The ED requires all the sub-waves to be zig zags. An expanded flat for a fourth wave invalidates an ED count I think….
It looks like a possible three is extending and I suspect that top trend-line is no longer converging.
verne,
i will have to give you my….. “HUH?!!!?” again.
the 4 on the chart is a FOUR………it is a stand alone wave……then after the four we have the last subwaves of 5……… each of the subwaves of 5 should be zigzags or 3 waves……..and if you go down into each of the subwaves of the triangle – 1 is an ABC, and 2 is an ABC, and 3 is an ABC, and now 4 we have an A and a B……………………… i am unsure why you are conflating the w4 with the subwaves of w5??
https://invst.ly/62vuo
verne,
my apologies…… you were talking about subwave 4 of w5 being a flat…..
i withdraw my …………. “HUH?!!!?”………
here verne,
problem solved – a zigzag……….. :-))
https://invst.ly/62w8g
🙂
All we need to keep the diagonal alive is for price to stay above wave two on tomorrow’s decline for a possible wave for. The wave structure should also be another three. A wave five throw-over of the upper boundary would be perfect. There should be no mistaking what we are dealing with when and if that happens.
VIX made a nice sprint above short term resistance at 10.00 right at the close.
Opened a short scalp via DIA 246 strike puts for a quick move down tomorrow.
We’re not done yet it would seem….
I read an interesting comment from an analysis today about fifth wave truncations being the result of a lot of traders watching a particular pattern and jumping with both feet…interesting….
Yea, I shorted the DOW in my Forex account when the market makers displayed their humor again with a 24,666 high.
Obvious but, 2+4 =6 so 6666, then they added their 2 cents.
Peter, Not 1 Forex forecaster had the dollar going down. All of them were calling for USD/JPY to head back up and extremely Bullish on the pair.
Glad I stuck with my short.. Thank you ?
….and great call on AUDUSD as well Peter. Hard to stay long when US Fed were primed to increase rates. AUDUSD still up, and a win for Elliot Wave!
Hope the forecast continues to hit targets, cheers.
Tks, and me too on the forecast. It’s getting a little tough to call as we toy with the top …
Formerly useful market metrics are now inconsistent at best, and completely useless in some cases. The market has moved higher on declining volume for years. I am now concerned about OBV which has been working fairly well. We have had four recent bearish signals and yet we just keep heading up. Another broken metric?
You are most welcome. Glad it worked out for you. It’s taken a while for it to “get in gear,” as you know …
Yes – I was contemplating getting a real job for a few days.. haha!
I know my sizing is too large at times and it is something I have to work on, but the start to this last run in USD/JPY was def a 3 and we all know that has to zero out at the bear minimum. The first part of this wave should be a monster if we are targeting that 61.8 area. Once we take out the bottom of this last 3 wave move I am looking forward to getting back on board.
I would implore anyone that wants to sharpen their Elliott Wave skills to take at least the 3 month membership. Seeing all the different currency pairs and the wave structures and hearing you explain why this has to do that on a nightly bases gives one a upper hand when trading. Elliott Wave applies to all stock and indices and can be applied to any candlestick chart.
If someone ask what you want for Christmas – Tell them a membership to Peter’s “Traders Gold”:)
This market may very well go higher than most of us expect. It will probably top when Gold makes a bottom and I think Gold is now in a counter trend bounce just ahead of a big third wave down. If that is so we could still see quite a manic move up to end this remarkable 10 year odyssey. The remainder of this week should be quite revealing. The final top, however distant, will be well worth the wait….
I have contemplated the same thing. Currencies have a ways to go. The final move down in DXY just started, so agreed on Gold. Either everything happens so fast and they spike to where they need to go on or before Jan 8, or I think we are waiting until March. I would not be surprised to see it top close to the very same date it bottomed in 2009. The astrological alignments are there…
Good point Mike, maybe Dow at 26,666 in March 2018?
Often view 25th August 1987 when the Dow topped at 2736. The ‘astros’ that day were aligned and turned the market down towards the Oct crash. Sun,Moon,Mercury,Venus & Mars all conjunct together around 150 degrees Virgo. Neptune and Jupiter each positioned 120 degrees away (trine) from this 5-way conjunction. Nice set up… certainly more to this than meets the eye!
Now I’m getting confused as to where & when I posted my astrological analysis, if I’m repeating please forgive me:
In December we have the obvious — Saturn transit into Capricorn within 2 days of a Solstice. The 9/5/1929 top arrived with Saturn .5° into Capricorn. That falls on January 8 2018.
In March, we have an alignment which fires off the inner pentagram of the two wheels. In March 2009, the outer pentagram was fired with Mars conjunct Jupiter at 307° and Saturn at 168° Those are close to the two harmonic points, 311 & 168 on the outside. On March 3 2018, we have Mars conjunct Jupiter at 223° (not at a harmonic point though) with Saturn at 272. Saturn will be close to a point, but you need at least two to fire it off, so enter in the North Node of the Moon, which will be at 134°.
However, I like 2 weeks out in March better, when it hits 21° Scorpio. That’s a known point to cause a trend reversal. Give or take 3° for the start, and you still have the Mars/Jupiter conjunction within a few degrees, as well as the North Node and Saturn moving closer to the sensitive points on the inner pentagram.
Let’s also not forget Neptune at 343° and a third sensitive point at 347. As Neptune & Saturn move closer to a 72° alignment, that can fire the whole thing off.
Right now: 73.46
Jan 8 2018: 72.88
I’d like to see this damn thing fall apart by Jan 8, but if it doesn’t I know what to look for next. The other possibility is we do drop, recover either 62% or do a double top, then drop again in March.
The Neptune / Saturn geocentric alignment right now is 72.44 right now and is 72.14 tomorrow. Maybe we get geocentric firing first, then a retrace, and another drop for the heliocentric alignments.
Thanks for that info Mike. I typically use Geocentric measures but note Gann used both Geocentric and Heliocentric in his Astro measures.
Like ‘horses for courses’ there seems to be favorable planetary positions for each index / country.
I find timing much more difficult than price.
Has anyone ever looked into Gann’s Circle of Eight ‘CoE’ analysis ?
12th January 2018… peak hour traffic in the sky…
7 Conjunctions;
Sun Venus
Sun Pluto
Venus Pluto
Moon Mars
Moon Jupiter
Mars Jupiter
Saturn Mercury
plus Uranus squared the Sun Venus Pluto conjunction
plus Mean Node squared the Moon Mars Jupiter conjunction
Need some Mars in Scorpio action like Oct 2008, Aug 2014 and Jan/Feb 2016….
Interesting. The last Hindenburg Omen window extends through March. If this market continues higher till then bearish traders will as a species become virtually extinct!
Futures pointing to another uneventful session. The strategem now appears to be simply pour liquidity into the cash session with no need to ramp futures as selling pressure is virtually non-existent. The calm before the storm continues…long Gold and volatility.
Weird. I have no idea what ES is up to but it does not look like a zig zag fourth.
It looks like yet another triangle of some sort underway. Crazy market!
Tim Knight made an interesting comment about why the banksters were so hell-bent on keeping this third bubble inflated. He stated that they know that when this one pops, that’s all she wrote!
They are going aii in! Expect it!
DJI really starting to look like a barrier triangle…
I am not really following SPX right now because I am trading currencies but looks like the triangle just broke to the downside.. Selling pressure should pick up by lunch time I would think.
Whew! Looks like trendline held, at least in DJI. This is one insane market people!
Not sure if you were looking at SPX or ES but once it broke it kept going as I expected.. I don’t follow Dow at all :/
Oh luuuuuu-riiiiiiii….wazzat? A FAILED FIFTH??!!! 🙂
Now I am really bewildered…that sideways move was entered in uptrend so the break should be upwards….what the…!!!! 🙂
False break below trendline in ES…now back above….long lower wick….
DOW has broken 1hr trendline, went back to retest, coming down (hopefully).
It is certainly trying…they keep stepping in to arrest the decline. It is nuts!!!
DJI support shelf breached with apparent back-test…time to decide…up or down???
I took some off and have my stop at even. It can do what it wants, but I’d obviously prefer down. Not messing with options until we get a clear move down with a 62% retrace, except for FAZ — bought leaps on those last week & they’re still holding up.
Not sure what degree the current batch of triangles should be designated. I am quite confident the break will be to the upside….of course, we could see another departure from the norm after such a confident pronouncement… Mr Market tends to do that… 🙂
If we had a complex wave for C of the triangle, we are now completing E and should get a thrust upwards just ahead…
Figures!!!! 🙂 🙂 🙂
A little reverse psychology on Mr. Market…he! he!
SPX outside key reversal yesterday would be confirmed with a red candle today…
Quite a novel challenge for the erstwhile banksters. I have NEVER seen them forced to defend an assault on two fronts…kinda funny! 🙂
Futures AND cash, that is….
What about bonds? They were busy this morning over there.
Maybe they had to get short first. Let’s see what happens tomorrow.
Three white soldiers in VIX…
verne!!!!
did you………..”MISS”………me? ………i was M.I.A…………..
https://invst.ly/63bzc
Can’t you tell??!! 😀
Very interesting situation. I previously mentioned it would be spectacular to see VIX chase a fifth wave higher. If your wave count is correct, the Three White Soldiers in VIX is suggesting we may see just that eventuality unfold…..
..hmmm…vix chase w5 up……………are you saying vix green and spx green??
Colors coding is soooooooooo…..”ending diagonal”……………… [ahem….peter….colors]
https://invst.ly/63ccl
Yep!
we are at DEFCON “flashing red”!!!!
https://invst.ly/63cj9
oooooooo …. cool … EDs do not include wave the larger wave 4 and we probably have another leg up and down in the ED wave 4.
sorry boss….here i cleaned it up….
that “a” wave of the ED w4 consists of a subwave “a”/ “b”/ “c” ——so this “might” be it for the w4…https://invst.ly/63clu
could it be that tomorrow’s OPEX is finally a “bloody” one?? ……………….”hamburgers” anyone?? ….[cough]…………..dead bull…….”hamburgers”………………. [sigh]…………………..
Ahem…! Er…Could you possibly make mine filet mignon…..and…er….RARE??!! Merci! 🙂
verne,
this bull be OLD!!!……..real OLD!!!…… trust me, i had the whole thing “hamburger”d……………………… its better this way!!!
there is a “remote” possibility that the market “plunges” overnight…….BE WARNED!!!!!!
In which case I would like mine nicely “charred”…thank you! 🙂
So far as overnight action, I am actually expecting the current red numbers to be magically replaced by a sea of green prior to the open to herd all the giddy bulls once more time into the you-know-where…think “Stock-yard” 🙂
Verne, nah… Think optimistically and like a market maker. How can you screw the most amount of people more than once with SPX 15 points away from a measured top?
Simple, take it down to 2512, just a hair above the point of no return, then run it all the way back up.
Bloody Friday, then Santa shows up.
Yea, I know, Elliot Wave doesn’t support this scenario, but the market makers know EW & every other TA tool, so somehow, after the fact, we will figure out what crazy unknown rule it went by.
No, you need a b and c wave down in SPX (easiest to see than ES). Ending diagonals are usually much wider than what you’re showing.
Yep. I thought it looked a bit narrow; not too much room for five to run. Would also fit prrfectly with VIX spike next day or two after TWS candle pattern.
This move down clearly corrective. When this beast really turns there will be no bankster B.S. in the form arrested impulses. Looks like once more into the breach dear friends…but I think we’re getting close. See ya! 🙂
If our congress wanted to raise taxes I’m sure they would
All vote yes but a tax cut ? Naw
OK Let’s have some cycle and technical fun!! First, I should say that orthodox technical analysis would strongly suggest there will not be a FINAL high until we see divergences between the indexes and the daily a-d line and there is no such divergence here. The only time I can find where there was no such final divergence was December 1968 at the end of a great speculative binge. The top mutual fund that year, the Neuwirth Fund was up over 300% for the year going into early December. On December 13 (!!!!!) 1968, the Value Line Composite Geometric Index reached a top which began a devastating bear market. The decline ended just over 6 years later after that index, a good measure of the performance of the average share of stock, had declined 75.1%. So, yes, a top here would be unorthodox technically without a-d divergence, but not unprecedented. Now watch this: Draw a tops line from the 2-18-11 high in the S&P cash through the high on 12-29-14. It’s a slightly steeper slope than a line that would begin at the April 2010 high but completely acceptable technically. There are no highs above that line between the 2 anchors of 2-18-11 and 12-29-14. On 12-4-17 the line was at 2664.50, the high that day at 2665.19. Yesterday, the line was at 2670.00 with a cash high of 2671.88. Now let’s turn to past market and cycle master George Lindsay. He loved L-L-H or B-B-T (bottom to bottom to top) for cycle counts. Arguably the 2 most important bottoms of the past 2+ years were 9-29-15 and 11-4-16. I use 65 min charts rather than exact hourly because they fit evenly with exactly 6 bars (390 minutes) in the market day. The 9-29-15 low occurred in the last bar of the day. The 11-4-16 low occurred in the first bar of the day. There were 1666 hourly (65 min) bars between them. Use Lindsay B-B-T count to move forward 1666 bars from the 11-4-16 low and it takes you to the bar ending at 10:50 PT yesterday, 12-13-17. The all-time high so far occurred one bar earlier at the same time as the trendline from 2-18-11 through 12-29-14 was being hit. Important top?? There are lots of arguments against it, but I have seen some very important tops occur while some Elliott buddies were waiting for one more 4-5. Don’t get me wrong. I love Elliott analysis, but don’t tell me it’s a science. It’s more an art than a science as is all market analysis. Good luck all. The way this market has been going, this whole analysis could blow up as early as tomorrow…:)
Peter G,
Joe is on a similar path. He identified this December 13-14th as a potential Top back in July-August time period. At least to me…both of you are on to something. Maybe something historic.
I will pop some popcorn and sit back and watch. Thank you for your insight!
You’ll have to give me a really good example of where you find “art” in EW analysis. I find none. It’s gruelling work and it’s much more a science than art. Again, I can find no art in it at all. It’s mostly math and pattern recognition. How many hours a day do you spend at it to make that statement?
Peter, I greatly respect your work. It is my contention that if EW analysis was more a science than an art, there would be far more agreement between Elliotticians. Prechter has been a close friend for over 30 years. He is a brilliant man. You perhaps feel he has tainted EW analysis over the past decade or more because of his heavily bearish leanings, but he did almost single-handedly popularize EW analysis and has made several brilliant calls in his career. He literally wrote the book and if I had to guess I would say you came to Elliott through Prechter. Virtually all current EWavers did. There is subjectivity in all market analysis. Wherever there is subjectivity, there is art in its application. That is not meant to be pejorative. As to hours spent at EW analysis, very few. As to hours spent on market analysis, I would not be exaggerating if I said perhaps an average of 10-12 hours/day for the past 45+ years. It is my lifeblood. I apologize if I offended you and we simply have to agree to disagree on EW characterization. My specialty has always been cycles. Let me try this out on you. With both cycles and EW analysis, describing what has already occurred prior to today in a chart could well be more a science than an art. But for me, predicting what is to occur next in a chart will always be more an art than a science regardless of your discipline of analysis. Keep up the great and hard work. It is much appreciated!
Peter,
I know you were not criticizing my work; that wasn’t an issue. I’ll respond to your comments today, but I want to address them in a way that I can post somewhere, if you don’t mind, as I continually go over the same material in my responses to similar comments.
Plus … I had a 20 hour day yesterday, and at my age, it’s a little slower coming back this morning.
🙂
In the process of developing a more in-depth review of the errors and omissions in the Frost/Prechter book, The Elliott Wave Principle, I’ve decided to develop it as a separate document and answer your recent comment directly.
You’re right in that I came to Elliott Wave Theory through Robert Prechter and his EWI site. After over a year as a subscriber, I became so disgusted with the incompetence of his analysts, that I determined to take a few years, devote myself to the market and the EW principle, with a goal of eventually excelling in its use. I discovered so much more in the process than has been written by either Prechter or Elliott (and several errors in the original publications).
As a result, I’m convinced that the movement of the market should be considered a science. The reason the Elliotticians waver in their analysis is because of the errors in the Elliott Wave Principle, most of them due to the additions, or changes to Elliott’s original work, done without proper research.
Here are a few examples.
1. Truncations. Nobody has ever seen one. The example charts in the book on this subject are invalid because they’re both waves within an impulsive pattern that continued up after the supposed truncations occurred. One of the examples cited is a three-wave, second wave of a sequence.
Bob Prechter, in his writings, has expressed a desire that EW Theory be classified as a science. However, his adoption of this truncation “anomaly” certainly doesn’t support this want. You can’t have a valid scientific theory that fails periodically. After going back a hundred years in the DOW, I can’t find a single occurrence of a truncation either at market highs or lows.
2. Leading diagonals. Nobody’s ever seen one. There has not been a valid chart presented to support this pattern. It was a Prechter addition to Elliott’s work.
3. Second waves in an impulsive pattern must retrace 62%, based upon my experience. I’ve cited this several times over the past two years in my work and it has yet to fail. This fact is often the difference in whether analysts are correct in their calls, imho. In Prechter’s book, the requirement is that they only have to retrace 38%, which has caused analysts to be wrong over and over again.
4. The role of fibonacci ratios in both corrective and impulsive markets is woefully incomplete in the book and, in my work, has time and again proven the most important factor in determining both wave end-targets and whether a structure is corrective, or not.
5. First waves of an impulsive pattern have a different structure than all other impulsive waves. This fact simply isn’t addressed in the book.
6. The difference between a corrective five wave pattern and an impulsive five wave pattern has not been addressed at all in the book. This perhaps the most important distinction in determining corrective vs. impulsive wave structures.
There are more, but they start to become more technical.
So, if your tools are blunt, you’re going to do a less than adequate job as an analyst, through no fault of your own (other than laziness, I suppose).
I find your comment, “He [Prechter] literally wrote the book … “ odd. Elliott wrote the original book (and many articles). Prechter and Frost wrote another book, based upon his work. There are others out there.
Here’s another one: “Wherever there is subjectivity, there is art in its application.” I suppose this is where I most vehemently disagree, as it relates to the Elliott Wave Principle. That’s an attitude that suggests a minimal understanding of the process.
Prechter himself spent a few pages on this very topic:
“Despite the fact that many analysts do not treat it as such, the Wave Principle is by all means an objective study, or as Collins* put it, ‘a disciplined form of technical analysis.’” — page 94
• Charles Collins wrote the foreword to the Elliott Wave Principle.
As a result, I don’t generally look at anybody else’s work. I do not let news or events play any part in my analysis. My job is to remain completely objective in my analysis. I only look at indicators after I have done my initial analysis to see if they support (or not) my prognosis.
Finally, your comment that “[Bob] has made several brilliant calls in his career. I had a good chuckle. This is not meant in any way to be critical of the work Bob has done in that regard, but here’s my point through an analogy.
We have a traffic system that requires motorists to stop at a red light. If you know the rules, it’s not particularly “brilliant” when you stop at that light. However, if you came from the backwoods and have never seen a traffic light, it would be really brilliant if you stopped when you saw your first light turn red.
Based on that standard, I make several brilliant calls each and every day. However, as I often say, “I’m simply an Elliott Wave-following moron.
Bob knew the rules when he made those calls. Any good Elliott wave practitioner can do the same.
It’s Ralph Elliott who was the brilliant one in discovering the science.
Where I find Bob Prechter’s brilliance is in his Socionomics work. This to me is his crowning achievement and something I would also like to see classified as a science sometime in the future.
So, as an EW analyst, are you an “artist?” Perhaps, because you’re given a set of tools that are roughly hewn and have to use them to bring clarity to a market that moves in a predictable manner, churning out the same patterns over and over again, with Fibonacci relationships to each other most often provide multiple target options.
I suppose the real art is weeding out those options through experience. So, there is art in analysis, but I believe how the market moves to be a science that was uncovered by Ralph Elliott, with rules and guidelines that were refined, clarified, and communicated by Prechter and Frost.
I’m putting together a stand-alone page that goes over some of this same material in a little more depth, but without my personal story and experience with EWI. However, it’s not likely to appeal to the novice.
peter g.
“orthodox” technical analysis NEVER had the “franchised” central banks rigging and QE/NIRP/ZIRP manipulating EVERY “so called market” in the developed world………
a failure to account for this level of “rigging” – is just a failure……………….. its time to bring out the “UNORTHODOX” technical analysis as we live in unorthodox times…..
the times of the “money standard” shift………
……………… BE WARNED! :-))
Thanks Peter G. Very interesting!
I have to say I am quite surprised that you would not include the Feb 11 2016 low of 1810.11 in citing important lows the last two years. In my opinion none is more significant. In fact it was the price action off that low that prompted Prechter to send out a special interim report rescinding his prior call of a possible crash under way and correctly (at least in my view) identifying the decline as only a high degree fourth wave. I was still a subscriber to EWI at the time and consider it one of his better calls in many years.
Speaking of market observation, we saw something unprecedented in the market yesterday. I have frequently mentioned the freakish situation with regard to the short vol trade and what could only be described as complete insanity on the part of those who will have to eventually unwind it. The Three White Soldiers pattern in VIX is one I have NEVER seen previously….EVER! If any one can go back and find one the actually meets the precise definition please let me know.
The pattern came yesterday in the face of relentless attempts to smash VIX back below 10.00, as VIX moved up strongly into the close to confirm the pattern. The shorting of vol futures continued unabated with SVXY and UVXY posting new all time highs and lows respectively. Strong, confident hands are accumulating long short term volatility positions.
As I expected, futures are now in the green and we will probably get a b wave up of four during the cash session, with a c down to follow. In this case then of course we have one final zig zag up. If we were already in a fifth up with a possible throw-over on deck I would have expected to see higher futures prices.
Having said all that, your comment about the absence daily A/D line and price divergence notwithstanding, there are plenty of bearish signals everywhere, as well as other kinds of divergences, including momentum, volatility, and on balance volume. We had bearish engulfing candles yesterday, in addition to the highly unusual TWS VIX pattern. The market is the most overbought it has ever been in its entire history. I remain absolutely stunned at the level of complacency. I am long volatility….
Not a dedicated candle guy, Verne, but a quick glance of VIX candles over the past 10-15 years seemed to show “Three White Soldiers” on 3-10-04 and 5-19-06. I think they qualify but tell me if I’m wrong. Your observation is correct, however, that they appear exceedingly rare…
Wow! Right indeed Peter G! Thanks! 🙂
Peter G a quick query if I may. Prechter in a recent interview with Avi Gilburt said he no longer used cycles in his analysis as he had found them inconsistent at best and unreliable at worst. I wonder since you are friends if he gave you any more insight into his disenchantment. He definitely use to make extensive use of them in the past in his “Theorist” and frankly some of those charts were quite lovely, if not usefully predictive!
😉
Bob told me the same thing a couple of years ago, but at that time, I was exec. director at the Foundation for the Study of Cycles and I wasn’t sure if he did that “for effect” or not … lol. Nice to know that wasn’t the case.
More specifically, he found a period in the 70s and 80s where they simply didn’t seem to be working. At one time, he was much more closely associated with the Foundation, so I know he had much more faith in them before that.
He has expressed his disenchantment with cycles and although he did not say so directly, I assume it’s because some that he believed reliable failed to lead to the expected resolution. The fact that he continues to do “time analysis,” whether Fibo or straight cycles implies that his faith in them is not completely gone…
Peter,
EW time analysis is not related to cycles. These are fibonacci wave relationships (to previous waves). One of the rules of cycles is that they must exhibit periodicity, which ES time analysis does not, since the “gaps” are different fibonacci numbers (eg – 3, 5, 8, 113, 21, 34, 55, etc.) I suppose they’re distantly related, since their based upon the golden mean, but that’s the only connection I can find.
I don’t think I said it was, Peter. I think I distinguished between cycles and Fibo time analysis, and in fact, did not even mention EW analysis…
Thanks Peter G. Very interesting!
I grew up in Seattle yet I’ve learned not to bet on the Seahawks
Because they tend to disappoint more often then not .
If people are not careful they risk getting herpes which is just
Disappointment that just keeps coming back .
And then there is the republicans , they just never seem to
Get it together .
I think the republicans have more similarities to
The herpes virus than the Seahawks .
It is coincidental that my dates very closely match
The Bradley model and I’d rather not see that but
So far I have to stick with a down cycle has begun
And has further to go. I’m staying short into Jan 2
And will then ‘re short Jan 15-18 th expecting an even
Stronger decline to follow then the down trend we are
Presently in.
Obviously you never know for sure when you attempt to
Pick a top . Yet this present cycle using just mercury retro is
Down into Jan 2 , mars Uranus is down into Dec 25 then
Up into Jan 2 so things can get a bit mixed when mercury goes
Direct on Dec 23. That said though the mini crash cycle with mercury
Retro runs into Jan 2. As I’ve said prior the market can whip
All over the next few weeks yet my bios is downward .
( right or wrong )
Staying short .
Peter g
You make some very valid points and as a fan of George Lindsay myself I think you are into something .
On another note , Peter g . We don’t always agree with our views of Steve puetz yet since you have studied his work
I will note something for you to double check .
Where does the market stand 20-25 trading days before a solar eclipse ? This is roughly 1 month to the day prior
To a solar eclipse and then look out to the 6 days before to 3 days after the full moon 6 weeks after the solar eclipse .
We may not agree yet it’s worth checking out .
Jan 15-18 th 2018 is going to matter ( nothing related to Bradley model )
Like I have said these crash cycles are indeed stacking up and I have not seen this many series of them
All either blending together or running one after .
This can get very ugly .
Joe
In my humble opinion my good friend, not only “CAN” it get very ugly, as sure as there is a YIN for every YANG, IT WILL!!! 🙂
……people’s………………
art and science are EXACTLY the same thing…………….. “think sacred geometry without the white research lab coat”………………
now more importantly……… MY LONG TERM CHARTS!! JOE IS “BANG ON”….
……….now if you “recall”…………in the last episode of “MY LONG TERM CHARTS”….. verne was threatening to burn down the house for the “insurance” money…..he had doused the entire structure in kerosene and vodka, and had LIT the match……
now, the scene ends with – ME – screaming at verne “NOT TO DROP THE MATCH”…. why?………because in the house were all my …….[cough]……..we all MY LONG TERM CHARTS!!!!
so remember i contended that i thought that we have been “topping” in an expanding type structure since 1987!!! and i produced this monthly chart of the $INDU [non log] https://invst.ly/63icc…………. and i said that the dow will run to a point almost touching the upper long term trend line…………….
…………………………..CARPE DIEM………………….. https://invst.ly/63ih9 [hard to get entire chart on one snapshot]
joe/peter/verne/jody/everybody …………….. you are all correct. This goose is cooked – officially!
[verne you can toss the match on the house now…..we have to officially “COOK” the goose]……………..
“Crispy Duck”….coming right up…! 🙂
verne,
i realize that “you” and “the boss” are ………..can i say it………….OBSESSED….with fat, obese looking ending diagonals…..ahhh excuse me – “fuller figure” – ending diagonals……..
but allow me to “virtue” signal how ……..accepting………..i am……. i have a ‘skinny’ ending diagonal………. live with it……………and of course……..BE WARNED!!!!
https://invst.ly/63kmq
Ahem…! You actually meant- BE VERNED!…did you not? 🙂
…… alas…..verne…………………….. “BE VERNED”!!!??? is sooooooo …..ahhh……..well its so Henry the VIII’th – meets the 1980’s shoulder pads
remember those verne………….. 1980’s shoulder pads!!!! hmmmm…..
more importantly……i am counting a “different” count for the spx versus the ES…. it is a straight w5 count in the spx……….no ending diagonal….see look below……….so whatever you do…..DO NOT LET the boss see that chart!! guard it with your LIFE!!
https://invst.ly/63l31
Luri I said it once and I will say it again buddy. If that happens I will eat my hat!
Do you really think that central banks would not step in if a decline of that magnitude took place?
Whilst I agree that the decline should be faster I just cant see how that size decline can take place buddy.
Love the chart though it made my day…. the decline line you drew actually looks like a period separator I had to look twice!
oh MSS……where do i begin…………..
here is where the “pavement” meets the road………………. or something like that……. you see only the “equity” world………………… and what of it??? …..well, i am charting a “simultaneous” bursting of bubbles – the debt market alongside the equity market – both feeding upon each other…….. at which point, the “money standard shift” comes into play……………………… there will be no saving equities……………….. [for a time]…………………….so that line i drew on the long term $INDU…… “study it” closely…………….i am expecting it to be a single month bar…………….uh huh……you heard correctly………………..and lets see….hmmm..oh yes!
……………………… BE WARNED!!!??? :-))
Er…I think that particular aphorism involves the words “ROAD”, and “RUBBER”… 🙂
Luri thanks for the prompt reply
One month ……..Oh good Lord forget eating my hat I will probably pass out with pure shock.
Lets see like verne said this is the true test of theory or law if it happens it will be written in “law” for sure my good man!
It seems to me that we have a perfect scenario for putting to the test in real time, the question of whether “market manipulation” is real or imagined. One way postulates move from “thory” to “law” is to demonstrate predictive value.
Considering the number of bearish signs on the charts yestetday, this ramp in futures is laughable, and exactly what one would expect in a “manipulated” market. If so, all that green is nothing but smoke and mirrors, manipulation, if you will, to distract traders from those bearish portents. We will see! 🙂
its OPEX, so the manipulation is magnified…..
It is monstrous, it is malicious, it is misguided, it is…..maddening!!!!
Did I mention….MYOPIC??!!
I am trying a little short right here at SPX 2664:)
https://invst.ly/63mgh
https://invst.ly/63mn8
yep yep!
Just doubled down my short on Spx ?
jody…no worries….you will be able to get out “even” or a small gain….
see below…
https://invst.ly/63nrp
Luri,
I am diversified Short SPX and Short USD/JPY 😀 lolol
grrrr….
if the market stops at the upper trendline……then we must adjust the count as follows…….https://invst.ly/63nkl
Call it plummer! Starting to see cracks! lol
Uh Huh….shooting stars at resistance everywhere…! 🙂
A likely top would be Monday if this is the last wave of the Ending Diagonal, just some patience to get through.
thanks ted……
monday or tues as we now have to do 4 and 5……today being opex might see a pinned market in the afternoon……https://invst.ly/63nv6
Fadda, is Bedda! 😀
,,,,,you have been eating tablespoons of raw “sugar” again…………verrrne…..!!?
Trying hard to substitute HONEY…!
Now ain’t that sweet? 🙂
huh…..we are overthrowing………..hmmmm….
https://invst.ly/63p0r
Remember EDs are very particular animals. They don’t dally when they’re done…!
We should know shortly if you are indeed correct… 🙂
This website is for educational purposes relating to Elliott Wave, natural cycles, and the Quantum Revolution (Great Awakening). I welcome questions or comments about any of these subjects. Due to a heavy schedule, I may not have the time to answer questions that relate to my area of expertise.
I reserve the right to remove any comment that is deemed negative, is unhelpful, or off-topic. Such comments may be removed.
Want to comment? You need to be logged in to comment. You can register here.