
The Dip — A Game-Changer for Me
“What really sets superstars apart from everyone else is the ability to escape dead ends quickly while staying focused and motivated when it really counts.” — Seth Godin
“Winners quit fast, quit often, and quit without guilt—until they commit to beating the right Dip for the right reasons. In fact, winners seek out the Dip. They realize that the bigger the barrier, the bigger the reward for getting past it. If you can become number one in your niche, you’ll get more than your fair share of profits, glory, and long-term security.”
I read this little book when I was learning the Elliott Wave Principle, which took me years to master, because of the errors and omissions in the book, and the seeming inability of the folks at Elliott Wave International to analyze waves properly (argh!). It was a frustrating time.
There were many times where I wanted to just give up. That’s “the Dip.” It’s the point in any major undertaking (usually three quarters of the way there) where psychologically, you hit a low point and are on the verge of quitting altogether.
Many never make it to their goal; it separates the “stars” from the also-rans. As they say, we don’t remember who came in second.
The “superstars,” the experts we look up to in life, got there because they powered through that “dip” in motivation and made it to the end, undergoing many frustrating challenges along the way.
We’ve had nine months in the US indices of a slowly rising B wave, but it is indeed almost over. Just a little more patience will pay off in a big way.
It’s been a frustrating wait because the rally in ES has been one that has almost died several times, but suddenly comes back to life every time. Frustrating!
But the Elliott Wave Principle, either through counting waves, or through fibonacci measurements, always alerts as to when the turn will come. Time, as I’ve said many times before, is not something EW does well. So … we wait. The signals for the coming turn are clear; however, the shorter-term wave structure in the US indices is not as clear as I’d like it to be.
In any case, other asset classes are also signalling a turn is imminent. This is going to be a major turn of just about everything. It will be worth the wait.
In terms of my work learning Elliott Wave, I found that I had to try to disprove it in order to prove it in every instance. It took me several years to go through the process, figuring out when I was wrong, why I was wrong. That process led to additional rules I discovered and guidelines in the book that I ultimately figured out were dead wrong. For example, truncations. I have not been able to find one in back-testing through a hundred years of the DOW data.
I lost a fair amount of money along the way, but I was determined to either prove it worked, or find a flaw that would cause me to abandon it. I was determined to master this particular niche. I’m still working towards that end. I say that because, with the market, there’s always some nuance or subtle pattern that you end up refining in some way. But the work I did has paid off.
I have not been able to find an example of how Elliott Wave fails to adhere to the set of rules that I’ve adapted from the Elliott Wave Principle book. Most analysts aren’t willing to put in this kind of work. I am, thanks to Seth Godin and The Dip.
______________________________
Update on NDX
NDX really didn’t advance this week; it still looks like we may have an ending diagonal in the works to finish off the 3rd wave. The measured target for the third wave to the upside is 7900, but I’m unsure if we’ll actually make it that high.
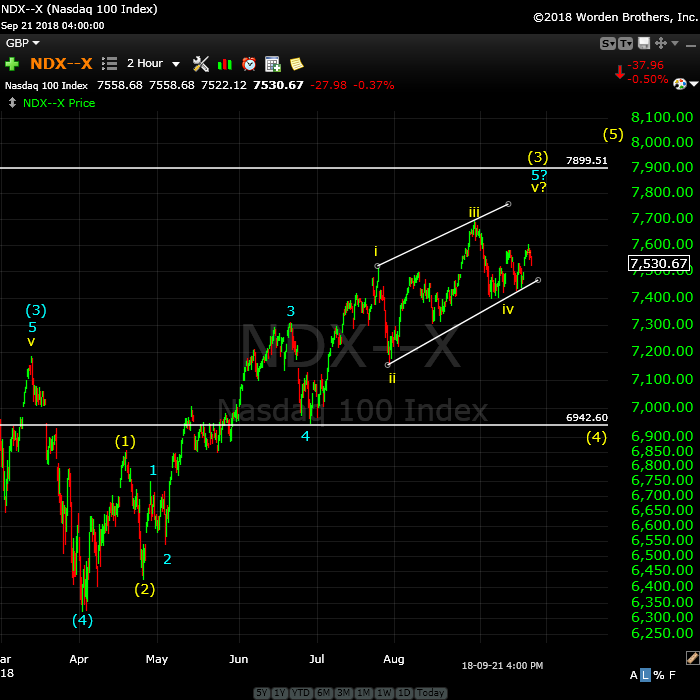
Above is the two hour chart of NDX (Nasdaq 100).
There at least a couple of ways to label this final set of waves up to the top of wave 3. With the sideways movement this past week, and the fact that NDX (and NQ) did not break below the lower trendline, leads me to label this pattern as an ending diagonal. If so, expect a final rally up to the upper trendline. We could get a “throw-over” (a spike above the upper trendline) but it’s not required to end the pattern.
On the other hand, if we break down below the lower trendline, then we’re in the fourth wave down and the third wave would likely be complete (I can also count the wave up as having traced out a full five waves of the third).
Keep in mind that at tops, often the final waves start to compress and often doing trace out their full expected lengths.
The larger fourth wave should come down to the previous fourth wave somewhere around the 6942 area. It cannot drop into the area of wave (1) or it would negate the impulsive wave and possibly lead to an ending diagonal.
The fourth wave down and then a final fifth wave to a new high are the final two waves before the top of the 500 year rally. After the final 5th wave up in NDX is complete, we’ll turn down into the bear market I’ve been talking about here for the past three years!
______________________________
Elliott Wave Basics
There are two types of Elliott wave patterns:
- Motive (or impulsive waves) which are “trend” waves.
- Corrective waves, which are “counter trend” waves.
Motive waves contain five distinct waves that move the market forward in a trend. Counter trend waves are in 3 waves and simply correct the trend.
All these patterns move at what we call multiple degrees of trend (in other words, the market is fractal, meaning there are smaller series of waves that move in the same patterns within the larger patterns). The keys to analyzing Elliott waves is being able to recognize the patterns and the “degree” of trend (or countertrend) that you’re working within.
Impulsive (motive) waves move in very distinct and reliable patterns of five waves. Subwaves of motive waves measure out to specific lengths (fibonacci ratios) very accurately. Motive waves are the easiest waves to trade. You find them in a trending market.
Waves 1, 3, and 5 of a motive wave pattern each contain 5 impulsive subwaves. Waves 2 and 4 are countertrend waves and move in 3 waves.
Countertrend waves move in 3 waves and always retrace to their start eventually. Counrtertrend (corrective waves) are typically in patterns — for example, a triangle, flat, or zigzag. Waves within those patterns can be difficult to predict, but the patterns themselves are very predictable.
Fibonacci ratios run all through the market. They determine the lengths of waves and provide entry and exit points. These measurements are really accurate in trending markets, but more difficult to identify in corrective markets (we’ve been in a corrective market in all the asset classes I cover since 2009).
To use Elliott wave analysis accurately, you must be able to recognize the difference between a trend wave (motive) and a countertrend wave (corrective). There’s very much more to proper Elliott wave analysis, but this gives you the basics.
____________________________
Registration for Commenting
Want to comment? You need to be logged in to comment. You can register here.
If you register, it protects your information. It also allows you to comment without filling in your information each time. Once you’re registered, simply go to the home page and click on the login link top right in order to log yourself in. Usually, you’ll be logged in for several days before needing to be logged in again.
______________________________
Problem receiving blog comment emails? Try whitelisting the address. More info.
______________________________
Couldn’t be happier … KK 2
Couldn’t be happier …The analysis and insight you provide is simply amazing! I’ve been trading the futures and equity markets for well over thirty years and usually average around 5% monthly. Since joining your Traders Gold Service two months ago, that number has better than doubled. I couldn’t be happier.—KK |
The best of them JL 2
The best of them …Last couple of years, I subscribed to several ‘market traders’. You are by far the best of them and the personal contact is awesome. Daily and daily updates are very well written! Besides your expertise in EW, I also like your cycles analysis. Best investment I ever made! —JL |
Get an upper hand … JC 2
Get an upper hand in trading …Seeing all the different currency pairs and the wave structures and hearing you explain why this has to do that on a nightly bases gives one a upper hand when trading. Elliott Wave applies to all stock and indices and can be applied to any candlestick chart. If someone ask what you want for Christmas – Tell them a membership to Peter’s “Traders Gold!”—JC |
the real deal SM 2
The real deal …‘Educational, insightful and thorough market analysis for all levels of traders. It’s Elliott Wave at its best….Peter Temple is the real deal’ —SM |
Have not had a losing week RW 2
Have not had a losing week …I have been with Peter almost a year. The only thing that matters is have I made money with his service. I think I have finally turned the corner using Peter’s EW. I have not had a losing week in the last 5 months. Thanks Peter, for your amazing amount of hard work. —RW |
Rise above the rest … SM 2
Rise above the rest …I have only ever met a few people who, in their chosen fields (astrology, medicine, music, martial arts, technical analysis), rise above all the rest and you are one of them…you have ‘the gift’…and that’s why I’m a Trader’s Gold member. —SM |
A true expert in Elliott Wave FL 2
A true expert in Elliott Wave …You are a true expert in EW analysis. What you provide is not available anywhere and is priceless. Subscription on your services is the best thing I have ever done. Many thanks for your effort to make me a better investor. I now have more trust in my investment decisions. I hope you will continue the excellent work! —FL |
Tops in your field DZ 2
Tops in your field …You are tops in your field. Tried to follow Elliot Wave international for years. They were always behind the market. After discovering you, I perceive that you are an expert in reading the waves, which puts you way ahead of the rest of your peers. And you can read the Waves like you are reading tomorrow’s financial section. I pray you stay healthy. —DZ |
The Market This Week
Here's the latest daily chart of ES (emini futures)
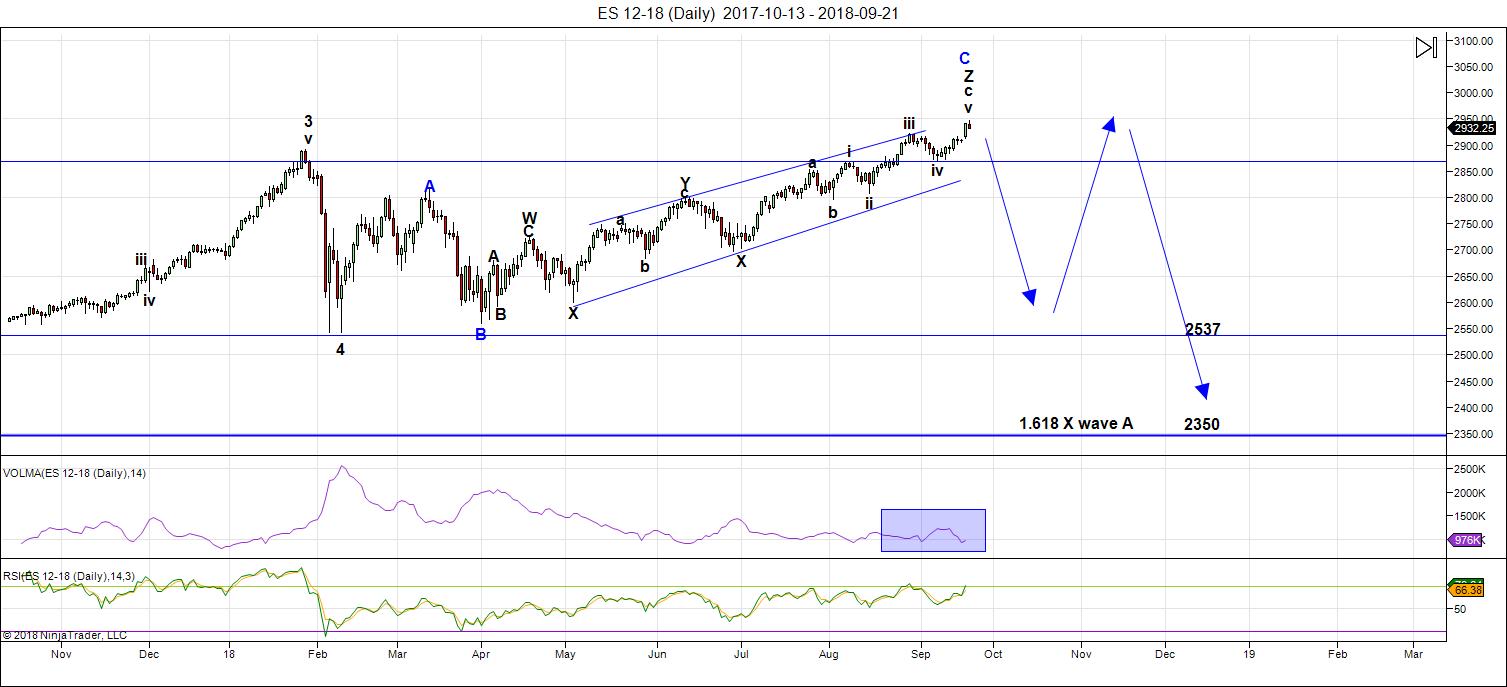
Above is the daily chart of ES (click to enlarge, as with any of my charts).
Even though we're at a new high this weekend, we're still waiting for the fifth of the fifth wave to end. It should end this week; there are signs from all the other asset classes I cover that we're going to have a major turn of just about everything.
The big change this week was the movement of the US dollar, which did not bottom as a wave in three as it threatened to do, but dropped to a new low. That sent SPX higher, in a larger wave than I expected, but still the final wave.
With all the events coming this week (full moon, Fed announcement), I would expect the turn to finally take hold. My money is on the Federal Reserve announcement, which tends to be a magnet and usually results in a turn the following day — the long-awaited C wave.
My preference is for this continuation of fourth wave pattern (down) is that of a expanded flat. However, technically, it could also be a running flat. At the present time, the B wave (that's the ABC wave up from about 2532) is longer than the A wave (marked as the 4th wave down from January 29, 2018). A regular flat registers as an expanded flat when the B wave is over 105% of the length of the A wave—ie, the B wave would need to reach above 2889, which is has done.
That means that the ES/SPX has multiple possibilities as to a target on the downside. Accuracy (in determining the most probable target) is going to depend upon both counting and measuring the waves to the downside. It's impossible to pick a downside target at this point in the process.
If we select all of wave 4 (on the chart—down from January 29) as the "A wave," then we're looking at an expanded flat. In that case, this outcome is the most probable:
- the C wave of a flat is typically 100 - 165% of the length of the A wave (so the target would be from 2532 - approx. 2360) - preliminary targets
There are other options:
- a running flat would trace out a C wave that is NOT longer than the A wave (in other words, it would not go to a new low). I regard this option as very low probability because it's extremely rare (I've only ever seen one of them). However, if NDX is tracing out a final impulsive pattern, its fourth wave should not be very deep, which may also restrict the length of the C wave in the SP500.
Volume: Volume ticked up with Wall Street back at their desks after the summer break. However, this week, it's headed back down. The lack of volume again foreshadows a turn.
Summary: We're waiting for a top in a B wave, which will result in a C wave to a new low. My preference is that this structure represents an expanded flat, but there are other options. Once the c wave (down) is complete, expect a final fifth wave to a new high. That fifth wave up to a new high will be the end of the 500 year bull market.
___________________________
Trader's Gold Subscribers get a comprehensive view of the market, including hourly (and even smaller timeframes, when appropriate) on a daily basis. They also receive updates through the comments area. I provide only the daily timeframe for the free blog, as a "snapshot" of where the market currently trades and the next move on a weekly basis.
______________________________________
Sign up for: The Chart Show
Next Date: Wednesday, October 3 at 5:00 pm EST (US market time)

The Chart Show is a one hour webinar in which Peter Temple provides the Elliott Wave analysis in real time for the US market, gold, silver, oil, major USD currency pairs, and more. You won't find a more accurate or comprehensive market prediction anywhere for this price.
Get caught up on the market from an Elliott Wave perspective. You’ll also get Andy Pancholi cycle turn dates for the SP500 for the balance of the current month. There’ll be a Q&A session during and at the end of the webinar and the possibility (depending on time) of taking requests.
All registrants will receive the video playback of the webinar, so even if you miss it, you’ll be sent the full video replay within about an hour of its conclusion.


Thank you SIR PETER for another amazing episode of EW weekly..muchos gracias for all your time and effort educating us and keeping us safe..
If NDX hits 7900 that makes sense..as imma suspecting NYSE needs to hit a high so all of the U.S. indices get a new high before the C wave..that would bring SPX to my 3020 target too.
A Market Shakeup Is Pushing Alphabet and Facebook Out of the Tech Sector – Barron’s | September 10, 2018
https://tinyurl.com/y7zg9jzk
Also looking at SPX..if it goes up another 2-3%..maybe the 2790 would represent the bottom of the C wave..it is already nearly 5% below Fridays market close and if SPX goes another 3% higher then a drop to 2790 would be the 200 point drop SIR PETER was expecting. Ive been thinking C would be quite shallow.
Rotrot,
I have been trying to figure out just will play out with this
index re allocation that your link refers to .
i didnt read the entire article , i just scanned through it .
i believe though that the initial change is on sept 28th and
i am not sure of how much time is allowed for the process to be completed .
i seem to remember something about dec 2 as well from what i have previously read . don’t quote me .
My gut says: maybe some have been buying ahead of these changes and because of that buying early , for the most part the buy side is done .
but who still needs to sell ???? i guess we will find out soon enough .
Peter T
How is the weather up in your area of the world ???
are the articles true that your seeing snow ???
Thank you for your post today
Joe
Winter is here. Yeah, we had snow, but it didn’t stay. We’ve had several nights below zero. This is very cold weather for September.
After checking the forecast for Calgary, I see that next week, we’re expecting real snow and about 5 days in a row where we won’t even get above zero during the day.
Thanks Pete
Roaring drought over here in Oz. Most of the East is in serve drought now. Wheat crops are non existent and livestock (mainly sheep) are dying like flies. Nothing we can do. No feed, no water, no buyers and no sign of rain. But that’s farming for you over here.
Thanks, Red Dog,
This is really useful info for me.
Where is Oz?
Joe,
Will you have time to follow up on your “October 12th” comments from last week?
Ready to buy the dip again today..the market gift that keeps on giving!
Sold DIA 270 strike puts bought for 2.65 Friday for 3.84 at the open.
You are quite right that the banksters will continue to attempt to violently arrest each and every market decline.
We now have an unprecedented 14 consecutive Hindenburg Omens on the clock and it suggests to me that despite the recent ATHs, a market collapse is ALREADY underway. Can the banksters mask the underlying market weakness by a continued relentless focused buying in advancing issues? Yep. I suspect not for too much longer. They are tilting at proverbial windmills!
Looking to reload DIA 270 puts for 2.50 or better.
If the banksters fail to keep DJIA from moving below 26,500.00 this wave up probably complete.
Even I am starting to get intimidated by the banksts! lol!
Despite all the bearish signs including the island reversal patterns I exited those puts way too early.
They are now bid at 4.60 with a 4.90 ask. I may well have left a double on the table on that trade.
I am not expecting an opportunity to buy them back for anywhere near 2.65.
O.K you BTF dippers! Get moving will ya??!!! 😁
What is going on right now with Nasdaq is proof positive that the markets have literally become an insane assylum, populated by the clueless. Of course, this is what happens with destruction of price discovery.
Picked up a boatload of QQQ October 180.00 strike puts for 1.45
No way I should be able to get them that cheaply. Thanks the insane price level in VXN, I can. Incredible!!!!
If those puts remain close to 5.00, it will be the first in a very long time that we did not see the banksters pull off a brutal whipsaw reversal of an opening gap down. It looks like they are today focusing buying power on Nasdaq, where of course the most carnage will ensue once this thing finally breaks. They seem intent on keeping the herd snoring with that ridiculous green print in futures! “What fools these banksters be!” 😎
Holding IWM 165.50 puts now bid at 0.90
Lowered cost basis to 0.60 with additional puts on Friday’s ramp. I plan on sticking it to the banksters on this one as I have a lot more confidence in what the RUT chart is telling me. STC order for limit price of 1.25. Good for just about a double after com & fees. 😊
Inter-market divergences today suggests one more wave up.
Look for another ludicrous smack down of volatility. Free money, once again, any move of VIX under 12.00
Bought a bunch of calls on sale today..margined up as QQQ needs new high per SIR PETER..should drag other indices up too. Thats 2% higher from here..also bought a ton of VIX puts. 120% long now..hardy har ha!
I know phony price action when I see it and so should you. The market makers are trying to pretend Nasdaq did not execute an island reversal pattern by a ridiculous intra-day ramp of price to separate a few more bulls from their hard earned capital. I took the other side of that feint…lock and load!! 🙂
Added LABU Oct calls and DBE..and USO calls. Energy should continue up..
..energy up on opec failure to boost output. Yeah haw!
.. DB energy fund at 3 year high!
.. Energy spider at 2 month high!
.. S&P oil n gas explorers taking off!
.. Personal holding Martathon Petroleum..MPC..hits new record high!
.. Exxon soaring
Adding more energy if we get ANY pullback..my target is $150 a barrel!
— EXXON MOBIL CHALLENGES ITS JANUARY HIGH
Woo hoo! They hammering down the vix again..these bears are wimps..no fight. They had the day..and let it slip away..long live the bulls. Imma thinking its gonna take some sorta shocker to start the C wave..still thinking mid term elections in Nov. Party on fellas!
What bears??!! Clearly this market is falling under its own weight.
There has been no selling in this market for quite some time. It continues to move higher on narrowing breadth and will do so until it simply collapses.
I suspect that event is closer that most anticipate! Very tight stops are in order!
I am rooting for a few of your fellow BTF dippers to join the fray!1 🙂
It would need to be a doozy of an event IMO..trade fears not big deal..fed hike..no big deal..thats why i say we have months until B wave finally tops. Nov elections will be turning point for U.S. markets..you heard it where first. Up..up..up..until then.
Those DIA 270 strike puts still bid at a fat 4.75.
I need you BTF dippers to BUY! BUY! BUY!
I am even willing to meet you half way and pay 3.00 even; whadaya say??! 🙂
Couldnt pay me to take a long term put option..that gonna expire worthless..unless you day trading em I wouldnt buy em..just my 2 shiny Lincolns.
Well, the puts I bought for 2.65 Friday sold for 3.84 this morning.
What’s not to like hmmnnn? 🤗
Not clear to me if the BTF dippers of RUT are banksters or denizens of the “slope of hope”…lol! I really don’t care who just as long as the lower lows keep on lowering! Haha!
Looks like the plan today is stop out a few of you BTF dippers ahead of any final ramp higher. Typical!
This means I am going to have to wait for a decent re-entry on my long puts. Rats!!
I knew it!! 😀
Knowing what these banksters are up to, I will be day-trading any move of DIA below 265.50 before the close with a few hundred contracts for a very quick strike, and I mean QUICK. I will be buying the 266 strikes at market contingent on any move below 265.50 and looking for a lightning strike double. No way I am holding overnight…no Siree!! 🙂
Filled at 1.36.
Hard stop any move above 266.00 before the close….
Price of puts bouncing higher with market price…bid at 1.42…now that’s a head-scratcher!!
Yep. They are playing games with bulls and bears alike. We probably get a low in the a.m. but this move down clearly not yet done…
I am holding those puts. Will defend position with a sale of 267 puts if we move up before the close, or long options on futures if it moves overnight.
See ya laters, alligators! 🙂
Ed
ill try to follow up my comments yet in order to do so
ill need to add pic files and it is very time consuming to do so.
the basics though as i noted is i have been wrong .
the oct 12 time frame is when venus and mercury meet . they will both
begin leading the sun rise in the mornings . this is what i called the
venus bull market cycle . For me to show the data ill need to overlay the dow
over it. on top of that the mars uranus cycle is also pointing down into oct 12th.
it then points up into nov 8th and then back down into jan 20th .
on jan 20th both the venus cycle and the mars uranus cycle will point higher.
Gold and silver.
unless silver can move up and lead gold higher the risk of lower lows
is very possible. its to early to call a bottom in place in the precious metals at this time.
We need at least one more wave down before we have a PM bottom. Should happen the next two weeks.
Joe,
Thank You for responding. Please do not go to any trouble. If you are doing it anyway…We would appreciate you sharing whatever you are willing to share.
Mr Verne..I love how you see the set ups..I think you are quite a bit premature..but if you buy far enough out..you could prove to be right.. most of the traders I know..are piling into the market..lots of fresh money coming in and I still think weve got another 2-5% upside from current levels..you might miss this rally..but i see how youre positioning. As we get into Nov..I will prob start loading up on puts..but until this baby tops..imma riding the surf and waves higher and higher.
What am i missing?
.. SIR PETER says N100 needs a new high..thats 2% up from here and could go up as much as 5% on SIR PETERS measurements
.. All U.S. indices except NYSE have hit a recent ATH..why wouldnt NYSE?
.. clearly bullish sentiment..momentum..and inflows
.. vix keeps going lower..even on down days..showing how strong bull is
Looks like top is weeks if not months away..why buy puts now when you can get them so much cheaper in a month or two when markets top?
Back up we go! Yesterdays call buying spree..gonna pay big today. Loving this buy the dip market 🙂
Looking for another dip to load up..come on bears push the market down a bit 🙂
Mr Verne
Just a note
Full Moon
The moon is currently in Aries
The moon is 15 days old
Hi Joe.
My own attempts, granted with only a small sample size, to find any consistent correlation between market price and moon phases has been less than stellar, so to speak. The last few full moons exibited no market weakness as pre-supposed. They were also clearly not lows of any kind. It did appear price picked up momentum after the full moon so I suppose consolidation could be a feature of the full moon phase as well as weakness. Whatever the relationship, I so far have not found it strong enough to trade. If we see upward momentum the next few days, a case might tentatively be made for post full moon market strength, if not for full moon weakness.
its to early to call the bottom in place on gold and silver
yet ill note the productive progress.
This morning silver is indeed out performing gold which to me
is a must . the silver / gold ratio has turned up .
i use si ( silver futures ) divided by gc ( gold futures ) which is inverted
by most methods so when the ratio is rising its a bullish signal and when it is falling it is a bearish signal .
this morning the ratio made a new high above the sept 21 high .
i will note though that i have waited for years to see this ratio break below
its oct 2008 lows and it did not . that said it did break the year 2016 lows.
that is why i bought the 7 gold / silver stocks on sept 14th .
to signal a bottom in place id need to see the ratio go above the june 2018 high
and continue higher to above the july 2017 high . both those targets are quite abit higher then where this ratio sits this morning .
being that im talking about a ratio , the key is that silver out performs gold.
the 17.00 price area ( the apex of the triangle ) really needs to be hit
and fairly fast to get me excited . its not going to happen in a day though .
the 20.00 price area is going to be strong resistance .
I agree about Silver and Gold. Bottoms all arrive in the same way whether you want to attribute it to banksters or wave counts makes no difference. Commodity fifth waves are notoriously violent and that is exactly how this one will also end. I like to think of it as as a final wash out of traders trying to get positioned early and if you see the naked short contract dumps that accompany these final waves down it is very hard to argue that price is not being manipulated. I have never understood how people fail to see what is right before their eyes!
Also..can someone explain why they think weaker dollar equals lower stock prices? Numbers dont back it up!
Verne
from my own studies the moon is helpful yet ill agree
its not consistent. there is many studies though about the moon
some even written by the federal reserve . when it works its great
when it doesn’t well ???? im noticing a 60 trade day cycle showing up
with a handful of stocks . the moon is about 21 trade days per month.
21 times 3 is 63 . i watch 1st qtr moon and 3rd qtr moons as well as the new moon and full moon . i dont follow the 1/2 moon yet some do .
This market could break eifher way this morning. If it breaks higher, I will add to puts, if it breaks lower I ring the register
You know what imma buying if we get any dip..hardy har ha!
Charles
my only reasoning for a weaker dollar and lower stock prices would
be lack of confidence from foreigners.
call it lack of confidence.
i would not though make my stock market decisions on the usa dollar alone.
sept 28th is the re allocation which is only a few days away .
fed meetings etc…..
i would not blame stock prices on the movement in the dollar .
Yeah..but super weaker dollar 2009-2013 and in 2018..yet markets up in every one of those years. My thesis is dollar is mostly irrelevant to stock prices.
This market, which is deleveraging worldwide, with all asset classes moving in tandem, has very little relevance to earlier times.
If the banksters want to keep this party going they are going to have to dig a little deeper. The gaps higher in several indices this morning is truly pathetic and reeks of sheer desperation. Come on BTF dippers, help the banksters out will ya?
can we hold todays high on the cash dow and put in a 5th wave down
on a 60 minute chart ???
waves 1 2 3 4 are in place if its going to happen
oh and while were at it can the front month gold contract break 1215.80
just for grins
i tend to agree with peter
we do live in different times .
from many different angles ill add.
time for breakfast
MSFT split adjusted high in 2000 was 59.96
double that is 119.92 . it only took 18.75 months to get there
after a huge drop .
12 * .75 = 9 months
18 years 9 months . im not going to go further here
just noting the time from a high to a high .
top or not
a bit of trivia
the bull market from the march 2009 lows will be
500 weeks old next week .
the bear market in MSFT from dec 1999 to march 2009 was 111 months
the rally from march 2009 to this month is 114 months .
not that far apart in time .
26498 would be a nice spot for a temporary low on the cash dow .
But seriously, the puny gaps we saw this morning most likely represent herd exuberance more than CB pumping. When the banksters do it we see much bigger ramps. If the banksters are not pumping in the hope that crowd sentiment will drive prices higher they are going to have to change that strategy! Will they? 🙂
verne
im not a believer in the banksters.
id like to see 5 waves down on the cash dow .
not sure on the $tran at this point yet its worth watching
along with the $util
No problem Joe. You are not alone in that opinion.
As someone who has closely watched tens of thousands of ticks of price action over the years I no longer even consider the question a debatable one but that is just me! 🙂
The math works for a 5 wave move down on cash dow
yet there is a flaw in my wave count at this juncture .
it is not a clean count .
on top of that wave 5 fell short
I will make a prediction about price action today based on what I am seeing. As I stated earlier the CBs are NOT currently supporting the market so they must have a reason. Based on their pattern, this is not a decision they make intra-day. If for some reason we see price move higher today I will conclude it is a feint to keep things from getting completely out of control and it will therefore be a move that I will be heavily shorting. We could just go lower. I am simply not a good wave counter and frankly I have seen very few people who do it well enough to make their predictions consistenly tradable. This is not a criticism of the methodolgy. The fact of the matter is EW is not very helpful in telling us anything about the timing of price action, which for option traders like me, is essential information. I simply watch price action and allow it to tell me when to act and when not to.
I will make a prediction about price action today based on what I am seeing. As I stated earlier the CBs are NOT currently supporting the market so they must have a reason. Based on their pattern, this is not a decision they make intra-day. If for some reason we see price move higher today I will conclude it is a feint to keep things from getting completely out of control and it will therefore be a move that I will be heavily shorting. We could just go lower. I am simply not a good wave counter and frankly I have seen very few people who do it well enough to make their predictions consistenly tradable. This is not a criticism of the methodolgy. The fact of the matter is EW is not very helpful in telling us anything about the timing of price action, which for option traders like me, is essential information. I simply watch price action and allow it to tell me when to act and when not to.
Verne
my preference is more the forest than the trees.
any market can be manipulated in the very short term
yet the larger picture will always play itself out .
if i was to assume the banksters were in charge i would never trade .
ive heard the same argument over the years about the metals being manipulated to the downside.
common sense was to avoid bitcoin yet as soon as bitcoin futures
opened for trading its been a down hill run . we could blame the banksters for that as well .
Pump and dump stocks fit into this as well .
i do understand the arguments i just cant trade thinking like that so i do my best to keep my head on the market action more so then what who may or may not be doing.
i have noticed you have done the same .
its all about price action in the end
I agree. The fact of the matter is many of us trade on short time frames and that is exactly my point. I sometimes get very frustrated with traders who claim market manipulation does not exist and can only conclude these people do not do much trading. There is not a trader alive who has not seen hundreds of examples of his stops being precisely run only to have price turn around immediately after that happens. As a matter of fact I know there are algos programmed to move price just past fib ratios as market makers and HFT guys know so many traders use them to set stops or entries. Having said that I think larger degree wave are indeed not subject to short term manipulation but most of us do not trade with time horizons of months or years. At least I don’t.
The weak gap open this morning did not provide support and as I opined, the long candle tail suggests to me that deep pockets stepped in to prevent a market rout. I expect to see a holding pattern today but think we go lower before we go higher based on a lack of aggressive bankster buying.
Market should be up big tomorrow..after fed meeting IMO
woo hoo..doubled my $ on that dip! This is one gift giving market..thank you Mr Market.
verne
my last post for the day .
ill give the cash dow the next 3 hours and then see what i think .
better yet somewhere between the next 3 hours and into the last
30 minutes of the day today. if the wave count is correct then we should
be testing the .554 to .618 retrace . 26674 would be ideal to take a short position
a close near the high of this bounce around the same price level to me implies
sell a gap up open in the cash market tomorrow .
it may just end up as an A B C decline with only wave A in place yet
its a set up .
im not screaming bearish or bullish at this time so my trades are intended
as short term trades using the dow futures yet the prices quoted are the cash dow.
thats my thoughts
Loading up on some calls for tomorrows fed meeting..market should take off like a rocket!
Another dip..another gift.
Adding another round of SPY calls
Doing a third batch. Almost 150% long! Gonna be a big day..soon!
Made a quick 25% on drop..and pop!
Also adding some volatility puts into Fed meeting!
This website is for educational purposes relating to Elliott Wave, natural cycles, and the Quantum Revolution (Great Awakening). I welcome questions or comments about any of these subjects. Due to a heavy schedule, I may not have the time to answer questions that relate to my area of expertise.
I reserve the right to remove any comment that is deemed negative, is unhelpful, or off-topic. Such comments may be removed.
Want to comment? You need to be logged in to comment. You can register here.