

Everything is Wonderful!
If you pay attention to leaders of virtually any country in the world, everything is wonderful. The main stream media will back up that sentiment.
For example, in the US, the trade war is supposed to be a good thing … bringing lots of revenue into the country through tariffs (does anybody actually believe this?), unemployment is at almost an historic low, the stock market is at new highs and central banks (supposedly) are in full control, and we’re expecting strong levels of inflation in the near future. I’d say there’s somewhat of a disconnect from reality!
This weekend, in terms of the stock market, all the bears are piling on, due to the short-term weakness of the past couple of weeks (even though the market hasn’t damaged any Elliott Wave technical levels. But the trading herd always does that; they never learn. “Buy at the lows, sell at the highs” doesn’t ever seem to have an impact on reality … and nobody reads history, although most of us would agree that it repeats.
Such is what we can human psychology. Being contrarian can be a lucrative mindset.
You just have to browse alternative websites, like zerohedge.com, for example to find out what’s really going on. Here are some recent examples:
- Deutsche Bank is on the ropes, near insolvency
- In the US, congress is all but completely dysfunctional and corruption on both sides of the aisle has reached historic heights
- Iran is being threatened with military action — spoiler: International wars never break out at 500 year cycle tops; we’re headed for a long period of civil wars
- Negative interest rates are now spreading to bonds, which is a sign of impending doom
- Governments around the world are turning over and becoming either socialist, or populist (or both)
- Real Estate pricing around the world is collapsing, which will eventually lead to bank implosions. Australia is leading the way; they had arguably the biggest housing bubble of all.
- Economic sentiment among the young is turning down dramatically
- Family finances and standards of living are at all time lows
- American cities are falling apart; Chicago is bankrupt, Ontario (Canada) is more bankrupt than any other sovereign substate in the world. Here’s a financial update on American Cities. We’re awash in debt
- Complexity throughout business (and the Law of Diminishing Returns) are signalling a collapse is imminent (the 737 MAX debacle is only one small indicator, TSLA another)
- Floods worldwide are destroying future food production (these floods and the resulting worldwide hunger issue ALWAYS manifest at the top of 500 year cycles like this one)
- US companies are folding and many are laying off scores of workers
- Capitalist trumps health, as scientists around the world warn about the health effects to come from 5G
- And the population is getting “Dumb and Dumber” … and getting more so
- What on Earth could go wrong? Everything is wonderful. It’s time to starting getting prepared. We only have a couple of years to get our acts together for a downturn that few can fathom. History tells the tale of what’s to come.
I’ll be telling the tale in an upcoming webinar: “Navigating the Coming Crash” and I’ll have details within the next week. This webinar is going to explain all the things you can do to prepare.
Stay tuned.
_______________________________
Keeping Tabs on the Russell 2000 (Changes This Week)
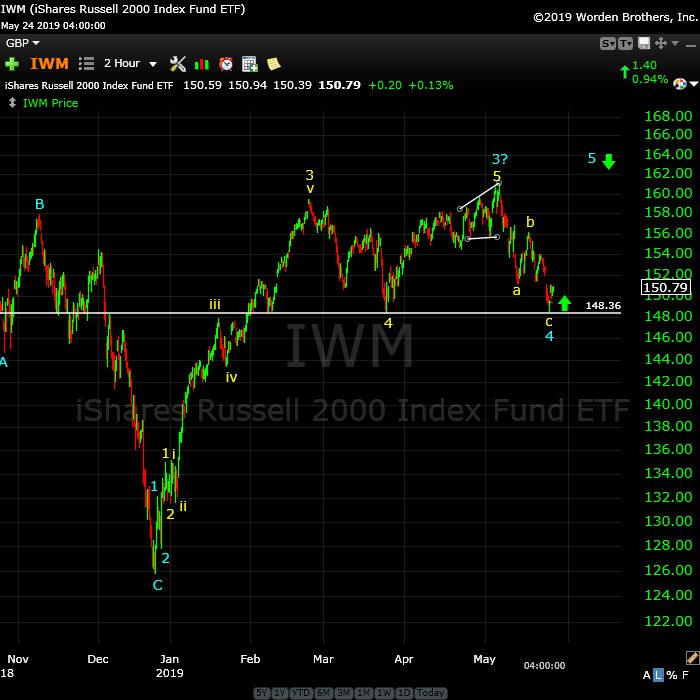 Above is the two hour chart of IWM (the Russell 2000 small cap stocks).
The corrective pattern completely changed this week. The ending diagonal that had formed broke to the downside this week and has created a double bottom with the previous fourth wave. I suspect it will turn up from here.
I’ve chosen to use a 5 wave count in order to keep track of where we are. However, the large size of what you’d characterize as the 4th/5th wave can only be a B wave, which makes the entire structure a “three.” For more on the “right look,” go here.
The other issue is at the bottom with blue wave 1, which was itself in three waves. That itself makes the entire wave corrective right from the start.
There are a couple of points to be made here:
- When a wave starts off with three waves as a first wave, the wave itself will never be impulsive (always be corrective) no matter what happens to it
- The “look of the wave” is extremely important in determining whether it’s impulsive, or corrective.
Also note that the most recent wave down is in three waves, which is obvious just looking at it. That means the wave is corrective and must retrace back up to the top.
As I often say,
“Trade what you see, not what you think.”
___________________________
Elliott Wave Basics
Here is a page dedicated to a relatively basic description of the Elliott Wave Principle. You’ll also find a link to the book by Bob Prechter and A. J. Frost.
____________________________
Registration for Commenting
Want to comment? You need to be logged in to comment. You can register here.
If you register, it protects your information. It also allows you to comment without filling in your information each time. Once you’re registered, simply go to the home page and click on the login link top right in order to log yourself in. Usually, you’ll be logged in for several days before needing to be logged in again.
______________________________
Problem receiving blog comment emails? Try whitelisting the address. More info.
______________________________
the real deal SM 2
The real deal …‘Educational, insightful and thorough market analysis for all levels of traders. It’s Elliott Wave at its best….Peter Temple is the real deal’ —SM |
Have not had a losing week RW 2
Have not had a losing week …I have been with Peter almost a year. The only thing that matters is have I made money with his service. I think I have finally turned the corner using Peter’s EW. I have not had a losing week in the last 5 months. Thanks Peter, for your amazing amount of hard work. —RW |
Tops in your field DZ 2
Tops in your field …You are tops in your field. Tried to follow Elliot Wave international for years. They were always behind the market. After discovering you, I perceive that you are an expert in reading the waves, which puts you way ahead of the rest of your peers. And you can read the Waves like you are reading tomorrow’s financial section. I pray you stay healthy. —DZ |
Rise above the rest … SM 2
Rise above the rest …I have only ever met a few people who, in their chosen fields (astrology, medicine, music, martial arts, technical analysis), rise above all the rest and you are one of them…you have ‘the gift’…and that’s why I’m a Trader’s Gold member. —SM |
Couldn’t be happier … KK 2
Couldn’t be happier …The analysis and insight you provide is simply amazing! I’ve been trading the futures and equity markets for well over thirty years and usually average around 5% monthly. Since joining your Traders Gold Service two months ago, that number has better than doubled. I couldn’t be happier.—KK |
Get an upper hand … JC 2
Get an upper hand in trading …Seeing all the different currency pairs and the wave structures and hearing you explain why this has to do that on a nightly bases gives one a upper hand when trading. Elliott Wave applies to all stock and indices and can be applied to any candlestick chart. If someone ask what you want for Christmas – Tell them a membership to Peter’s “Traders Gold!”—JC |
A true expert in Elliott Wave FL 2
A true expert in Elliott Wave …You are a true expert in EW analysis. What you provide is not available anywhere and is priceless. Subscription on your services is the best thing I have ever done. Many thanks for your effort to make me a better investor. I now have more trust in my investment decisions. I hope you will continue the excellent work! —FL |
The best of them JL 2
The best of them …Last couple of years, I subscribed to several ‘market traders’. You are by far the best of them and the personal contact is awesome. Daily and daily updates are very well written! Besides your expertise in EW, I also like your cycles analysis. Best investment I ever made! —JL |
US Market Snapshot (based on end-of-week wave structure)
This chart is posted to provide a prediction of future market direction. DO NOT trade based upon the information presented here (certainly NOT from a daily chart).
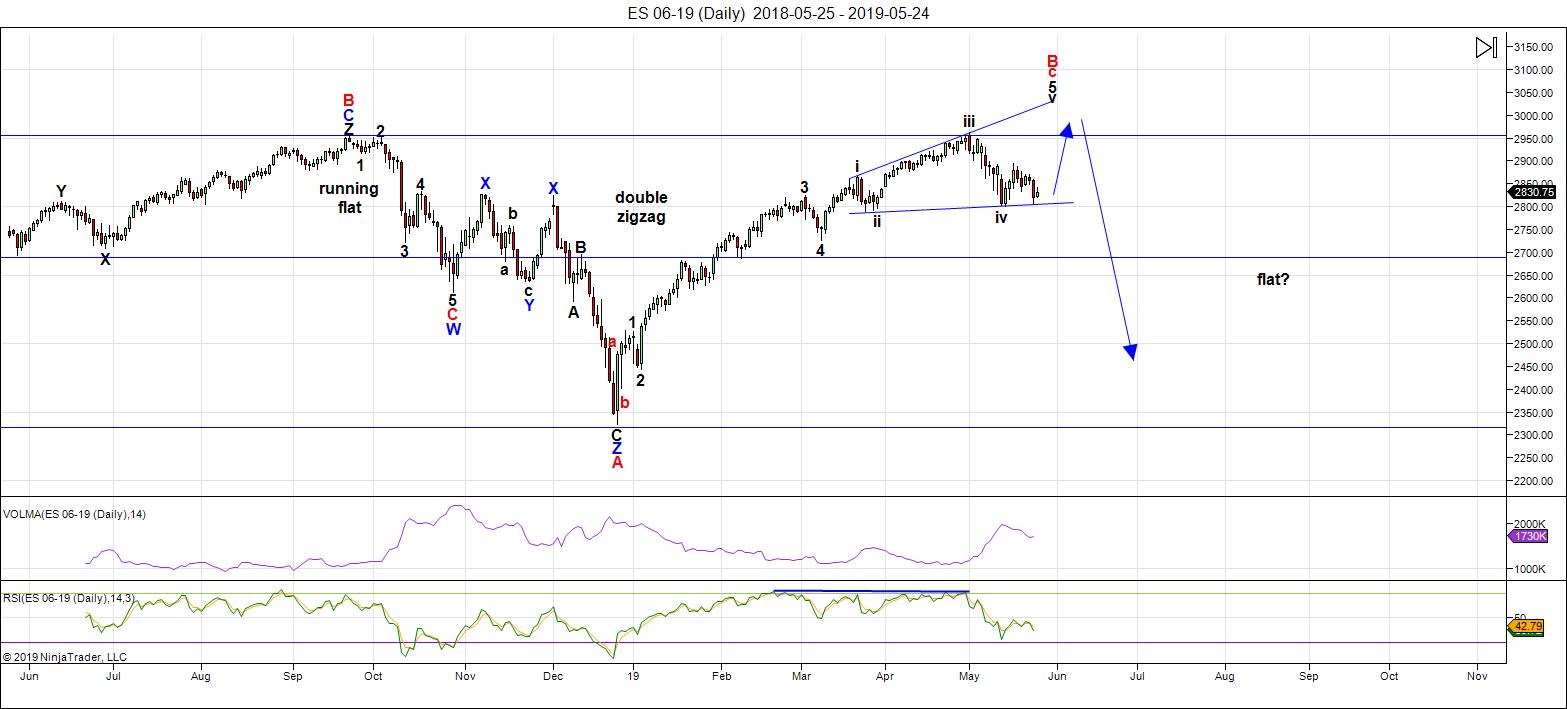
Above is the daily chart of ES (click to enlarge, as with any of my charts).
I've been predicting a new high for the current bullish (corrective) wave in the US indices for a few weeks now. That's because the wave down from the current top was corrective right from the get-go. However, this market is so weak, that the final rally attempt keeps failing. It'll eventually get there, though, because corrective waves retrace to their tops (or bottoms, as the case may be).
The next major move is to the downside (after the top is in). I can't provide a date for a top, because of all the wave failures. These wave failures have also affected current patterns in some indices. Some ending diagonals (at the tops of the DOW and Russell 2000, for example, have failed. This has resulted in double fourth wave bottoms (they're really B wave bottoms — the structure of the wave up from Dec. 26 is so corrective, as I've been saying right from the start). The corrective nature now couldn't be more obvious.
As a result, the wave up from Dec. 26 in ES is must eventually fully retrace to the downside. This is supported by the US Dollar Index, the major USD currency pairs, WTI Oil, along with DAX, TSX, and other international exchanges.
The current pattern in ES still appears to be an ending expanding diagonal. There is still the possibility that this pattern could also fail and drop a little lower over the next couple of days.
This week, the currency pairs (and the US Dollar Index) reversed, as I've been predicting they would, to allow the final rally, as somewhat of a "parade to the top."
It's impossible to successfully analyze this market without taking into account the movement of a number of related asset classes. The market has gradually been aligning across these asset classes and now virtually everything si moving more or less in "lock-step." When you trace out a major top, all major indices have to top at the same time. This 500 year topping process will include many international exchanges.
Summary: My preference is for a dramatic drop in a 4th wave to a new low. The culmination of this drop should mark the bottom of a large fourth wave in progress in the NYSE since January 29, 2018 - a year and a half of Hell. It may be a relatively fast, dramatic drop. In any case, ES will target the previous fourth wave area somewhere under 2100.
Once we've completed the fourth wave down, we'll have a long climb to a final new high in a fifth wave.
___________________________
Trader's Gold Subscribers get a comprehensive view of the market, including hourly (and even smaller timeframes, when appropriate) on a daily basis. They also receive updates through the comments area. I provide only the daily timeframe for the free blog, as a "snapshot" of where the market currently trades and the next move on a weekly basis.
______________________________________
Sign up for: The Chart Show
Next Date: Wednesday, June 5 at 5:00 pm EST (US market time)

The Chart Show is a one hour webinar in which Peter Temple provides the Elliott Wave analysis in real time for the US market, gold, silver, oil, major USD currency pairs, and more. You won't find a more accurate or comprehensive market prediction anywhere for this price.
Get caught up on the market from an Elliott Wave perspective. There’ll be a Q&A session during and at the end of the webinar and the possibility (depending on time) of taking requests.
For more information and to sign up, click here.
| "I think you are the only Elliot Wave technician on the planet who knows what he's doing.” |
| m.d. (professional trader) |
All registrants will receive the video playback of the webinar, so even if you miss it, you’ll be sent the full video replay within about an hour of its conclusion.


as per this site ftp://ftp.swpc.noaa.gov/pub/weekly/27DO.txt
A index ramps up on 2019 May 28 from 5 to 10 and again
ramps down May 31 to June 1 from 10 to 5.
Haven’t looked at hourly 3 hr chart, but may be a ramp from 28 tuesday to 29 wedenesday.
I am new to this geomagnetic tracking analysis.
This is the only place where you can see future KP index on a 3 hour basis. I dont think there is any other place where you have a prediction for the KP index more than 3 days.
https://www.swpc.noaa.gov/products/planetary-k-index
A good article,
https://www.technicalindicatorindex.com/subscribers/guest-articles/Hindenburg%20Article%20May%2025th%2C%202019%20McHugh.pdf
Peter T,
If a person cannot watch the webinar live, can it be purchased at a later date to watch?
Jeff T
Yes, I leave the webinar for the week up until the weekend following the Wednesday, then I change over the links. If you wanted to watch last week’s now, you’d have to let me know and I would invoice you and provide the link. But the current one for the week is always up until Friday night.
peter: the webinar “Navigating the Coming Crash” you are referring to is the weekly chart show ?and it is $19.00 am I correct? and that will be coming this week?
thanks
shunn
Shunn,
Navigating the Crash is a one and half hour webinar I did a couple of years ago https://worldcyclesinstitute.com/navigating-the-crash/
I’m updating it to today and will be announcing a date for it later in the week.
I do the Chart Show every Wednesday and yes, it’s $19.00.
Two different webinars.
I’m also working on a free webinar on Elliott Wave basics.
got it , and looking forward to see the new webinar ” Navigating the Crash” coming this week
Shunn
My astro days short term are May 31 after that June 7. These are change in trend days.
May 31, my best guess it is a bottom, after that June 7, that has to be an other (lower) top.
Goodluck trade safely
But first we ramp up into Wednesday…
Very intetesting bi-furcation developing in the cycles and market forecasting camps.
Savvy analysts like Avi Gilburt are saying a “trap door” has been opened with the recent technical damage and the descent below 2830 soundind an alarm of serious impending downside. Guys like Nenner are predicting cycle lows this week and a Summer market top. Short term still looks weak to me. Where NDX goes, the broader markets most likely will follow. The NDX closure of Friday’s gap higher in my opinion spells caution for the bullish viewpoint. As long as Thursday”s gap down remains open, that also is reason for caution. We also have a live H.O. warning on the clock.
Both camps cannot be correct. Unless of course we get a heart-stopping decline that goes farthet and faster than anything prior…
Yeh, positive divergence on times and indices also, so some think small rebound then more drop. I did a decent Texas 2 step last week, sold my best longs on 22nd, moved VXX and SQQQ on 23rd and headed to Tn to enjoy Harley on Thunder Road and some dark whisky. Now what do I do B)
Thank you Mr. Temple for the new post.
p,
You’re welcome!
When I look at the Dow weekly..not thinking EW..our first wave down on this compared to Jan 2018 or Oct ..is much more delicate of a drop..and buyer def coming in to stop it and holding that 25000 area
To me the lower trend line from Jan 2018 to now.. without the outlier Dec low..is the line in the sand..if we slash it we are going down..or if they are trying to make this more gentle and fool the masses and..if we break it and find return resistance and not able to break above..we are going down from there …
thank you bill for stepping in those were good finds on energy.
Peter I think that is a great idea about the EW basics..especially if people can ask questions..on the webinar..
Question to the astro guys..from what I read from all of you I get there is more to this than just the full moon..but with that said. would someone mine explaining why you would..or wouldn’t expect the new drop to be around June 17 the next full moon thanx..
typo..mine..mind
Marie,
In my astro work many planets are important, not only the moon.
Important is too look where we are at the moment when we enter a date, May 16 was a lower top so there was a possibility that we could see a turn here to the downside.
So if May 30/31 shows a low, I will go long and if it is a top, I will be shorting.
The bollingerband and Tom’s energy charts are great tools to help me with the direction.
I hope this answer helps.
All the best John.
Has anyone heard of the Micro Dow futures ??
50 cents per point vs the emini dow at 5 bucks.
would someone mine explaining why you would..or wouldn’t expect the new drop to be around June 17 the next full moon thanx..
my question would be what is significant to you about the June 17 full moon ?
Some times simple cycles point to a time near a new or full moon so in that case
when time based on time counts of what ever happen to show up near a full or new moon then I pay attention to it more so then just A full or new moon .
Pattern completions near full or new moons id watch also .
other than that , at the moment I see nothing major near the mid June time period to consider it meaningful.
I Can Be wrong !!!!!
playing with the Micro Dow futures to pyramid with .
my bias is basically the shorts using June contract need to cover
Hmmmmmm Mid june full moon ??
thanx for the replies..
I do get what your saying John..and Joe appreciated..
Verne
my time basis trading says to get long.
may 22-june 3 a low
indicator wise ??? a very different picture .
at the very least I can only call this a mid cycle low .
I have no oversold readings showing up in my medium term swing
indicators .
very short term a few fair readings but basically
overall its a middle of the road reading.
This next week really must begin to show at the very least a flat market
and the following week must be up .
25904 in the emini dow futures needs to be at least touched to give me
any sign we just saw a secondary low .
Cash dow chart allows for a spike up then another pull back .
we may have a few more days of nonsense is all im getting at
yet the internal readings say one thing
the individual stocks that are the heavier weighted dow stocks
kind of look like they have pulled back far enough .
the lighter weighted dow stocks are holding up fairly well .
this is a similar set up to the previous declines I have seen of late .
the lighter weight stocks hold up as the heavier weighted stocks pull back
and then both weighting groups fall further giving a strong decline .
right now in the overnight futures all I can say is it is constructive
but honestly it feels like paint drying .
its going to come down to the cash markets to really prove what is about to
take place next .
Nibbling with the micro dow and keeping my self only lightly bullish
for the next couple days
25450 in the YM is my focal point ( not saying im targeting it , just keeping an eye on that level going forward )
Joe that is interesting. Your calls have been more consistently correct than any of us. For orher reasons I too have been expecting at least a revisit to the 2910-2920 area but this market appears exhausted. It could be that at significant tops a weakening market may simply be unable to fulfil otherwise normal technical expectations, such as a retest of a prior support/resistance shelf. As I indicated, NDX immediate fill of the open gap up from Friday was for me a cautionary note. Downward gaps from last Thursday also remain open. We now also have a rare pre-market VIX gap higher. It can be quite a challenge for traders when there are conflicts between legitimate posible EW counts, cycle analtsis, and other technical indicators. Based on what I am seeing I biased to the short side until and unless last Thursday’s open downward gao is closed. I do have short term hedges in the form of a straddle and a few long call. One cannot underestimate bankster ability to control the short-term market narrative and we could yet see more intervention in the face of obvious market weakness. We have seen this play out far too often to not be prepared for such an eventuality. Price tells all!
Some hapless fool tried to attack the pre-mamarket VIX gap higher; the results speak for themselves. The one thing the banksters have absolutely no power to control is genuine market fear. It”s decade long absence from the market may be about to change. Six of the most significant volatility events of the last 50 years occurred in 2018. It would seem not too many are paying attention, which allows some of us to get in on the cheap…
Looks like banksters at work. Panic buying after a nasty futures plunge. Won’t surpise me in the least if they bid it into the green by market open Either way, they are in serious trouble, thrash around as they might…
Yeh, gamesmanship pre-open, so it will be interesting to see what happens with volume trades on open.
There are similarities (acknowledged by pros) that 5/19 is a lot like 5/08 and 5/09, so I look at this as a time to be careful (particularly if VOL pops). Higher lows and lower lows among indices can do similar dances to tops before the downturn Peter T envisioned, but I can see failed tops on some sectors, so I will be ready to take sides… but not right now. The move down last few weeks has markets more oversold than overbot, but not dramatic. Maybe this is the divergence needed to move markets higher, but moving averages overhead will be resistance to deal with. Short term and mid term indicators mixed to lower, LT still higher so expect whip-saw moves and Quad3 to Quad 4 indications for Q2 (reported in July) will (I think) cause negative surprises. Best to your trading… Cheers!
OOOPS! Meant similar to 5/08 and 5/01, both efforts to base and move up… that failed.
Price has now twice violenrly broken below the 2830 contested shelf and both times they furiously bid orice back above. That level worth watching. If they successfully reclaim it in ES rhe bulls will have a good day.
Resistance 283-285 (50EMA), QQQ 183-186, positive divergence on PPO so might be picking up nickels in front of steamroller… I will watch how strong rebound is today/this week for Peter’s counts.
Hi Peter and friends
energy chart attached below
make sure you press GIF button to view
https://ibb.co/qjNDYmG
p.s. thanks for the kind words and prayers for my precious Joanne
Hi Tom,
Thanks and it is nice to see youre indicators pointing nearly the same direction. Confirmation is important! 🙂
What the differences are:
– A High arround the opening of the US markets tomorrow 29th
– A decline into the end of Thursday end up into the weekend.
We will see what is O.K.
But,
I have a possible Low open on Monday. Two of my indicators give a Lower LOW on Sunday at the time of opening US Futures.
What have You on that time or Monday?
Willem
sorry this is the “website” http://www.prognoseus500.nl/
Thanks Tom,
All the best for both.
Hi Tom, thank you so much for the update. My condolences again and time hopefully heals her inner wound in haste.
All I see is a series of corrective waves in both direction. That makes short term forecasting tough. Around 2800 was one zone for the market to hold. The next level is around 2720 – but its not clear if we get there. Given Joe’s track with timing, I will go with his time zone for a low – basically the next 4 days. I have been playing the short side using puts and rolling it on dips. This is too murky for me to be short outright. At some point I will try a position on the long side for a spec, but momentum still very weak for that attempt.
It cerainly seems to me the trend at minor degree is downward…
Market Green. VIX Green. Bearish!
Short term techs are very bearish – yet that 2790-2800 support still intact. Can be a quick 50 point move in SPX if that support is broken
Yep, bot SQQQ at open, up $500, might take it off but I plan to fade High beta and tech on move up…
Unless the bulls fire up the engines this week, we will end the month with a monthly bearish engulfing candle. Granted the banksters have demonstrated remarkable skill at negating bearish signals on shorter time frames, such signals on longer time frames may be more significant. While new highs after a monthly bearish engulfing candle would certainly not be impossible, the likelihood of that would imho be remote. Bottom line is if we are going to see new highs it is going to have to happen the next four trading days, including today…
We are seeing sideways price consolidation beneath formidable overhead resistance in the form of an open gap.
While one can never be presumptuous when it comes to opining on market matters, nothing I have learned about trading suggests this price action presages an upward break…I,of course, could be in error, and it would not be the first time.
Trading set up is pretty clear – sell @ 2838 and use 2848 as a stop. Forecasting is a totally different exercise
🙂
took the QLD this am and I had bought Svxy friday..sold both once saw market stalling… ..so was at least a little pop
welcome back Tom
Thanks Marie
whoever put the “Fun” in Funeral
should be arrested
good one lol
http://schrts.co/jIhbmcUk Maybe?
Battle underway for 2820. A break there means 2800 falls before the close…
If the bulls do not want to get steam-rolled, they had better defend 2800.00
If they don’t…
Farewell, and adieu…! 😉
Lower gaps filled, overhead gaps open. Near term bearish…but y’all knew that! 🙂
Knock, knock, knock on heaven;s door…! 🙂
We know a few things:
They declined using leverage to fill the overhead gap.
Instead, they have opted for a “managed decline”
How long before the herd figures out…?
Knock, knock, knock on heaven;s door…! 🙂
Head fake hammer…get ready for the dump…!
there is a reason why I gave may 22 June 3
each year when we enter this portion of this cycle
I mention it and then we end up in a debate .
im not looking for debate im just going to point it out
and we will see how next weeks market action plays out .
May 13 was the panicky price low and we did get oversold readings
from that .
May 23 was 1 day after the may 22-june 3 time period .
Now as we go through this week we have 1 last thing to consider .
Ill call it the puetz cycle but please lets not debate .
My observations of this cycle has been a move beginning at the new moon
1 cycle prior to the new moon solar eclipse . That is a directional move
from new moon to new moon solar eclipse .
June 3 new moon and July 2 new moon solar eclipse .
im not trying to get all technical here but I will
july 2 plus 6 weeks is mid august . the full moon in mid august is an important
cycle date for several reasons ( its the end point for the Venus bull cycle , in other words its the start point for the Venus bear cycle )
the typical move is new moon to solar eclipse directional move then a counter trend move into the full moon lunar eclipse and then a thrust ( up or down )
into the following new moon and then the cycle ends near the full moon that is 6 weeks after the solar eclipse .
It appears to me that many are assuming another Nov 2018 type set up in the making . I do not see this at this time but ……. the market will tell us
It is looking to me like next week is where the rubber meets the road is all I can say .
Price wise standing by the 24906 price extreme that matters to me on the cash dow
Exactly Joe.
We simply cannot allow our market bias/expectation to determine our posture and instead simply have to LOOK at what Mr. Market is actually doing to arrive at an intelligent assessment.
2800 WILL fall.
That ends all debate in my humble opinon….
This is a very dangerous close. I had rolled the strikes of my puts closer on the morning rally. Not rolling it lower anymore. This is as bad a close as possible for the bulls. Overnight session now ultra critical.
No doubt about it. Every trader can see exactly what they are doing.
These people are incorrigible!
They kept my puts expiring today on ridiculously low bids until right up to the close. Unfortunately for them, they were not sure if I would let them go into expiration and force them to go out and sell short the shares and finally coughed up a reasonable bid. Cretins! 🙂
Very dangerous market, all the more so because of what appears to me to me entirely misplaced expectations of the herd.
Trade (and tread!) safely!
As per energy chart we ramp up from now untill early morning 2am est, then have a low around 8 am est and then ramp until end of day.
https://www.swpc.noaa.gov/products/3-day-forecast
Tom,
Are you charts based on Kp and A index or do you use anything else.
Energy chart implying a spirited defence of 2800 pivot.
ES will tell us how successful the attempt.
A break of 2780 in ES means NYET!
The cash dow closing the week below 25450 will be the lowest
close on a weekly chart since march 4th 2019.
if the end game becomes bullish then I could call this an expanded flat
weekly close only chart ..
This therefore says the cash dow should close below 25450 this week
so next week will indeed matter as to label the present market .
Its all about Fridays close , then comes the cycles and the New Moon .
Agreed. An awful lot can happen between now and Friday. They could have set up bullish traders today with that mis-leading bounce at around 2800. They will likely whipsaw longs at the open tomorrow before reversing hard upwards. We have seen numerous times how ferocious these updrafts off over-sold conditions can be and while I have my doubts that they will negate the impending May bearish engulfing candle, a better than 70 point upside ramp by this Friday is not out of the question. In fact, I for one am counting on it…!
anyone note the 3.618 extension on an hourly chart ??
March 4 plus 90 days roughly june 4 —- is Fibonacci showing up ??
3 peaks domed house ???
Jan 2018 PT 15
The Present thought is were now heading into the PT 20 low
The run from pt 20 to pt 23 is a Zig Zag A B C formation .
What we should end up with is a Head and Shoulders Top formation
The requirements are 5 swings labeled 15 16 17 18 19 20 ……..a sideways move.
Sounds like Elliott wave theory ?
It does but it is based on the work of the late George Lindsay .
Not too familiar with that patttern. I remember how amazed I was last year when I started talking about Hindenburg Omens and I got the distinct impression that most folk could not care less. We got an unprecedented nine in a row and hardly a peep out of the useless corrupt lame stream media. Some even pooh-poohed the Omen’s relevance.
Well, we all know what happened. I am not going back to talking about this until I am blue in the face but FWIW, we just got a SIXTH one today…
Wow!
You’ve really gotta hand it to them.
That was some crafty, deft gamesmanship on display yesterday.
Noticed how they “walked” price down then “conveniently” parked it right above the 2800 pivot?
A LOT of traders took the bait, and the hourly bullish divergence was a sweetener.
Even a very savvy trader like Randy went long yesterday. I know he is hedging big time with futures!
Well, I for one thought it was waaaaayyy too cute….NYET!!!!! 😁
The risk parity trade and bankster leverage are the key drivers of market price nowadays, imho.
Get a handle on those two key items and you will usually be a step ahead. That stubborn overhead gap was a tell…no bankster leverage!
Speaking of risk/parity, see that VIX gap higher?
Well, you get my drift…!
I respect H Omen but hard to trade around (except to fade rallies). I did that yesterday, buying SQQQ as QQQs rebounded into resistence ~9:30, then added to it and 2 scoops of VXX on 2nd peak ~noon:30. Got good juice (and better this morning) but this will be hard to hold. The 50EMA and 200EMA (or SMA) is in played, and Joe’s 3 peaks is LT pattern to watch. Time to decide to take gains or be ready to add more scoops if/when market rebounds. This is tricky time with tricky banksters, and Randy will have covered. Be careful out there.
As traders, we know exactly what to do and when to do it due to the several sign-posts:
Mind the Gaps! 😎
DWT (-3x crude) up 40% in last month! Was I a zombie or what?!
This website is for educational purposes relating to Elliott Wave, natural cycles, and the Quantum Revolution (Great Awakening). I welcome questions or comments about any of these subjects. Due to a heavy schedule, I may not have the time to answer questions that relate to my area of expertise.
I reserve the right to remove any comment that is deemed negative, is unhelpful, or off-topic. Such comments may be removed.
Want to comment? You need to be logged in to comment. You can register here.