
 Fear Lurks Beneath the Surface
The good news is that the B wave in the SP500 is just about done. This fourth wave down late in the week foreshadows a big drop to come.
The waves up in ES/SPX are corrective and showing rather dramatic signs of coming to an end.
The wave structure of both the SP500 and the NDX has become quite complex and my analysis each night seems to take much longer to complete.
I had thought that when I started this weekend’s analysis, I’d be left with more questions than answers, but it turned out to be the opposite. It took some work, though.
This has led to a complete review of the higher degree wave structures of both these indices NDX/SP500). They’re aligned, but the structures are slightly different in that the SP500 is tracing out a flat as part of a corrective wave up from 2009, while the NDX is finishing an impulsive sequence. They will end at the same time.
We now seem to be at an important juncture. Once we get a small 5th wave up from the current interim low, it will finish off the last third wave for both indices. That means we have only fours and fives left to finish off each final sequence and that, in turn, means we have volatility ahead to complete the final topping process.
Whether we get finished before or after Christmas is a bit of a “crap shoot.” In any event, the top is very close.
______________________________
This Week’s Chart Show
In this week’s Chart Show, I’ll go through the longer term prediction for both NDX and the SP500 and give you a detailed route to the top. The charts have been slightly revised, measured, and give a clear picture from 2009 to today, with a measured projection for the highs.
You’ll get a clear view of where we’re going from here and a rough timeframe for the top.
Spoiler: This 500 year rally is coming to an end relatively soon. For the complete story, log into the Chart Show on Wednesday evening (links at the bottom of this post).
Stay tuned!
__________________________
Elliott Wave Basics
There are two types of Elliott wave patterns:
- Motive (or impulsive waves) which are “trend” waves.
- Corrective waves, which are “counter trend” waves.
Motive waves contain five distinct waves that move the market forward in a trend. Counter trend waves are in 3 waves and simply correct the trend.
All these patterns move at what we call multiple degrees of trend (in other words, the market is fractal, meaning there are smaller series of waves that move in the same patterns within the larger patterns). The keys to analyzing Elliott waves is being able to recognize the patterns and the “degree” of trend (or countertrend) that you’re working within.
Impulsive (motive) waves move in very distinct and reliable patterns of five waves. Subwaves of motive waves measure out to specific lengths (fibonacci ratios) very accurately. Motive waves are the easiest waves to trade. You find them in a trending market.
Waves 1, 3, and 5 of a motive wave pattern each contain 5 impulsive subwaves. Waves 2 and 4 are countertrend waves and move in 3 waves.
Countertrend waves move in 3 waves and always retrace to their start eventually. Counrtertrend (corrective waves) are typically in patterns — for example, a triangle, flat, or zigzag. Waves within those patterns can be difficult to predict, but the patterns themselves are very predictable.
Fibonacci ratios run all through the market. They determine the lengths of waves and provide entry and exit points. These measurements are really accurate in trending markets, but more difficult to identify in corrective markets (we’ve been in a corrective market in all the asset classes I cover since 2009).
To use Elliott wave analysis accurately, you must be able to recognize the difference between a trend wave (motive) and a countertrend wave (corrective). There’s very much more to proper Elliott wave analysis, but this gives you the basics.
____________________________
Registration for Commenting
Want to comment? You need to be logged in to comment. You can register here.
If you register, it protects your information. It also allows you to comment without filling in your information each time. Once you’re registered, simply go to the home page and click on the login link top right in order to log yourself in. Usually, you’ll be logged in for several days before needing to be logged in again.
______________________________
Problem receiving blog comment emails? Try whitelisting the address. More info.
______________________________
the real deal SM 2
The real deal …‘Educational, insightful and thorough market analysis for all levels of traders. It’s Elliott Wave at its best….Peter Temple is the real deal’ —SM |
Have not had a losing week RW 2
Have not had a losing week …I have been with Peter almost a year. The only thing that matters is have I made money with his service. I think I have finally turned the corner using Peter’s EW. I have not had a losing week in the last 5 months. Thanks Peter, for your amazing amount of hard work. —RW |
Couldn’t be happier … KK 2
Couldn’t be happier …The analysis and insight you provide is simply amazing! I’ve been trading the futures and equity markets for well over thirty years and usually average around 5% monthly. Since joining your Traders Gold Service two months ago, that number has better than doubled. I couldn’t be happier.—KK |
Tops in your field DZ 2
Tops in your field …You are tops in your field. Tried to follow Elliot Wave international for years. They were always behind the market. After discovering you, I perceive that you are an expert in reading the waves, which puts you way ahead of the rest of your peers. And you can read the Waves like you are reading tomorrow’s financial section. I pray you stay healthy. —DZ |
Rise above the rest … SM 2
Rise above the rest …I have only ever met a few people who, in their chosen fields (astrology, medicine, music, martial arts, technical analysis), rise above all the rest and you are one of them…you have ‘the gift’…and that’s why I’m a Trader’s Gold member. —SM |
A true expert in Elliott Wave FL 2
A true expert in Elliott Wave …You are a true expert in EW analysis. What you provide is not available anywhere and is priceless. Subscription on your services is the best thing I have ever done. Many thanks for your effort to make me a better investor. I now have more trust in my investment decisions. I hope you will continue the excellent work! —FL |
The best of them JL 2
The best of them …Last couple of years, I subscribed to several ‘market traders’. You are by far the best of them and the personal contact is awesome. Daily and daily updates are very well written! Besides your expertise in EW, I also like your cycles analysis. Best investment I ever made! —JL |
Get an upper hand … JC 2
Get an upper hand in trading …Seeing all the different currency pairs and the wave structures and hearing you explain why this has to do that on a nightly bases gives one a upper hand when trading. Elliott Wave applies to all stock and indices and can be applied to any candlestick chart. If someone ask what you want for Christmas – Tell them a membership to Peter’s “Traders Gold!”—JC |
The Market This Week
Here's the latest daily chart of ES (emini futures)
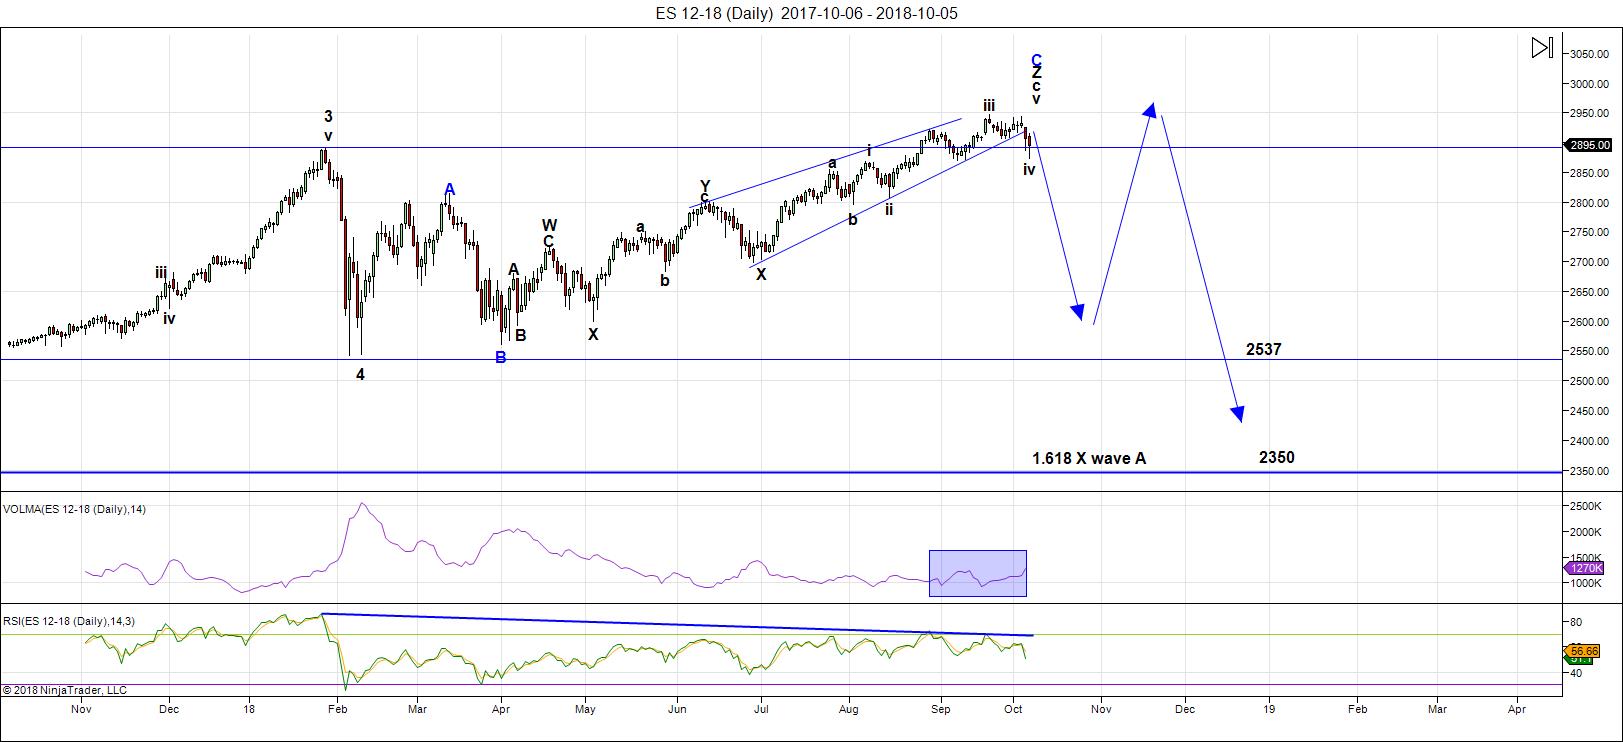
Above is the daily chart of ES (click to enlarge, as with any of my charts).
On Thursday we had a large drop and Friday confirmed a fourth wave in both ES and NQ. That drop didn't necessarily negate the ending expanding diagonal (which seems to have ended a small third wave up), but it did destroy the small ending diagonal that was forming as a fifth wave. The drop seems to have been the result of a failed small 5th wave, which will require a new small fifth wave high.
Ending diagonals can end 3rd waves, 5th waves, and C waves.
Back up we go to a new high.
In terms of the bigger picture, my preference for the resolution of this very large B wave that we've been locked in since the low in February is for a C wave down after we reach that new high. This is the pattern of a expanded flat. However, technically, it could also be a running flat. At the present time, the B wave (that's the ABC wave up from about 2532) is longer than the A wave (marked as the 4th wave down from January 29, 2018). A regular flat registers as an expanded flat when the B wave is over 105% of the length of the A wave—ie, the B wave would need to reach above 2889, which is has done.
That means that the ES/SPX has multiple possibilities as to a target on the downside. Accuracy (in determining the most probable target) is going to depend upon both counting and measuring the waves to the downside. It's impossible to pick a downside target at this point in the process.
If we select all of wave 4 (on the chart—down from January 29) as the "A wave," then we're looking at an expanded flat. In that case, this outcome is the most probable:
- the C wave of a flat is typically 100 - 165% of the length of the A wave (so the target would be from 2532 - approx. 2360) - preliminary targets
There are other options:
- a running flat would trace out a C wave that is NOT longer than the A wave (in other words, it would not go to a new low). I regard this option as very low probability because it's extremely rare (I've only ever seen one of them). However, if NDX is tracing out a final impulsive pattern, its fourth wave should not be very deep, which may also restrict the length of the C wave in the SP500.
Volume: flat, and very low.
Summary: We're waiting for a top in a B wave, which will result in a C wave to a new low. My preference is the larger structure (from January 29) represents an expanded flat. Once the c wave (down) is complete, expect a final fifth wave to a new high. That fifth wave up to a new high will be the end of the 500 year bull market.
___________________________
Trader's Gold Subscribers get a comprehensive view of the market, including hourly (and even smaller timeframes, when appropriate) on a daily basis. They also receive updates through the comments area. I provide only the daily timeframe for the free blog, as a "snapshot" of where the market currently trades and the next move on a weekly basis.
______________________________________
Sign up for: The Chart Show
Next Date: Wednesday, October 17 at 5:00 pm EST (US market time)

The Chart Show is a one hour webinar in which Peter Temple provides the Elliott Wave analysis in real time for the US market, gold, silver, oil, major USD currency pairs, and more. You won't find a more accurate or comprehensive market prediction anywhere for this price.
Get caught up on the market from an Elliott Wave perspective. You’ll also get Andy Pancholi cycle turn dates for the SP500 for the balance of the current month. There’ll be a Q&A session during and at the end of the webinar and the possibility (depending on time) of taking requests.
All registrants will receive the video playback of the webinar, so even if you miss it, you’ll be sent the full video replay within about an hour of its conclusion.


Now that we have the C wave in place..on DPX..we wait for this 1st wave to bottom then the 62% retrace..then the fireworks right?
SPX hardy har ha
VIX suggesting all you-know-what is about to bust loose….! 😀
Yes Mr Verne..I went short at the open!
C wave finally here..boo yeah baby!
Enjoyed your chart show…good stuff..thanx!
Thanks, Marie. It was a little bit rushed due to all the action yesterday. A bit of a crunch to update so many charts … lol.
Looking like a fourth wave today. One more low and will see how high she bounces! 😉
This C Wave has been a great trade..Will wait for 62% and reload my shorts! Think it will get below 2500?
You get yours..with this C wave.. i know ya were shorting it like a mad scientist!
Adding GLD and VXX calls for this C wave down
I have started putting on some SPY call 1x2s for a potential bounce. Given that ES sliced through 2800 and failed on retest, this decline will spend a few days staying down ! Thinking of this as a wave “a” of C.
Yes..imma agreeing..once first wave bottoms..then should retrace 62% before we go to 2500 or lower..imma adding gold and long vix trades too. SIR PETER called the C wave right but thats a given. I shorted early and once we dropped below 2790..i knew we were golden like a retriever.
I think the wave down is just about done. VIX indicating a possible bounce just ahead. I loaded some bull put credit spreads in anticipation and looking at VIX 20 strike puts expiring next week.
Then you loading ya shorts back at 62% retrace? This C wave has been great so far! Looking for much bigger profits after the retrace! Thank you thank you SIR PETER! Glad I took my money and ran at new n100 high and went opposite way!
Added UPRO and TQQQ calls
Ok Verne – I bought some VIX puts. Have not done that trade before. Lets see how this one goes. Its already up 25%…
I would like to see this market show some strength soon. Otherwise, look out below. I am not positioned for that move – yikes !
Yes..its looking that way..Now that we have a confirmed C wave according to SIR PETER..is there any target for the 1st wave down?
Stopped out of my longs. This is not over. Not yet.
Yeah..SIR PETER called this C wave perfectly..just wonder where 1st wave will stop. Then a 62% retrace and short the market again for the rest of the C wave.
Out of my UPRO and TQQQ near breakeven..seems the first wave down in this C wave has further to go.
Woo hoo. Shorts taking off. Thank you thank you SIR PETER. You called the C wave to a t!
My vix calls soaring!
Took my money and ran. In near 5 out close to $9 bucks. Almost a double in a few hours..not gonna get greedy!
Looks like a bottoms in at 2710..added back into TQQQ and UPRO calls for 62% retrace..
Any update from TRIN experts ? There was a mention of how TRIN was still reading as if buy the dip was going on last week. Any change after today ? Is it at oversold yet ?
Just a signal. Perhaps no need to but I do.
A part of this week:
The Low on Thursday lookslike a deep low. That we have seen. But Now up all the way into the 17th!!! Watch out. The US opening to day could be difficult. I maen a mean LOW? On the 17th/18th starts the dicline again.
Be careful Willem
I am getting old
as confirmation you can watch the site http://www.prognoseus500.nl/
Times I have difficulties with the indicators because they stop the data.
But I have always a replacement after a week. But THIS WEEK WAS O.K.
Use the information as confirmation of youre own strategie. or from Peter
Hi Peter,
Peter, I purchased the Chart Show at 6pm so missed most of it and never received the replay link. Any chance of getting it? Thanks.
(Paid with PayPal using another email
Mike,
I just sent you a link about a half hour ago. Did you not get that? Let me know.
Yes, all is good. Thanks Peter!
SIR PETER..Now that we have the bottom of the C wave..any updated targets for Wave 5?
This move down is incomplete…
Charles,
Unfortunately, that’s proprietary info I provide in the Chart Show and for my subscribers. But I’ll have a blog update on the weekend.
Willem, you really do need to tweak those indicators …lol!
I think no body has nailed this move correctly, everyone was expecting a further rise and then C wave selloff…now we need to see this 62 percent retrace holds true or not. If not its really impossible to predict
Impossible for you, perhaps.
Well Bill, I generally don’t like it when people try to brag about calling exact tops or bottoms, but you are forcing 🙂 me to do so with your “nobody has nailed this move correctly” comment. I am not a frequent poster here but try to post when I deem something important as I did on September 20. Here is a quote from the post I made here on that exact all-time high closing price day of the SPX:
Peter G September 20, 2018, 2:22 pm
“Today, for the first time in a long, long time both DJIA and SPX closed at new all-time highs accompanied by a distinct negative divergence on the NY daily a-d line. That in itself doesn’t turn markets around but there were also a huge number of consecutive Hindenberg Omens (another today) coupled with the fact that today’s new all-time highs were accompanied by a negative reading (-2.6) on the Ratio Adjusted McClellan Oscillator. That’s only happened on 4 previous days in the past 22+ years…7-19-07, 11-13 and 14-2013, 9-18-2014… Going back in time, it also occurred at the very major top on 1-11-73. The next dip might be one that will bite the BTDers. Don’t know what today does to wave counts but in many ways it qualifies as a potential major top!! ”
I’m not sure if that qualifies as “nailing” it in your book but, if not, please show me other quotes that called a turn to the ecact day. Again, I dislike market braggarts because you never know about the hundred bad calls they made. God knows if September 20 will be a major high. As I stated on that day, it qualifies for that. We have a long way to go before it proves to be true or not. In any event I feel justified in bringing it up at this point.
While we are at it, someone on the blog asked for a TRIN interpretation. I have worked with TRIN for almost 50 years. It used to be one of my favorite indicators but its personality has changed over the past decade or two. Today’s 10 D MA of TRIN is an amazing .85 (I use WSJ numbers as my official ones so others’ numbers may differ slightly from mine because of different data sources). It is a number more closely associated with market tops than bottoms and I made a similar comment several days ago before the large decline began. Amazingly, despite a decline of over 5% in 2 days, there are no TRIN readings that qualify as anything but the shortest of short term bottoms. That’s my sentiment for what it’s worth…
The current high in the SP500 was September 21, so Andy Pancholi nailed it right on the day, as a cycle turn.
In any case, it’s a turn. We certainly haven’t seen the high.
He also nailed yesterday’s turn date …lol.
Closing high was exactly Sep 20, Peter, as I stated. I am not privvy to Pancholi’s work. Kindly refer me to a quote on that intra-day high day the next day where he called it a top. I love and greatly respect your work, by the way, but I would caution anyone from using the word “certainly” when it comes to markets…
Peter G…you are a voice of reason…S&P 500 all time closing high on September 20 at 2930.75…S&P 500 all time high on September 21 at 2940.91…https://finance.yahoo.com/quote/%5EGSPC/history?p=%5EGSPC
Peter T…Andy Pancholi issues a monthly report, sends out emails and videos…he co-authored a book with Harry Dent…this public blog is replete with Pancholi’s market calls during the last few years…kudo’s to him for nailing a couple of turn dates…how has Pancholi done with the BIG picture?
I don’t know what you mean by the “big picture.” Are some turn dates bigger picture than others? I don’t follow his other work with Harry Dent. I don’t cover it here.
Peter,
The blog post is about ES and the high for it was the 21st. His three most recent turn dates were all accurate to the day. I don’t have time to go back further. Sept 21, 26 and Oct. 18.
I will use the term “certainly” when the prognosis is “certain.” Caution me all you want, but I think I know what I’m doing. And I taught grammar internationally for 3 years. So, thanks for the lecture. I’ll ignore it.
Points well taken Peter G and it is indeed exactly the way you stated. I read that post with great interest as it was consistent with my own very bearish outlook.
Today’s price action looks a lot to me like a fourth wave triangle. The price ranges of the whipsaw speaks volumes. I don’t think I have ever seen DJIA price make 300 plus round trips MORE THAN ONCE! That is absolutely remarkable, and in my view quite ominous so I expect a commodity like fifth wave down to complete the current decline.
It seems to me that until this decline is done, and we see the size and nature of the retrace of this move down, no one can definitively say what is going to unfold a few months out. Of once thing I am certain, and that is Mr. Market will make it abundantly clear by the ensuing price action. As always, I trade what I SEE!
Well Mr BIll, I may not have “called it”, but I sure as hell traded it! And that is really all that counts.
Even a blind trader could see all those bearish rising wedges in so many indices and once they broke the lower boundary, there was absolutely no need for anyone to “call” anything.
While I will admit to not having clarity about the precise wave count, I believe my comments on the forum made it quite clear that I for one was bearish!! I am not sure what the carping on your part is all about, as we are all here to hopefully make some kind of contribution to each other’s trading success. What may I ask, do you have to offer? 🙂
Thanks, rotrot, for the “voice of reason” moniker. Here is my further comment in relation to Peter T’s remarks concerning Pancholi’s “nailing it right on the day” and “he also nailed yesterday’s turn date.” If I’m wrong I stand to be corrected but my understanding is that Pancholi gives several cycle dates for each month. If you are telling me that the S&P all-time high on Sep 20 (close) or 21 (intra-day) was “nailed”by Pancholi, I am making the assumption that he had given that as a potential cycle date for September. Here is my question. Did he say ahead of time or on the day of the potential resolution that we were at an important high or was it just another of his September cycle dates? I hope you can distinguish that from my very specific call on September 20. How about yesterday, October 11. Was that another one of his several October dates? I’ve been around this business far too long to acknowledge a “call” of a top or bottom because a turning point landed on someone’s “one of several” cycle dates in a month. As I told Peter, I would love to see a Pancholi statement made on the day of the top or before that he was expecting a top on that day (and why). That’s all. If it just happened to fall on one of his “turning point dates,” I would consider it pretty good but far from the definitive statement I made on the very date of the closing high. I am mad at myself for being so defensive here, but very specifically calling market turns in real time are remarkable accomplishments and not to be compared with someone’s generic dates for possible turns. I guess that’s all I am saying.
Peter G…I have not seen Pancholi’s Monthly Timing Report for September…having said that, I have purchased Pancholi’s Reports in the past…in the Report Pancholi identifies S&P 500 “Key turning point dates derived from PFO Histograms”…Pancholi does not forecast the polarity (high or low)…
For a long time Pancholi forecast a major turn in the October 2017 time frame…on September 13, 2017 he sent a “MAJOR ALERT” email in which he wrote, “Opportunity Of A Lifetime – The Cycle Is In!! Whether you subscribe to The Market timing Report or not, I want to alert you to the biggest cycle set that I have seen in over 30 years. We are now in a major window for a potential trend change”…was he correct?
When he gets away from cycle turns, I ignore it. Cycle turns don’t give market direction. When he thinks they do, I think he’s beyond his pay grade. I don’t give much weight to Dent’s work, either. It tends to be a small part of the bigger picture. In that respect, it’s fine, but population and the like do not determine much of anything with any certainty or accuracy in the shorter term, in my experience (of course, I’m writing a book on it, so maybe I’m biased … lol).
I provide the turn dates in the Chart Show (for the US equities). His turn dates are provided at the beginning of the month for the entire month. All his calls for the month of September were turn dates to the day. I cannot provide the full report, as it’s proprietary info. The dates were Sept. 11, 18, 21, and 26. For October, the only date I can share (as it has already passed, was Oct. 11).
There’s a new free blog post live at: https://worldcyclesinstitute.com/the-market-it-aint-over-til-its-over/
This website is for educational purposes relating to Elliott Wave, natural cycles, and the Quantum Revolution (Great Awakening). I welcome questions or comments about any of these subjects. Due to a heavy schedule, I may not have the time to answer questions that relate to my area of expertise.
I reserve the right to remove any comment that is deemed negative, is unhelpful, or off-topic. Such comments may be removed.
Want to comment? You need to be logged in to comment. You can register here.