
 Not Much Left to Say

I’m expecting an imminent downturn in the US indices, and just about everywhere else.
The small fourth wave from the week before last took 5 days to the downside. I predicted that the fifth wave up would take a similar amount of time, projecting a top either this past Friday or that it could last into Monday. Here we are.
Look for a turn down very early in the week (if we haven’t topped already).
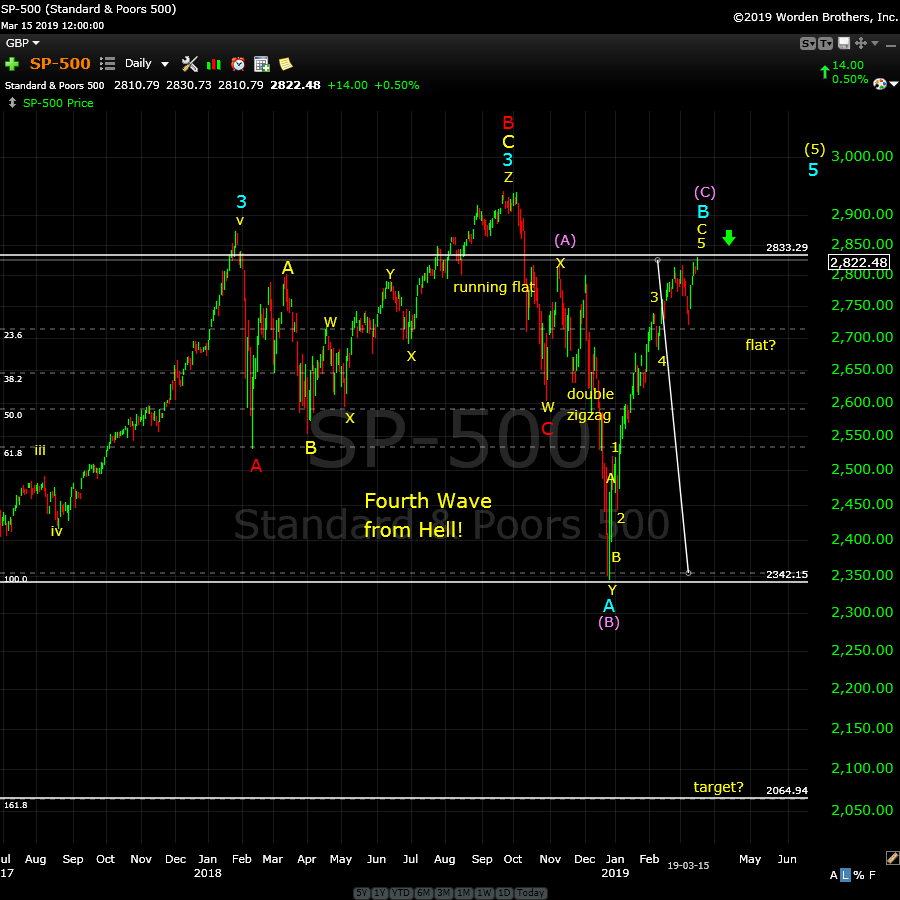
Above is the daily chart of the SP500. (click to expand)
I’ve labelled a possible flat in progress, showing a purple circle A, B, and C label on the chart. The C wave target is shown at 1.618 X the purple (A) wave, but the guideline is that the C wave can extend to 165% of the A wave.
The pattern to the downside can also be a set of zigzags. Less probably options are a triangle, or an ending diagonal.
The count on the upside is complete. Currency pairs are been oscillating up and down for weeks, as has oil. The US Dollar Index has retraced 62% of the previous wave to the upside and is ready for a turn up.
Everything is lined up (or almost lined up) for a turn. It’s now up to the market to follow through.
_____________________________
Elliott Wave Basics
Here is a page dedicated to a relatively basic description of the Elliott Wave Principle. You’ll also find a link to the book by Bob Prechter and A. J. Frost.
____________________________
Registration for Commenting
Want to comment? You need to be logged in to comment. You can register here.
If you register, it protects your information. It also allows you to comment without filling in your information each time. Once you’re registered, simply go to the home page and click on the login link top right in order to log yourself in. Usually, you’ll be logged in for several days before needing to be logged in again.
______________________________
Problem receiving blog comment emails? Try whitelisting the address. More info.
______________________________
Get an upper hand … JC 2
Get an upper hand in trading …Seeing all the different currency pairs and the wave structures and hearing you explain why this has to do that on a nightly bases gives one a upper hand when trading. Elliott Wave applies to all stock and indices and can be applied to any candlestick chart. If someone ask what you want for Christmas – Tell them a membership to Peter’s “Traders Gold!”—JC |
A true expert in Elliott Wave FL 2
A true expert in Elliott Wave …You are a true expert in EW analysis. What you provide is not available anywhere and is priceless. Subscription on your services is the best thing I have ever done. Many thanks for your effort to make me a better investor. I now have more trust in my investment decisions. I hope you will continue the excellent work! —FL |
the real deal SM 2
The real deal …‘Educational, insightful and thorough market analysis for all levels of traders. It’s Elliott Wave at its best….Peter Temple is the real deal’ —SM |
Couldn’t be happier … KK 2
Couldn’t be happier …The analysis and insight you provide is simply amazing! I’ve been trading the futures and equity markets for well over thirty years and usually average around 5% monthly. Since joining your Traders Gold Service two months ago, that number has better than doubled. I couldn’t be happier.—KK |
The best of them JL 2
The best of them …Last couple of years, I subscribed to several ‘market traders’. You are by far the best of them and the personal contact is awesome. Daily and daily updates are very well written! Besides your expertise in EW, I also like your cycles analysis. Best investment I ever made! —JL |
Rise above the rest … SM 2
Rise above the rest …I have only ever met a few people who, in their chosen fields (astrology, medicine, music, martial arts, technical analysis), rise above all the rest and you are one of them…you have ‘the gift’…and that’s why I’m a Trader’s Gold member. —SM |
Tops in your field DZ 2
Tops in your field …You are tops in your field. Tried to follow Elliot Wave international for years. They were always behind the market. After discovering you, I perceive that you are an expert in reading the waves, which puts you way ahead of the rest of your peers. And you can read the Waves like you are reading tomorrow’s financial section. I pray you stay healthy. —DZ |
Have not had a losing week RW 2
Have not had a losing week …I have been with Peter almost a year. The only thing that matters is have I made money with his service. I think I have finally turned the corner using Peter’s EW. I have not had a losing week in the last 5 months. Thanks Peter, for your amazing amount of hard work. —RW |
US Market Snapshot (based on end-of-week wave structure)
Here's the latest daily chart of ES (emini futures)
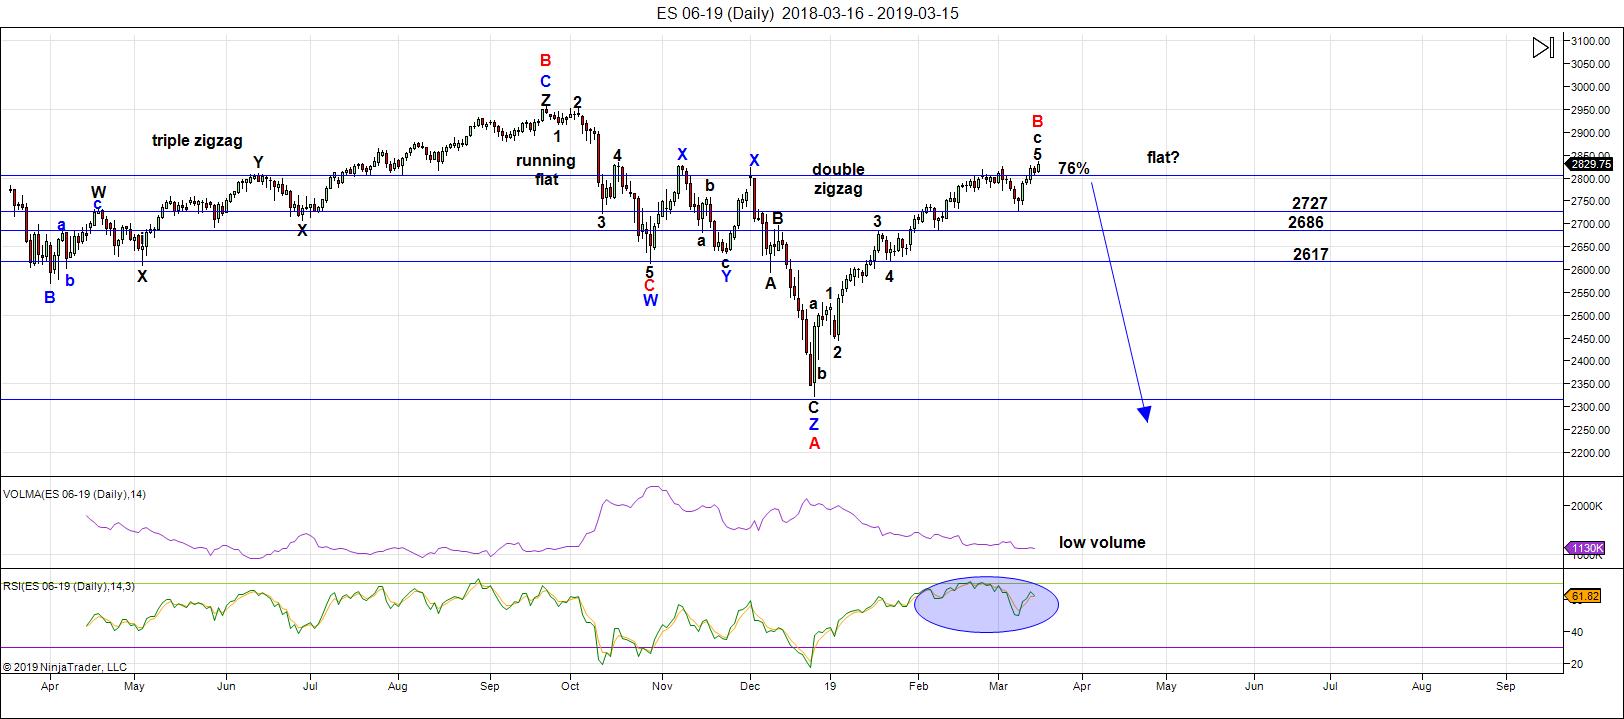
Above is the daily chart of ES (click to enlarge, as with any of my charts).
We're still sitting near the top of a B wave that's risen to about the 76% level of the height of the previous set of waves down from the all-time high at October 3, 2018. Almost all the other assets I cover on a daily basis are hovering at inflection points. The "greed factor" is elevated as we've all but finished a small 5th wave up to a new high at about 2836.
The next major move is to the downside.
After a fourth wave down last week, this week, we tracked a small fifth wave to a new high. I'm unsure of the short term direction (whether we have one more slight high to go) but other than that, this corrective pattern up is done.
As I've been saying, the wave up from Dec. 26 is clearly corrective and, as a result, must fully retrace. This is supported by the US Dollar Index, the major USD currency pairs, WTI Oil, along with DAX and other international exchanges.
Summary: My preference is for a dramatic drop in a C wave to a new low that should begin this week. The culmination of this drop should mark the bottom of large fourth wave in progress since January 29, 2018 - over a full year of Hell. It may be a dramatic drop that lasts multiple months, and will target the previous fourth wave area somewhere under 2100.
Once we've completed the fourth wave down, we'll have a long climb to a final new high in a fifth wave.
___________________________
Trader's Gold Subscribers get a comprehensive view of the market, including hourly (and even smaller timeframes, when appropriate) on a daily basis. They also receive updates through the comments area. I provide only the daily timeframe for the free blog, as a "snapshot" of where the market currently trades and the next move on a weekly basis.
______________________________________
Sign up for: The Chart Show
Next Date: Wednesday, March 27 at 5:00 pm EST (US market time)

The Chart Show is a one hour webinar in which Peter Temple provides the Elliott Wave analysis in real time for the US market, gold, silver, oil, major USD currency pairs, and more. You won't find a more accurate or comprehensive market prediction anywhere for this price.
Get caught up on the market from an Elliott Wave perspective. There’ll be a Q&A session during and at the end of the webinar and the possibility (depending on time) of taking requests.
For more information and to sign up, click here.
| "I think you are the only Elliot Wave technician on the planet who knows what he's doing.” |
| m.d. (professional trader) |
All registrants will receive the video playback of the webinar, so even if you miss it, you’ll be sent the full video replay within about an hour of its conclusion.


Open order to buy 283 strike puts to close at 0.20 or better for just under zero cost basis for long position 281 strike puts….waiting for fill…
VIX holding above low…looking for initial pop to tell the tale…
Bought back 283 strike puts for 0.22
Waiting….
Those 281 puts just might expire worthless tomorrow but no biggie.
If we continue ramp to the upside I just use ’em to anchor a 3 or four point bull put credit spread and stalk the bull run. Then again, they could end up being lottery tickets! 🙂
Yet another spinning top, just as we saw yesterday. Of course we hopefully have by now learned to take all such indicators with a nice fat grain of you-know-what.
This is what the banksters do people. You almost have to expect it these days or they will run you over trying to trade the short side on such signals…
At what point does this count become invalid?
Depends on which count u go with..imma trading this as a bullish cycle..3rd or 5th wave..so my stops are at 50 sma & 200 sma.. to me lookin like some sorta 3rd or 5th wave..SIR PETER has this as a 4th.. Ive never seen a bullish 4th wave like this..he is the KING of EW! Imma thinkin he might have to revise count at some point if market gets to new all time high?
Currently hit 86% retrace of wave down from 2940 to 2346 on SPX.. 2880 is where the 90% retrace is.. thats fib area ive been watchin.
Now, you’re putting words in my mouth! The wave up is a fourth wave? Gimme a break.
This is the reason I spend no time in the free blog and why I’m thinking of ending the comments section. So much BS.
“I’m thinking of ending the comments section. So much BS.”
please do…it can’t happen soon enough!
So much noise. As a trader, noise is absolutely deadly, so I don’t “get it.” But what really gets my back up is the desire of some people to post erroneous information about Elliott Wave. If you want to make me absolutely crazy, just do that. So the comments section at the moment, is totally counter-productive, imho.
I’ll think about it some more over the weekend.
Fully agree Peter. I suggest you limit conversation purely to EW on the free comment section and get rid of the pirates. Whilst I don’t add much EW myself I’m basically following your count. Whilst some of the other stuff posted here is actually interesting it makes it hard to really follow what you made this site for. If people keep abusing it I believe it’s time to end the free comments. I get most value from your update at the top and very little from the comments tbh.
For someone..that doesnt get much from the comments u sure spend a LOT of time commenting..
Tho..I do agree with u that ur comments dont add ANY value!
I will freely admit I have absolutely no expertise with EW theory despite my best efforts. I think it takes quite a bit of skill to use the wave counts to execute real time trades if you are an active trader, and I am well aware of my own limitations in that regard. My approach the last several weeks has simply been to pay attention to what price levels the banksters are defending and trade accordingly, and DJIA 25,700.00 and SPX 2800.00 have clearly been aggressively bought each time price approaches those levels. I maintain that as long as price remains above them shorting the market will probably be a loosing trade unless such trades are executed with precision. Just my two cents… 🙂
U & me Mr Verne..two peas in a pod. Imma using the 50 and 200 smas in a similar fashion. Til those break..up..up..& away!
Hard to be bearish when the generals, AMZN and NFLX, are leading. I think a pullback is right around the corner.
AMZN
5/23/18 L to 6/6/18 H = 10 TDs
6/8/2018 L to 6/21/18 H = 10 TDs
7/5/18 L to 7/18/18 H = 10 TDs
8/22/18 L to 9/4/18 ATH = 9 TDs
3/8/18 L to 3/21/18 = 10 TDs
NFLX
wk of 12/4/17 L to wk of 3/12/18 high = 15 weeks
wk of 4/2/18 to 6/18/18 ATH = 12 weeks
+ 3 more weeks to retest ATH for a total of 15 wks
wk of 12/24/18 low to this week = 13 weeks
https://worldcyclesinstitute.com/my-dawdling-ducks/comment-page-1/#comment-36846
there is a difference between sharing ideas and the need to incessantly call attention to oneself…the harm to this public blog by self serving, egotistical posters was forecast more than two years ago during back channel discussions (email)…”Xxxxx is a jerk”…”always trying to demonstrate his intellect”…”subtly putting others down”…”compelled to demonstrate he is smarter than anyone else”
https://worldcyclesinstitute.com/coming-to-terms-with-the-dip/comment-page-3/#comment-33094
https://tinyurl.com/yxbwwrbx
Uh Oh…! Did someone forget to take their meds today?
Will the “Golden Cross” hold?!
Peter..the blog is good..if it a good social network..just an idea..for people that do follow your videos or a member maybe a separate blog..so for example members of WEC have a separate site so they can post or maybe on SLACK..I think this is about Elliot Wave but it is also about cycles and patterns..I am just learning a lot about the cycles..especially about astro.I know Elliot Wave pretty well but use your videos to keep me on track and not be myopic…Just my thoughts. But reading some of the posts have expanded my thoughts …
Maybe its best to just leave this week update as the blog for all the other stuff and ban comments on all future blogs. That way you can all carry on commenting here and Peter and those who want to read only Peters stuff can see his post without all the other noise.
281 puts EXPLODED!
This is nuts!
Selling half for 0.30, up 300%!!!
I was short at open..on drop below 10 & 20 sma..
Rolling 281 strike puts expiring today out to 275 strike puts, March 27 expiration, net zero cost basis…
Charles has dissappeared thanks to the big drop today. He lost his entire year of buy the dip profits lolololololol. Peter’s scenario is now playing out. Buy the dip is dead and so is charles dumbass strategy. Good riddance
Trolls like u dont belong on this site.. if u actually took time to get off you lazy a** insread of collecting ur welfare check..u might do a little fact checking to see my approach is brilliant! But your bird brain doesnt comprehend how to read a chart.
OK, that’s enough for me. Moderation it is, then.
Charles is wrong with his wave count but in fairness to him I doubt he’s losing money. If I remember correctly, he has cut his swing long positions to 25% and has a stop to it. I think his cost basis was around spx 2700 so a long way from where spx is now.
He is doing intra-day trading to scalp but so far btd mentality has worked since 12/24-26 lows.
Yeh..was short @ open..in 2840 puts..
Haha nice hindsight trade.
Check time & sales..
Here is my buy..
https://ibb.co/s5Y9XwW
sold 1/4 in 3 lots above 2800..from 2620 avg entry.. day trades can go either way based on where indicators & spx is..in comparison to 10 & 20 sma
That was my interpretation of what he did. Not sure if his strategy will work in a bear market?
Thank u Bernie..yes exactly..spot on!
I am leaving. Way too much hostility here.
Bye all, and best of luck trading to everyone!
All the best Verne. You will have great success.
I think u scared him off Q
Charles, if you can’t see that the “salt” was you and Qwerty, then you have issues.
I jus come on here..to review EW counts..& share trade ideas..then some1 startin attackin me so..yeh i playd a part but certainly didnt start the salty environment..
I can’t reply to your last message, but you are right. Qwerty started it. It is ok to be skeptical, but we can be nice about it. The trading community it rough enough as it is.
Thanks and God bless Q.
Hope the stratgies outlined on spread trading were helpful.
It took me many years of miserable failure to develop a successful trading strategy that can be executed with reduced risk and I wanted to share it freely with other traders trying to navigate what is admittedly a very difficult and frustrating market. Thanks again to Peter T for allowing us to express our views even when we were possibly incorrect in our viewpoint. I will always depend on his able analysis for my long term market trading strategy. Take care.
BPCOMPQ…unable to update chart at this time…CIT signaled this morning…
https://twitter.com/allerotrot/status/1108844479254024192
Unable to view your post since you have me blocked for some reason.
Peter,
Im still enjoying this site and your EW very much, it is so helpfull also the blog.
I want to ask the writers to be respectfull and to let go the negative talk about each other so that we can continue with this blog.
Tom, I like your energy charts very much and I m looking forward to your next one.
For next week I have to astro points March 25/26, If we close down this week, I think we will go up next week.
It is also the green moonperiod (lunatic Trader).
All the best folks.
John.
I think what we need is a filter so individuals can filter out what they consider noise.
I see SIR PETERS count playin out! Looking like my alternate count is losing some steam! Top looks to be imminent..if not already in..Hail da EW King..SIR PETER!
The other day I posted that I thought may 28 would be a better entry .
That was a typo , I meant march 28 .
That said I was dead wrong .
The Feb. 25 high in the dow stands .
Admitting when one is wrong in my opinion is important .
I have been wrong .
March 28 though still matters to me on a short term basis .
May 26-27 into june 3 should be an important cycle low .
mid April most likely another important low .
Presently the indicators I’m looking at are mixed at best .
None showing any extremes .
For those noticing negative talk , I think we should all take note of it from time to time and see if there is any correlation to the market .
Something I tend to notice at times is the lottery . Im not a big lotto ticket buyer
yet I find it another interesting indicator in terms of animal spirits .
One thing ill note though is the lotto numbers have changed .
example : it used to be 1 dollar for a ticket and you got 2 sets of numbers .
( correct me if im wrong )
then they doubled the price to 2 dollars .
so now it takes 1/2 as many buyers to get to the old highs in terms of potential winning dollar amount yet those old highs are not being reached .
now though you pay 2 bucks and only get 1 set of numbers .
Are lotto Ticket sales falling ???? I tend to think so but cannot back it up and im not really all that interested in doing the research .
My guess though is that people are generally losing interest in the lotto .
I like this blog and find the people here generally positive yet lets not
ruin it .
I appreciate Peter T allowing us all to communicate and I hope that he continues this even though I have no doubt the admin portion of this site would be much easier without a message board .
I use this message board to post my own thoughts from time to time and it helps me keep track of my own notes at times .
As I move forward and dial in my own timing through out the year I will eventually have most of what I do automated to some degree .
They say there is a statistic in regards to lunar eclipses where more people than normal check themselves into mental institutions.
Maybe this full moon is causing a bit of this same type action along with mercury being retrograde .
I do not know if this is the case but if so then its about to change .
March 28 mercury goes direct and id normally say its a bullish signal .
At this point I have my doubts .
I am now seeing projections towards the cash dow Jan 22 Lows .
While I wont talk Elliott wave counts, The jan 22 lows to me are important.
Have a great weekend everyone
I always find it strange how the Dates tend to line up
“12 April is the new 29 March,” announced one Brussels official, although it’s not quite as straightforward as that.
EU leaders have essentially granted the UK a no-strings-attached short Brexit delay until 12 April.
By 12 April either Theresa May’s Brexit deal has to have been passed by the House of Commons – in which case the UK would have until 22 May to ratify it – or she must inform the EU of alternative plans.
https://www.bbc.com/news/world-europe-47663212
Only chart I’m going to post for a while .
It may not be a perfect match yet time wise things line up ( generally at this point)
its a dow weekly chart .
Peter G
You may find this more than a little interesting
Food for thought at the very least .
https://imgur.com/wcMgVft
Chart above to be Rescaled later.
That was a rough scale done in Dec 2018 .
I leave my scales as is until actual data shows me the real support and resistance levels .
My weekly indicators are neutral , daily chart indicators have more downside action available .
I’ve found this blog to be very educational. I appreciate the foundation of Peter T’s weekly analysis of the EW and the intention to lay out the big picture in social and economic cycles. For me the best of the blog posts are those which build on the EW foundation by explaining their specific combinations of indicators, or market moving factors, which they add to the EW analysis, and use to fine tune their trading entries and exits.
I think the enthusiastic posts made by some, when their methods are making a profit, may unintentionally upset others who may be struggling to trade profitably. I’d say to the latter group, be encouraged and take the opportunity to learn and test whatever trade methods others promote. Mastering one’s emotions is a critical skill in trading the markets, and there’s no financial or nutritional benefit in chewing on each other.)
Thank u for ur kind & thoughtful words..
I agree with u..many knock my approach..yet if they were to actually look at whut ive laid out..they could make a fortune..even with a few thousand dollars..ive spent 25+ years..getting the right formula..& ive given the exact parameters i use to find winning trades..yet i get mocked on a constant basis..like Mr Verne..i may retire from postin. i love SIR PETERs work..but feel many on here view me more as a distraction..than helpful. So be it.. i know whut works!
My sincere apologies for adding noise to the blog. Last post too.
Dear Liz, in case you don’t post anymore, want to say a big thanks to you. You have offered a great eye here . Ever since I followed Valley into this site, Mr. Temple, Andre, Tom, Valley, and you have been of great help. Good karma will reward you all handsomely, I hope. Pardon me for not giving any input, but I would have if I had possessed any valuable ideas.
As for the noise, it was not a problem for me as I only saw what I needed to see. It is completely up to Mr. Temple as he is the Architect in this space. But I hope WCI stands.
Liz, if you don’t mind, please share your Twitter handle. Thank you.
Your posts have never been noise, Liz.
I have found this blog to be useful. Specially Joe and Peter G. Of course there is some noise, but I tend to ignore it or use it as a contrary indicator. Some of us are trying to forecast and trade the market over multiple weeks. To them, a 5 min or 10 min view means nothing. I tend to ignore long term view of traders who focus on short term trades (as that is not really their expertise). I am sure the short term traders ignore views of the long term forecasters as it’s not useful to them. There is no point getting personal about any claims. Ultimately, We are all in this to make money.
I think the first 10 seconds of this China Uncensored video indicates some bleak global developments: https://www.youtube.com/watch?v=RtfRoJ4fIc8
Harmonical dates are vibrational, The 1929 high came 3/9 (3), the 1932 low 8/7 (1) (one day too late), in 1942 4/28 (7), the 1966 high 2/9 (monday; 2/8 was the high;(4).
The 1982 low 8/12 (1,5), the 2000 high 3/24, the 2002 low 10/10, the 2015 high 5/20, the august low 8/24. Shall I go on?
This week we see 3/24, 3/27 and 3/30.
3/24 very signifcant (will be a low). 3/25 will be a high and a low. Hence the low early monday morning. 3/26 high and low. 3/28 and 3/30 the strongest dates. So 3/29 (Friday) a significant high.
The tidal field peaks 3/24 (harmonical date) and is up into 3/28-29. Lunar altitude is down into 3/27 (harmonical date) and the up into 4/12 (harmonical date).
Next week bullish in general, but 3/27 will start a strong leg up (tidal field and altitude up). The tidal field is bearish into 4/5-6-ish. After that date both tidal field an altitude are up into 4/12-13.
This all within an uptrend into q3 2019.
3/24-25 change in trend.
Andre
The sun and moon are friends into 3/23. As of 3/24 they are enemies. Sme velocity up into 3/26 (high) and then down into 4/10 with a peak 4/1. as of 4/5 the sun and moon are friends again. See the tidal field timing (4/5 low).
Thanks Andre.
Well, I hope people will give it a second thought and keep posting here.
Tom,
Can you post your energy card for this week?
Thanks in advance
John.
It nailed yesterday, didn’t it?
Yeah, it happend exactly on time.
breath indicators cause me to believe the trend is now down…a number of posters have identified specific upcoming dates…here’s one to watch…if short going into Tuesday, April 2, it might be a good day to employ a trailing stop loss…if that works out, we will have a handle on the major swing dates for the next several months!
Seven Sentinels | March 23, 2019
http://youtu.be/tYsM3KydQtk
Thanks for the link!
A new free blog post is live: https://worldcyclesinstitute.com/cracks-are-showing/
This website is for educational purposes relating to Elliott Wave, natural cycles, and the Quantum Revolution (Great Awakening). I welcome questions or comments about any of these subjects. Due to a heavy schedule, I may not have the time to answer questions that relate to my area of expertise.
I reserve the right to remove any comment that is deemed negative, is unhelpful, or off-topic. Such comments may be removed.
Want to comment? You need to be logged in to comment. You can register here.