
 Fourth Waves and Combinations
I’m not a big fan of fourth waves. In fact, I intensely dislike them. There are a number of reasons for this:
- Relative to the trajectory of other waves, fourth waves go sideways for an extended period of time
- Because they’re the last wave before a trend reversal, there is reduced momentum, in fact, there tends to be a tug-o’-war between bulls and bears, making fourth waves difficult to trade
- Large fourth waves unfold as combinations (a series of up to three corrective patterns), which make them extremely difficult to predict
Fake-Outs
On top of that, the low volume in the overall market is creating “fake-outs” — waves that trace out structures that are ambiguous — the structure is such that they could go either way. It doesn’t happen a lot, which makes it even more unsettling when it does.
A case in point was the potential for a large wave down in ES/SPX that I identified in the Chart Show this past Wednesday. The wave down very late in the day Wednesday (on a one minute chart came down in what looked like a 5 wave first wave: After all, the subwaves measured perfectly.
Well, if you look very carefully at the wave, it did not actually do a double top. It missed my one tick on a one minute chart. And THAT little fake-out make it a wave down in three waves, which I didn’t catch until I looked at the same wave in NQ, which was very obviously down in 3 waves. I ended up issuing a RED FLAG warning for my Trader’s Gold group later than evening, but obviously wasn’t able to warn all the subscribers to the Chart Show, so I apologize for that situation.
The take-aways:
- It’s a very difficult market right now (and dangerous) and you have to exercise a high degree of caution
- Wait for the turns
- Don’t look at just one index. Make sure you looks at sister indexes (if they exist) to confirm or not your current projection. I always check NQ when making a final call or setting up a trade in ES.
Where are We Going? – A look at the downside in the SP500
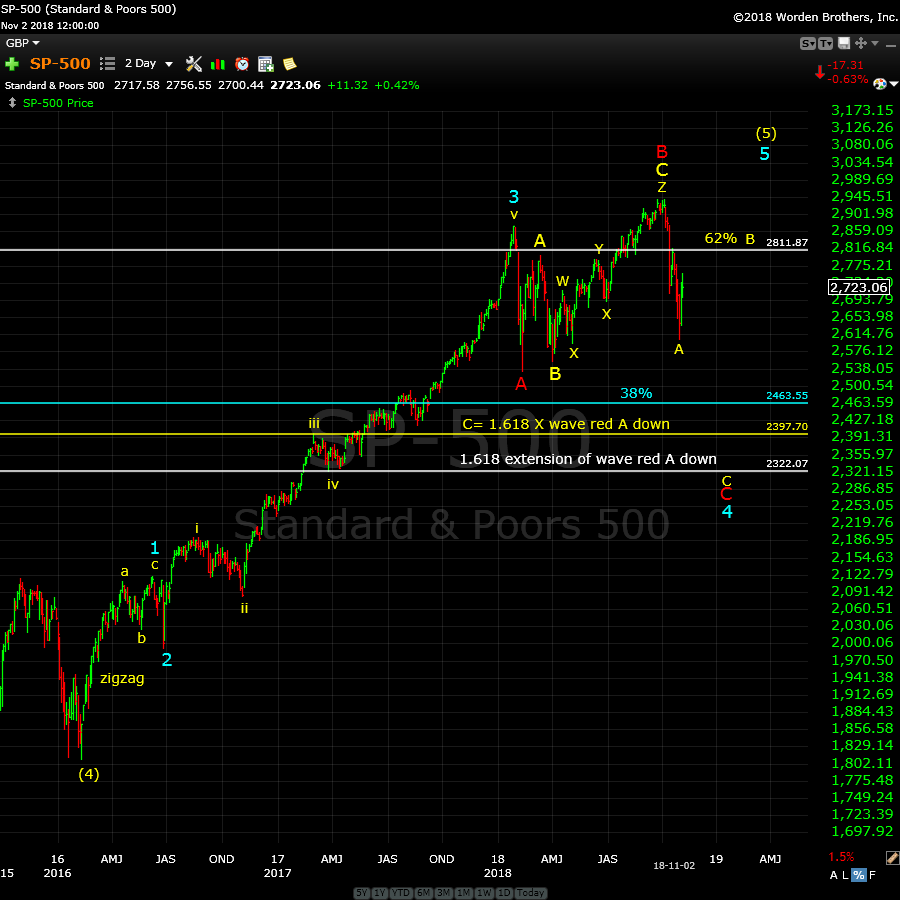
Above is the two day chart of the SP500 showing the entire fifth wave up to where we are now. Let’s look at possible targets for the bottom of this fourth wave.
Fourth waves must retrace at least to the 38% level (there could be an exception, as in the case of a running flat, but for the most part, that’s a rule — it actually falls under “guidance” because there are rare exceptions). That level is identified by the blue line on the above chart at ~2463.
Fibonacci measurements are usually highly accurate in situations like this and there are two obvious ones that might serve as a bottom. The 1.618 extension of the red A wave down targets the yellow line at ~2397.
The most likely downside target, imho, is the extension of the yellow A wave down (the C wave of the running flat we’ve just completed). That level is at the white horizontal line, at ~2322. Why this seems most likely to me is that it’s also exactly at the previous fourth wave level. It would also get our little amygdala glands all fired up!
So, I’m expecting a zigzag as the final C wave, or at least the next pattern to the downside. You’re allowed up to three corrective pattern as part of a combination pattern (prevalent in large fourth waves) and so there could even be one more pattern to the downside after the zigzag I’m expecting.
I’d also expect a sharp and deep fourth wave overall, because of the generally sideways motion of the large second wave in October 2016. That’s the Elliott Wave “rule of alternation” that states that if the second wave of the preceding pattern is a shallow, expect the fourth wave to be deep, and vice versa.
Where’s the Fear?
Keep in mind, that we haven’t seen any real fear, and I believe that will be the real mark of a complete fourth wave. So all of this supports a lot more downside after the current three wave rally, which I predicted last week.
This is a combination pattern unfolding, as is typical of a very large, high degree fourth wave. We’ve completed an expanded flat. The next pattern can either be a zigzag, a triangle, or an ending diagonal. I would expect it will be a zigzag. There could be another pattern (a third pattern) after the zigzag (you cannot have more than three patterns in a combination pattern).
We need this fourth wave to stir up the underlying fear that’s out there and have it manifested in articles and headlines in the mainstream press. Only then will we see a fifth wave to a new high. So this factor also tells me we have more work to do on the downside before we can contemplate a final rise to end this 500 year rally.
_______________________________
Elliott Wave Basics
There are two types of Elliott wave patterns:
- Motive (or impulsive waves) which are “trend” waves.
- Corrective waves, which are “counter trend” waves.
Motive waves contain five distinct waves that move the market forward in a trend. Counter trend waves are in 3 waves and simply correct the trend.
All these patterns move at what we call multiple degrees of trend (in other words, the market is fractal, meaning there are smaller series of waves that move in the same patterns within the larger patterns). The keys to analyzing Elliott waves is being able to recognize the patterns and the “degree” of trend (or countertrend) that you’re working within.
Impulsive (motive) waves move in very distinct and reliable patterns of five waves. Subwaves of motive waves measure out to specific lengths (fibonacci ratios) very accurately. Motive waves are the easiest waves to trade. You find them in a trending market.
Waves 1, 3, and 5 of a motive wave pattern each contain 5 impulsive subwaves. Waves 2 and 4 are countertrend waves and move in 3 waves.
Countertrend waves move in 3 waves and always retrace to their start eventually. Counrtertrend (corrective waves) are typically in patterns — for example, a triangle, flat, or zigzag. Waves within those patterns can be difficult to predict, but the patterns themselves are very predictable.
Fibonacci ratios run all through the market. They determine the lengths of waves and provide entry and exit points. These measurements are really accurate in trending markets, but more difficult to identify in corrective markets (we’ve been in a corrective market in all the asset classes I cover since 2009).
To use Elliott wave analysis accurately, you must be able to recognize the difference between a trend wave (motive) and a countertrend wave (corrective). There’s very much more to proper Elliott wave analysis, but this gives you the basics.
____________________________
Registration for Commenting
Want to comment? You need to be logged in to comment. You can register here.
If you register, it protects your information. It also allows you to comment without filling in your information each time. Once you’re registered, simply go to the home page and click on the login link top right in order to log yourself in. Usually, you’ll be logged in for several days before needing to be logged in again.
______________________________
Problem receiving blog comment emails? Try whitelisting the address. More info.
______________________________
Tops in your field DZ 2
Tops in your field …You are tops in your field. Tried to follow Elliot Wave international for years. They were always behind the market. After discovering you, I perceive that you are an expert in reading the waves, which puts you way ahead of the rest of your peers. And you can read the Waves like you are reading tomorrow’s financial section. I pray you stay healthy. —DZ |
A true expert in Elliott Wave FL 2
A true expert in Elliott Wave …You are a true expert in EW analysis. What you provide is not available anywhere and is priceless. Subscription on your services is the best thing I have ever done. Many thanks for your effort to make me a better investor. I now have more trust in my investment decisions. I hope you will continue the excellent work! —FL |
Have not had a losing week RW 2
Have not had a losing week …I have been with Peter almost a year. The only thing that matters is have I made money with his service. I think I have finally turned the corner using Peter’s EW. I have not had a losing week in the last 5 months. Thanks Peter, for your amazing amount of hard work. —RW |
Get an upper hand … JC 2
Get an upper hand in trading …Seeing all the different currency pairs and the wave structures and hearing you explain why this has to do that on a nightly bases gives one a upper hand when trading. Elliott Wave applies to all stock and indices and can be applied to any candlestick chart. If someone ask what you want for Christmas – Tell them a membership to Peter’s “Traders Gold!”—JC |
The best of them JL 2
The best of them …Last couple of years, I subscribed to several ‘market traders’. You are by far the best of them and the personal contact is awesome. Daily and daily updates are very well written! Besides your expertise in EW, I also like your cycles analysis. Best investment I ever made! —JL |
the real deal SM 2
The real deal …‘Educational, insightful and thorough market analysis for all levels of traders. It’s Elliott Wave at its best….Peter Temple is the real deal’ —SM |
Couldn’t be happier … KK 2
Couldn’t be happier …The analysis and insight you provide is simply amazing! I’ve been trading the futures and equity markets for well over thirty years and usually average around 5% monthly. Since joining your Traders Gold Service two months ago, that number has better than doubled. I couldn’t be happier.—KK |
Rise above the rest … SM 2
Rise above the rest …I have only ever met a few people who, in their chosen fields (astrology, medicine, music, martial arts, technical analysis), rise above all the rest and you are one of them…you have ‘the gift’…and that’s why I’m a Trader’s Gold member. —SM |
The Market This Week
Here's the latest daily chart of ES (emini futures)
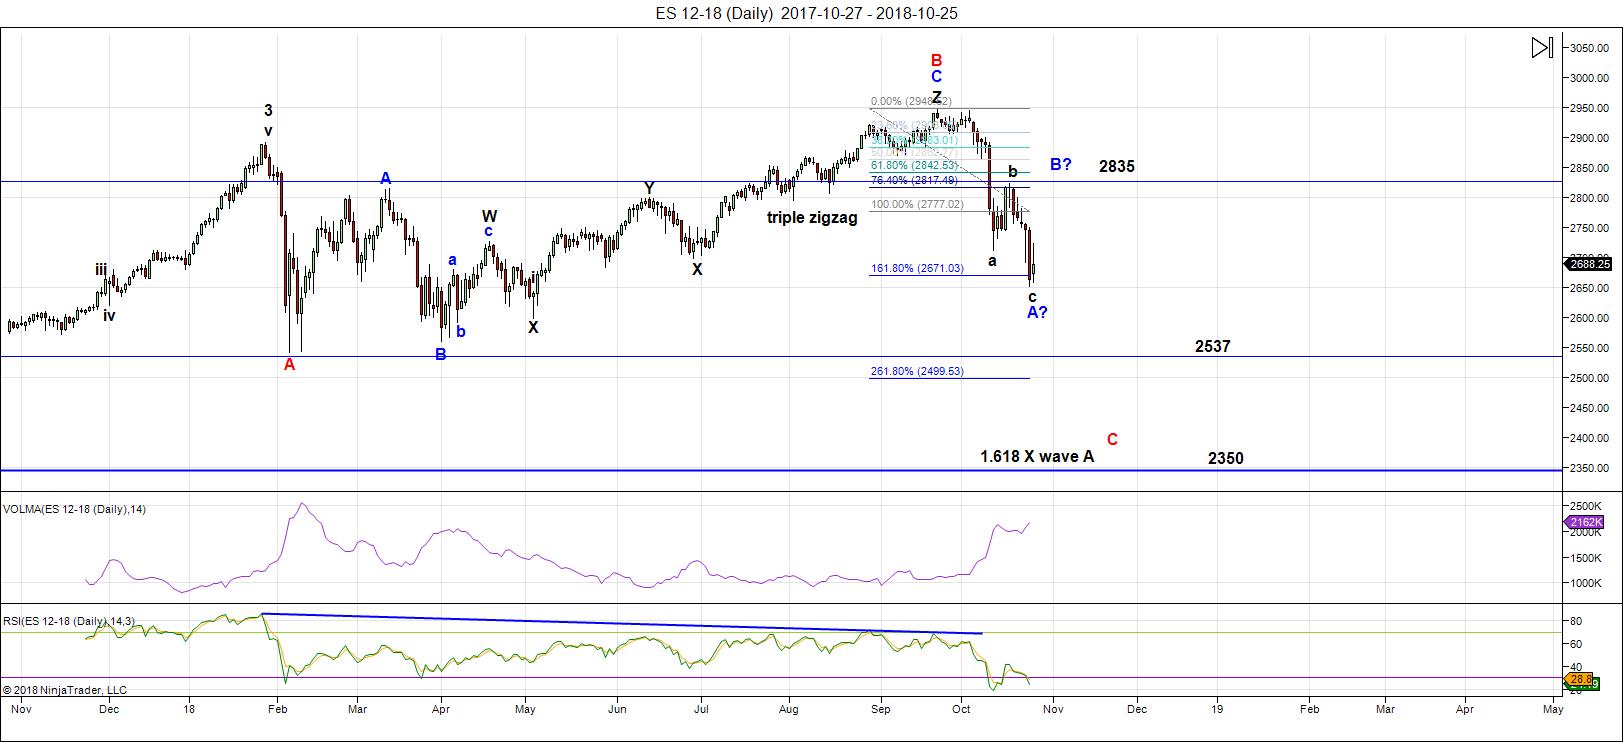
Above is the daily chart of ES (click to enlarge, as with any of my charts).
We have a relief rally in progress through at least the first part of next week. We have the US election on Tuesday, and there's also a Fed at meeting on Wednesday/Thursday but it doesn't look like there'll be a typical 2pm announcement.
I'm calling the pattern down from 2940 the C wave of an running flat, the expected alternative to an expanded flat (since the C wave did not extend to a new low below the A wave), although the wave down isn't the nicest example of a five-waver. It has reached the minimum length for a flat C wave (100% of the length of the A wave down from Jan. 29).
Fourth waves of this size usually trace out combination patterns, so I've been expecting another pattern (after a rally) to put an end to this fourth wave.
On Friday, we finished the A wave (in 5 waves) of a corrective rally and then dropped into a B wave, which likely needs a double bottom before turning back up (it's not currently an obvious three wave corrective pattern).
I'm expecting another 5 wave move up to at least the 62% retrace level, and then a turn down and a drop to a new low. That big drop will probably be in a zigzag format and will end the C leg of this large fourth wave we've been in since January 29 2018.
Summary: Expect a continuation of the current rally to at least the 62% retrace level and then another very large drop to a new low. The pattern is likely to be a zigzag, but could also be a triangle or ending diagonal. There could be one more pattern to follow that one.
Once the C wave (down) has bottomed, expect a final fifth wave to a new high. That fifth wave up to a new high will be the end of the 500 year bull market.
___________________________
Trader's Gold Subscribers get a comprehensive view of the market, including hourly (and even smaller timeframes, when appropriate) on a daily basis. They also receive updates through the comments area. I provide only the daily timeframe for the free blog, as a "snapshot" of where the market currently trades and the next move on a weekly basis.
______________________________________
Sign up for: The Chart Show
Next Date: Wednesday, November 14 at 5:00 pm EST (US market time)

The Chart Show is a one hour webinar in which Peter Temple provides the Elliott Wave analysis in real time for the US market, gold, silver, oil, major USD currency pairs, and more. You won't find a more accurate or comprehensive market prediction anywhere for this price.
Get caught up on the market from an Elliott Wave perspective. You’ll also get Andy Pancholi cycle turn dates for the SP500 for the balance of the current month. There’ll be a Q&A session during and at the end of the webinar and the possibility (depending on time) of taking requests.
| "I think you are the only Elliot Wave technician on the planet who knows what he's doing.” |
| m.d. (professional trader) |
All registrants will receive the video playback of the webinar, so even if you miss it, you’ll be sent the full video replay within about an hour of its conclusion.


Peter T
thanks for the update today .
The main points I get from your posts are these quotes :
This is a combination pattern unfolding, as is typical of a very large, high degree fourth wave. We’ve completed an expanded flat. The next pattern can either be a zigzag, a triangle, or an ending diagonal. I would expect it will be a zigzag. There could be another pattern (a third pattern) after the zigzag (you cannot have more than three patterns in a combination pattern).
Partial quote:
We need this fourth wave to stir up the underlying fear that’s out there and have it manifested in articles and headlines in the mainstream press. Only then will we see a fifth wave to a new high. So this factor also tells me we have more work to do.
I completely agree . I left out the rest or your last quote because I have to allow for a more complex wave .
while I might be proven completely wrong , my reasoning is my gut .
To me, Elliott wave theory is best used in hindsight so a ” gut feeling” really
has no merit . That said here it goes, Im beginning to think that the cash dow peaked in early oct in an X wave and not a B wave. If that is going to hold true
then we may be in a complex wave which would be labeled A B C X A B C D E
or to make it simple we are still in a complex Triangle formation which began at the January 2018 highs. I do realize that this complex structure really does not have much merit at this juncture but it still a pattern im considering .
The NYA would therefore have minor waves a b c ( A ) in place and considering the time it has taken to complete I find it doubtful that we will see wave B C D E
because it would take up way to much time .
Maybe , just maybe the NYA has completed wave 4 and will now be in the early stages of wave 5 to the upside . this current wave would then need to complete
a wave 1 impulse and a wave 2 decline as the dow and spx complete some other complex corrective wave ( ndx I have no opinion on right now )
I began this year with the expectation of the cash dow being in a year long sideways wave 4 triangle . the new highs in October have put a serious dent in my thoughts. So part of my analysis has been proven wrong yet the 3 wave movements into the oct highs I can only label as either a B wave as you have noted or an X wave of a more complex wave.
As we enter this next turn on Nov 7th and then come into mercury retrograde
we are entering a couple highly volatile cycles Normally id say this is straight up bearish . The problem though is having studied the mercury retrograde cycle as well as the mars Uranus cycle I can make the case of more complexity in the wave structure .
Bottom line: You have done a very good job of navigating this market .
You also have done an excellent job of teaching Elliott wave theory for those who actually read what you write.
Thank You for your blog as well as your time .
Joe
“Elliott wave theory is best used in hindsight” Well then, you don’t know much about Elliot wave. What would be the point of my work and this site (and the Elliott Wave Principle) if that were true? And I certainly wouldn’t be able to make money consistently in the market …
Peter T ,
IF i read correctly we go to 2700 and then to your target 2832/2840.
Did I read it correct, with so many ABC’s I get confused. Not sure you meant 2700 or go back to 2600 for double bottom.
“On Friday, we finished the A wave (in 5 waves) of a corrective rally and then dropped into a B wave, which likely needs a double bottom before turning back up” the B wave is what we experienced on Friday.
Thanks Peter T. Not an expert on this.
So as per you drop to 2650/2600 for double bottom and then go up to 2840. Any time line when we reach 2600/2650?
Hi Joe,
You do have a lot of insight, and yes Elliot Wave theory is a great hind site to see the past. However, it is an amazing tool to use to predict the future. It is tedious as we can see especially through Peters’s work. But what it does do as each tick goes forward gives you probabilities of what possible directions it is going forward. And with each tick and each leg it either confirms or negates.. I use it always as my tool for trading but it never stands alone ..always with your other indicators..it does tell you the direction that things are going or where is a good place to just sit and pause..like it told me to pull out all longs last year ..and mostly day trade this year..
A lot of us got fooled by the price action last Wednesday. I also thought the shooting star and low volume meant we would see a decline Thursday but instead the market rocketed higher ambushing a lot of bearish positions. In hindsight, it appears to have been only the initial smaller a of A wave up of an abc upwards correction for a B or second wave, and that the manic rise we saw on Thursday was the smaller c wave up to compete the larger A wave. I think we should expect a B wave down next, followed by a final C up to complete this upward correction. At least that is the way I am trading it. Some folk are thinking this is going to take weeks but I do not. I expect we will see that final wave move back above 2800 before the week is over after we put in an intra-day B wave low around 2650 or thereabouts. Best of trades to everyone this week!
https://tinyurl.com/yb699qq4
Verne Carty November 4, 2018 at 10:26 AM
Thank you.
I have learned more about EW in six months of reading your posts,than six years of subscribing to the guys who ‘wrote the book”
Imho, none better…
I suggest you get some professional help.
First you try to embarrass me by posting my compliments to Joe, openly acknowledging that I learn from his posts, then you post a link somehow implying that I steal his work.
I look at hundreds of charts weekly, subscribe to numerous newsletters. and have traded with John Carter, Ken Trester, Adam Lass, Bryan Bottarelli, Dick Diamond, Charles Nenner and others, as well as and trading a seven figure account. Show some respect.
You are way out of your league ROT-ROT…..
??????!!!!!
rotrot…you are not adding any value here by attacking Verne. knock it off.
Folks, I don’t know where this started, but let’s cut the personal attacks. That’s the one thing I won’t stand for.
I agree this drop does not look close to done. I thought expanded flats are 3-3-5 patterns, what you are describing sounds like a 3-3-3 pattern. Could it be that the wave down we had in October was in 5 waves with a small ii wave and deep iv wave and now we have 2 more down waves coming up? Thanks
Sid,
“I’m calling the pattern down from 2940 the C wave of an expanded flat.” It’s complete. This is a combination pattern.
Sorry I know it’s all semantics, but wouldn’t that be a running flat since we haven’t taken out the Feb low.
Yes, it’s really a running flat, which is the alternative that I’ve been suggesting for the past several weeks. It’s kinda semantics, but let’s be correct. I’ll make that change, thanks.
Just back from holiday. Today we make/made the High. Decline into Thursday and Friday up into Monday. Both are Huge. Further I must check. Watch http://www.prognoseus500.nl Lookslike 8th and 15th november as LOW
November Planetary Cluster Dates – Olga Morales | October 30, 2018
11/02, 11/06, 11/13, 11/16, 11/20, 11/27
https://twitter.com/AstroGann33/status/1057359729893101568
Hi Rotrot,
Do you mind quickly explaining the cluster dates?…and what they should correlate to? thanx
“The Higher/Lower the RED curve, the higher the chance of a CIT-change in trend”
~ Olga Morales | October 30, 2018
We just might get the turn before Monday Willem. Huge open interest on this week’s SPY 275 strike calls.
Welcome back!
Where is Sir Charles?
Miss those rapid-fire scalps!
Hey Mr Verne..ive been working on some new strategies in the trading lab that have been working real well..only troubles been on days when the option premiums skyrocket cuz of higher vol. So I had to reopen my futures trading account. How are you positioning for midterms?
Oodles and Oodles of credit spreads Sir Charles. I have identified the SPX 2700 pivot as critical and using price action around it to manage my short term positions. My algos are set to trigger on any 2 std dev around the pivot with high price momentum. I don’t expect any smaller degree C wave up to go much pass 2820.
I have a truck load of SPY 279.50/280.50 bear call credit spreads, as well as 264.5/265 bull put credit spreads. I execute on counter-trend moves and exit short legs on reversal signals, typically just ahead of “C” waves up or down. Getting 5 to 10X returns on the manic C waves the last few weeks. Plan is to get as many 264.5 puts and 280.5 calls at zero cost basis or less as safely possible’
Nice run so far!! ( I know it’s double dipping but I am a spread trader) 🙂
Long SPY calls at open, quick 25% profit..Looking at some puts now.
Closed out another batch of short puts on this ramp and holding long puts from spread at close to zero cost basis.
We should be close to completion of a B or second wave corrective move up.
A green VIX print on the move up a caution flag for bulls. I am keeping short side powder dry for a close below 2700.
Nice scalp Sir Charles!. Lots of 25% small trades can really add up! 😁
I was not expecting it but that looks like an ES bull flag to me.
I suspect we are in yet another abc wave up.
I am curious to see if we get a switch on the 6th or 7th..with the cluster dates and stuff that Joe has wrote..to C
Buying back remaining sort SPY 265 short puts.
Deploying another batch of 283/285 bear call spreads.
Great entry on bear call spreads. Nicely in the green but I don’t trust ’em!
Any move above today’s highs and I am leaving Dodge!
Ideally we see a move back up to tag underside of broken wedge pattern with an impulsive rejection….
I think Key time to see if Peter’s double bottom call to 2650/2600 will hold true or we go for 2840 from here.
Very few people are accurately calling this tough market. New highs yesterday before the close stopped me out of bear call spread and futures now higher. Ptice is simply not doing what one would expect based on most EW counts I have seen and it is a good reminder of the importance of trading what you see and not what someone predicts or what you expect.
Yes sir Mr Verne. My trading program had me long into yesterdays close and I held on in case of more upside today..glad i did!
IMO the bias is up through end of year..target is 2840 to 2850 by end of year.
Yep. Every EW count I have seen had us in some kind of corrective b wave up, in some cases at multiple degrees. I started to have some doubts about that yesterday but knew the flat some were calling for could extend higher to become an expanded flat. The wave duration also has now become problematic. I think it is entirely possible that we are in a second wave up.
I don’t know jack about EW, but this move looks to me like a final thrust from some kind of triangle pattern and therefore terminal. Volume anemic.
Redeploying 283/285 bear call spreads on SPY.
A close above 2800 says I am wrong and don’t know what the hell I’m talking about…very important to know what you don’t know….lol!
Peter t
My saying ” Elliott wave is best used in hindsight ” was nothing against you .
All I meant was that you don’t know ( not you personally ) the wave count
For sure untill it actually traces out or at least enough of the pattern takes place
That you can say based on that what should be next .
Additionally I admitted I was not sure about what comes next ( nya vs spx or Dow )
Cyclical wise today is the mars Uranus sub cycle high even though we are now in a 10 upcycle
( 20 month low to low ) . Statistically from Nov 7 to Jan 16 is bullish .
1,statistically up, 2,cycle up,3 last of the bearish cycle into January .
That’s 2 reasons to be bullish and 1 reason to be bearish and if one wanted to add in the elections
And assume our government ( USA ) will be to busy fighting each other to actually do anything .
You can call it equal .
The sideways trend continues with assumptions of who will or won’t do what and to whomever.
The peak in January I still have to count as the top of 3 and 3 wave moves are corrective waves .
You and I have disagreed in the past over the wave count going back as far as the 2007 high yet
As of today we do have a 3 wave move up from 2009 .
Not arguing your wave count just saying that looking at the wave count in hindsight is benificial
The setup is becoming so obvious that even Ray Charles can see what is coming
Joe I understood EXACTLY what you meant. It is quite clear that no one can consistently predict precisely what price is going to do as there can be ambiguity in a wave pattern depending on the stage of development. We have all heard the saying, “ABC and 1,2,3 are sometimes tough to differentiate” . The frequency of the need for adjustment to EW counts makes this abundantly clear. All analysis is ultimately about probabilities.
Traders always get into serious trouble assuming otherwise.
Joe,
Not my experience. There are many times when I know exactly where we are. And Joe, with the stuff you come out with regarding EW, you are hardly one to comment on its accuracy. Yes, anyone can determine the wave count in hindsight, which, if you could trade it again, would have some value. But you can’t, so it doesn’t. Why do I keep this free blog going? I honestly do not have the time to continually defend myself.
SIR PETER your expertise is much appreciated by most of us folks..you get the trends and major moves right the majority of the time…pls dont let the naysayers get you down. Keep up the great work! Imma still long from your call for the B wave..Mighty thanks from the bottom of my heart.
Peter’s B wave 62% retrace was right on the money.
The rest of us amateurs expecting a decline within the B wave did not really get one as price traded sideways ahead of the final thrust up and that was the big difference in trying to trade the price action this week. I am waiting for a move below the current round number pivots before re-deploying bear call spreads. Live and learn….
Yeah I’m still long as it’s above the 62%..Maybe wave 5 underway if it goes much higher..
Thanks, Charles. Missed this earlier.
….Peter u definitely…you saw this one coming…but as you know with Elliot Wave no body ever knows when it will happen..thats the tricky part..
Peter, thanks as always for being the best.
A potential fractal in play right now has 10/29/18 = 1/20/16. Ninth trading day from swing low was 2/1/16 swing high. Tomorrow is 9th trading day from 10/29 low.
Thanks, Liz.
Peter t
I have not asked you to defend yourself .
I have not claimed to know it all .
There are times when I’m confindant and times where I admit I’m not sure how the market will move.
I have stated my focus is based on timing and cycles first and the wave count second .
if I’m correct, you have stated you focus on the wave count first and it is your primary focus .
I’m not questioning your forecast or even arguining it . I don’t know why you become somewhat insulting
( And Joe, with the stuff you come out with regarding EW, you are hardly one to comment on its accuracy. )
I never said I questioned its accuracy nor yours .
The only stuff I have ever posted about Elliott wave theory ( details ) I posted a couple years ago
About wave relationships in terms of time and price and that went over like a lead balloon so I dropped it .
I have for the most part agreed with your posts for this entire year .
Like it or not I use several methods and Elliott wave theory fits into it.
Today the cash Dow exceeded its target and in doing so it also did so to the exact day
I was looking it’s it’s target to be hit . So if that is some bad crazy call on my part excuse me.
Calling the October high an X wave was certainly outside the box on many many levels and
Yea it does not add up . Calling it a B wave certainly makes sense .
The 2007 high though was a 3 wave move from the 2002 bottom .
The year 2000 high was the high and the 2009 low was the print low.
That 9 year period was also a sunspot cycle high to low.
Everything lined up back then yet it is not so lined up today.
The sunspot cycle has been crashing since 2014 and yet the stock market only paused and
Then went vertical . Just saying not everything is lined up the same which implies something changed .
3 wave moves suck as do 4 th waves because there is not always a 5 th wave .
You can’t state that their is always a wave 5 because to do so would be a lie .
Corrective waves are only 3’s .
Thank you for everything you do . No need to defend your thoughts
I AGREE WITH YOUR BIG PICTURE !
Joe
Listen Joe,
If you owned a business and someone came into your lobby or a gathering in which all your prospective clients were there and broadcast them all that they don’t believe in what you’re doing as a businessman (predicting the market using Elliott Wave) and that it only makes sense to look at it in retrospect, would you be super happy with that situation? I was telling a professional trader today that I don’t know any other business model that invites outsiders in to sit in the lobby with placards that advocate against the principles of the business.
It’s sure not making a lot of sense to me .. and it doesn’t make me happy. But people seem to think it’s OK. It’s particularly irking with all the work I put into the blog. The comments area, as far as I’m concerned it just NOISE. It’s a huge distraction to disciplined traders. And you don’t know half the crap that goes on in the background.
Imho, I would prefer it if you don’t believe in EW as a predictive tool that you keep it to yourself when you’re in my lobby.
Well then do we know where it will stop. May be it stops at 2813 area…this can be a sharp bear market rally. today also an moon phase. FOMC tomorrow. So have all the catalyst. Now we have to see EW can it predict or just more randomness from here.
I think Peter T already told very hard and difficult market. Appreciate his effort and time he gives to free blog
Thanks, Biil
Hi Peter I have been following all sorts of analysts for 20 years. But youre predictions and artikels are the best. Even in the last difficult period. I have tested (on purpose) two expensive US analysts in recent weeks and I’m really done with them. With You and the best of my indicators I will take on the big decline in 2019-2022. So leave the negative reactions for what they are and go further on youre EW-road. 🙂
Thanks, Willem, for the kind words. Best with your trading.
Adding some 280 calls on potential breakout after Fed..Target is 2850 on spx..285 on spy.
Adding a second batch of calls..here comes the pop!
To whom it may concern :
I am a die hard elliottwave theory believer !
The next subcycle mars Uranus low is due on Nov 23 2018
This date ( Nov 23 ) is also a Martin Armstrong date .
additionally it is a date which is tied to Brexit ( according to Armstrong .
Peter t
I apologize for giving you the impression that I don’t believe or trust Elliott wave theory .
The truth is I do which is why I follow your posts .
It is your updates that has kept me on track . I use several timing methods and because
I am fairly busy I don’t always have time to analyse the markets in as much depth as I would like to.
Your update I see as valuable and I appreciate your time and efforts each weekend .
For me it takes a good 4 hours of work and I’m sure for you it is at least that if not more time just
To put together your weekend updates . If I was to include your chart show on top of what you do for
Your subscribers I could see you putting in 50 plus hours a week and that doesn’t even include
The web site admin portion .
Sorry for offendng you as that was not my intensions at all.
I’m not one you enjoys arguing yet I am one who tries to carry a conversation with the intent
Of sharing info as well as learning from others . Every once in a while I learn something new
And I think that is a good thing .
Elliott wave theory is a great tool to gauge the market by because it tells you ( me ) where the market
Stands today . It does not tell you for sure where the market will be tomorrow 100 % of the time
BUT…… It’s the best measuring tape available and if you understand the theory you can get very
High odds in your favor on which direction the market will go next .
So how do you improve those odds even just a little bit so you can become more accurate as to when
That trend change will begin ? When will that wave count change from wave 3 to wave 4 or when will wave 4 end ?
You use ( I think anyways ) Andy pancholi ( sorry if I spelled his name wrong ) to help you with timing .
I don’t find that as bad I’m just pointing it out . Everyone who trades uses a combination of methods that they learn to trust
And adding Elliott wave theory to it is a big plus ( I think you would agree )
So I’ll finish this up
Thank you for all the time and effort you put into this site as well as the blog . It is a huge amount of information
That I’m sure helps a lot of people . I have no interest in turning people away nor do I or ever have said anything
Bad against Elliott wave theory or have I said anything bad against its accuracy .
What I said was I focus on timing first and the wave count second .
I’m truth I would say I focus on the timing then indicators and then the wave count .
That is how I combine your updates to my work . And I put wave counts on everything I use .
I don’t wish to argue so I’m finished
Nov 23 is the next date yet Jan 20 2019 is the end of this mars Uranus bearish cycle .
I’ll let the wave count continue to unfold and make my bullish bets once time price and the
Wave count conclude .
Peter t has done an excellent job navigating this market for the past 4 years I have followed him
On this blog . For those who are new here I want you to know I highly respect his work and his
Attention to detail .
Enjoy your weekend everyone : )
Joe,
Probably then just a poor choice of words in the previous comment.
Having extensively reviewed all the claims made in the book, “The Elliott Wave Principle,” as I’ve posted previously, I’ve found a lot of errors in Prechter’s work. But that’s fine, because a science evolves over time.
As a result of the changes I’ve made to some of the core principles, and adhering to the revised rules and guidelines, EW as a predictive tool has proven to me to be highly accurate. That is what the EW focus of my work is on here on this site. It is useless as atool for looking at the market in hindsight, unless you’re testing the rules and guidelines (or refining them), which I’ve done again and again over the past ten or so years.
If you don’t do this work and rely on the book, which is riddled with errors, you will can easily be wrong almost as much as you’re right. It is lousy as a timing tool, but on price, it is quite predictable, if you understand it properly (by the “new” rules) and understand the possible fibonacci relationships of all the waves, corrective or impulsive. I’m attempting to show how predictable it is, which is sometimes difficult in the free blog, as I only provide a weekend “snapshot” of the market, which admittedly could change on a short term basis on Monday.
Given the daily videos and updates I do in the Trader’s Gold service, I can capture almost all changes this market dishes out. There are many times the market gives mixed signals and I try to identify those as such. Those are the times when it is nigh impossible to predict the short term outcome. In any case, I’m somewhat horrified when I’m wrong; It happens, but not that often.
Thank you for the kind words. Yes, I put in a lot of hours doing this (you’re not far off on the numbers), partly because of this very difficult market we’re in – mostly sideways for the better part of a year, so far.
I have never found EW as a raw science to break any of the major rules; however, some of the rules and principles are incorrect (eg – truncations don’t exist, the five waves of zigzags are not impulsive, and neither is the C wave of a flat, etc.). So, it all comes down to the analyst and how much work they’ve done on their own to prove or disprove the theory (ie – doing your homework).
If the free blog ends up being a free-for-all on the validity of the Elliott Wave, then I will tire of the entire exercise very quickly. It should be a blog that is of help to traders of any persuasion, and hopefully highlighting the predictive capabilities of EW, when refined and used properly.
Thank you for clarifying your previous comment.
Let me clarify one thing: A science itself doesn’t “evolve;” our understanding of it evolves
Not sure how if affects the EW count but meandering around pivots is generally bullish. I think the pivots will hold, whicb means we go higher. After we top both DJIA 26K and SPX 2.8K willbe decisively taken out.
Have a great week-end all.
There is such a thing as a Paradigm Shift” in Science. Prior to the arrival of Qunatum Mechanics, for example, not a single scientist questioned that the wave form designation for Light was accurate.
Of course Max Planck changed all that. No scientist today questions the particulate nature of Light.
It is absolutely true that what makes EW dangerous for even skilled analysts, much more so for people who don’t know what the hell they are doing, it tells us noting about the timing of how the waves will unfold. I am also of the opinion that Central Bank meddling can and does affect how waves unfold, for example in transforming a regular flat into an expanded flat. As traders, I think we have to talk honestly about our experience with any trading methodolgy and I think we can do so without disparagement. I happen to be a big fan of the Chart Show and have sent a few traders I know there as I know Peter knows what he is talking about.
As he himself points out, he does not claim infallibility or necessarily a complete understanding of all that pertains to EW. I can tell you from first hand experience not even Bob Prechter does! Just my two cents.
Prechter’s group doesn’t have the slightest clue where we are right now. It’s funny to watch them floundering around and trying to find charts to support their biased opinion … lol.
I found it absolutely stunning, that Hochberg and Prechter could be so consistently wrong about important market turns.
I got so frustrated with their analysis that I concluded nobody could possibly that incompetent, considdering that they literally “wrote the book”, and that they were deliberately misleading their readers. As a result, I actually started making trades exactly OPPOSITE of what their analysis indicated and made money with that strategy!
Amazing they STILL have subscribers as I figured they would all be BROKE by now…lol!
Peter t
I understand all what you said .
If I was to quote prechter . Trading is work ( keeping it simple )
I can say I have spent countless hours since 1995 and I began
After first reading at the crest of the tidal wave and then Elliott wave principle .
I followed prechter and hochberg for 14 years . In April 2009 i moved on and
Have not looked back.
Jim Martins was a good commodities and Elliott wave guy at EWI
As was another guy named Jeffrey Kennedy .
The past few years though I have become complacent . I got long in 2009
Got longer in 2010 and 2011 2012 into 2014 and then paused and lightened up .
This year being a benner business cycle high and next year being a modified
Benner business cycle high leaves me cautious . At best and it is my bias
End of 2019 early 2020 is all I can give this market and economy .
Time wise Jan 2019 low and maybe a sideways chop around like 1929
A spike up to complete the topping formation ( wave 5 ) and then good night .
I cannot see how the USA is not in a civil war by 2021.
To quote Martin Armstrong who would want to be president after seeing what trump is going through
Or ” who is next ” ?
I’m babbling so I’ll finish .
A bit chilly on the west coast yet nice sun rise and calm seas .
It’s been a very long morning for me and now we’re out to sea .
Time for a nap : )
New Moon
The moon is currently in Sagittarius
The moon is 1 day old
Hello Peter. Just wanted to thank you for a few amazing calls that saved me a lot of money this week . . . . . Your call that silver/gold were heading lower, and that crude would be bottoming soon. I held off on buying crude until this morning, as well as buying some small gold (NUGT). I’m looking forward to the next few weeks and as I’ve commented in many emails I forwarded ~ your work has been a blessing for me (and I’ve been trading futures for 38 years). Incredibly accurate, and more importantly, it’s communicated in a simple, effective, and very profitable manner. So thank you for your devotion to the study of Elliott Wave Theory. It’s very much appreciated!!!!!
Kyle
Very much appreciate, Kyle. I’ve already filled out the adoption papers … lol. (you’re adopting me, not the other way around).
Playing for a bounce to Monday, if today is some sort of swing low.
Yep! Deployed lots of vertical bull put credit spreads at the close.
I just LOVE getting positioned courtesy of the house, lol!
One more push higher and then…..well, you know…!
Good for thought
I’m putting together a few short term dates for next year
These are based on Steve puetz as well as Chris carolans work
From his spiral calendar ( he calls it that )
I’m not even close to done on this .
saros cycles
The saros is a period of approximately 223 synodic months (approximately 6585.3211 days, or 18 years, 11 days, 8 hours), that can be used to predict eclipses of the Sun and Moon. One saros period after an eclipse, the Sun, Earth, and Moon return to approximately the same relative geometry, a near straight line, and a nearly identical eclipse will occur, in what is referred to as an eclipse cycle.
Keeping it simple.
The years 1929 and 2019 can be similar .
2019
2001
1983
1965
1947
1929
All 18 years apart so should be same saros cycles
But I need to look them up to check .
All I have to offer .
If your interested I think it’s worth some research .
Joe
Peter:
after the market collapse sometime next year , when do you think we will come out of the woods, and the crisis will be inflationary , am I correct?
thanks for your detail mapping.
Hi Jo:
I have also read and followed Martin Armstrong for a while, he mentioned DOW will go as high as 40000-60000, how will this fits in the picture? any thought?
shunn
Shunn,
Historically, 30-50 years before signs of inflation return. btw, the DOW is definitely not going to 40K.
https://worldcyclesinstitute.com/same-wheel-different-hamsters-a-typical-172-year-cycle/
No thoughts shun
I’m in the ocean and going to lose phone so keeping this short term .
Mercury retro Nov 16 th to Dec 6 th .
Using a 10 lag = Nov 26 to Dec 16 th
Mars Uranus subcycle calls for Nov 23 low to Dec 3 sucycle high
Solar eclipse Jan 6 th yet that cycles typically begins roughly 30 days prior .
So Dec 6 th is where I begin paying attention .
Bottom line :
Armstrong date Nov 21
M/U subcycle low Nov 23
Mercury retro Nov 26 ( 10 day lag )
30 day prior to solar eclipse = Dec 6
M/U subcycle high due Dec 3
Lastly :
Looking at the year 2019 I’m seeing a lot of stuff combining together yet
I’m a long ways from putting it all together .
The dates posted are just dates at this point . While I do have an opinion
Please consider all of it as speculative .
Joe
A new post is live at: https://worldcyclesinstitute.com/last-train-to-fearsville/
This website is for educational purposes relating to Elliott Wave, natural cycles, and the Quantum Revolution (Great Awakening). I welcome questions or comments about any of these subjects. Due to a heavy schedule, I may not have the time to answer questions that relate to my area of expertise.
I reserve the right to remove any comment that is deemed negative, is unhelpful, or off-topic. Such comments may be removed.
Want to comment? You need to be logged in to comment. You can register here.