
 Many would say we’re in uncertain times. We are in terms of individual events, but the overall picture is fairly clear, if you understand cycles. The human race has been through this cycle many, many times before. We’re like hamsters in a gigantic financial wheel. And we never seem to learn from our mistakes; we don’t pay attention to history.
At the end of each revolution of the wheel, there’s usually a real revolution, complete with civil wars, pandemics, and sometimes a rebirth of the entire economic system.
These cycles are longer than a human life, and so we have no personal experience to guide us. We need to pay attention and learn from the past as well as understand how it repeats on a regular basis and in a timeframe that’s predictable.
In this article, I’ll review the bigger picture of how these long cycles determine the ups and downs of civilizations and then review one cycle of 172 years to provide an example. I think you’ll find that events from centuries ago form a pattern that is quite similar to what we’re experiencing today.
If you want to know the future, study the past.
In other words:
| What has been will be again, what has been done will be done again; there is nothing new under the sun. |
| Ecclesiastes 1:9 |
________________________________
The Big Picture
Natural climate cycles play a major role in just about everything that happens on our planet. Contrary to recent global warming hysteria, the temperature of the atmosphere on Earth is determined by the Solar System. Both temperature and rainfall play out in reasonably predictable patterns (cycles). The definition of a cycle is that it recurs at regular intervals.
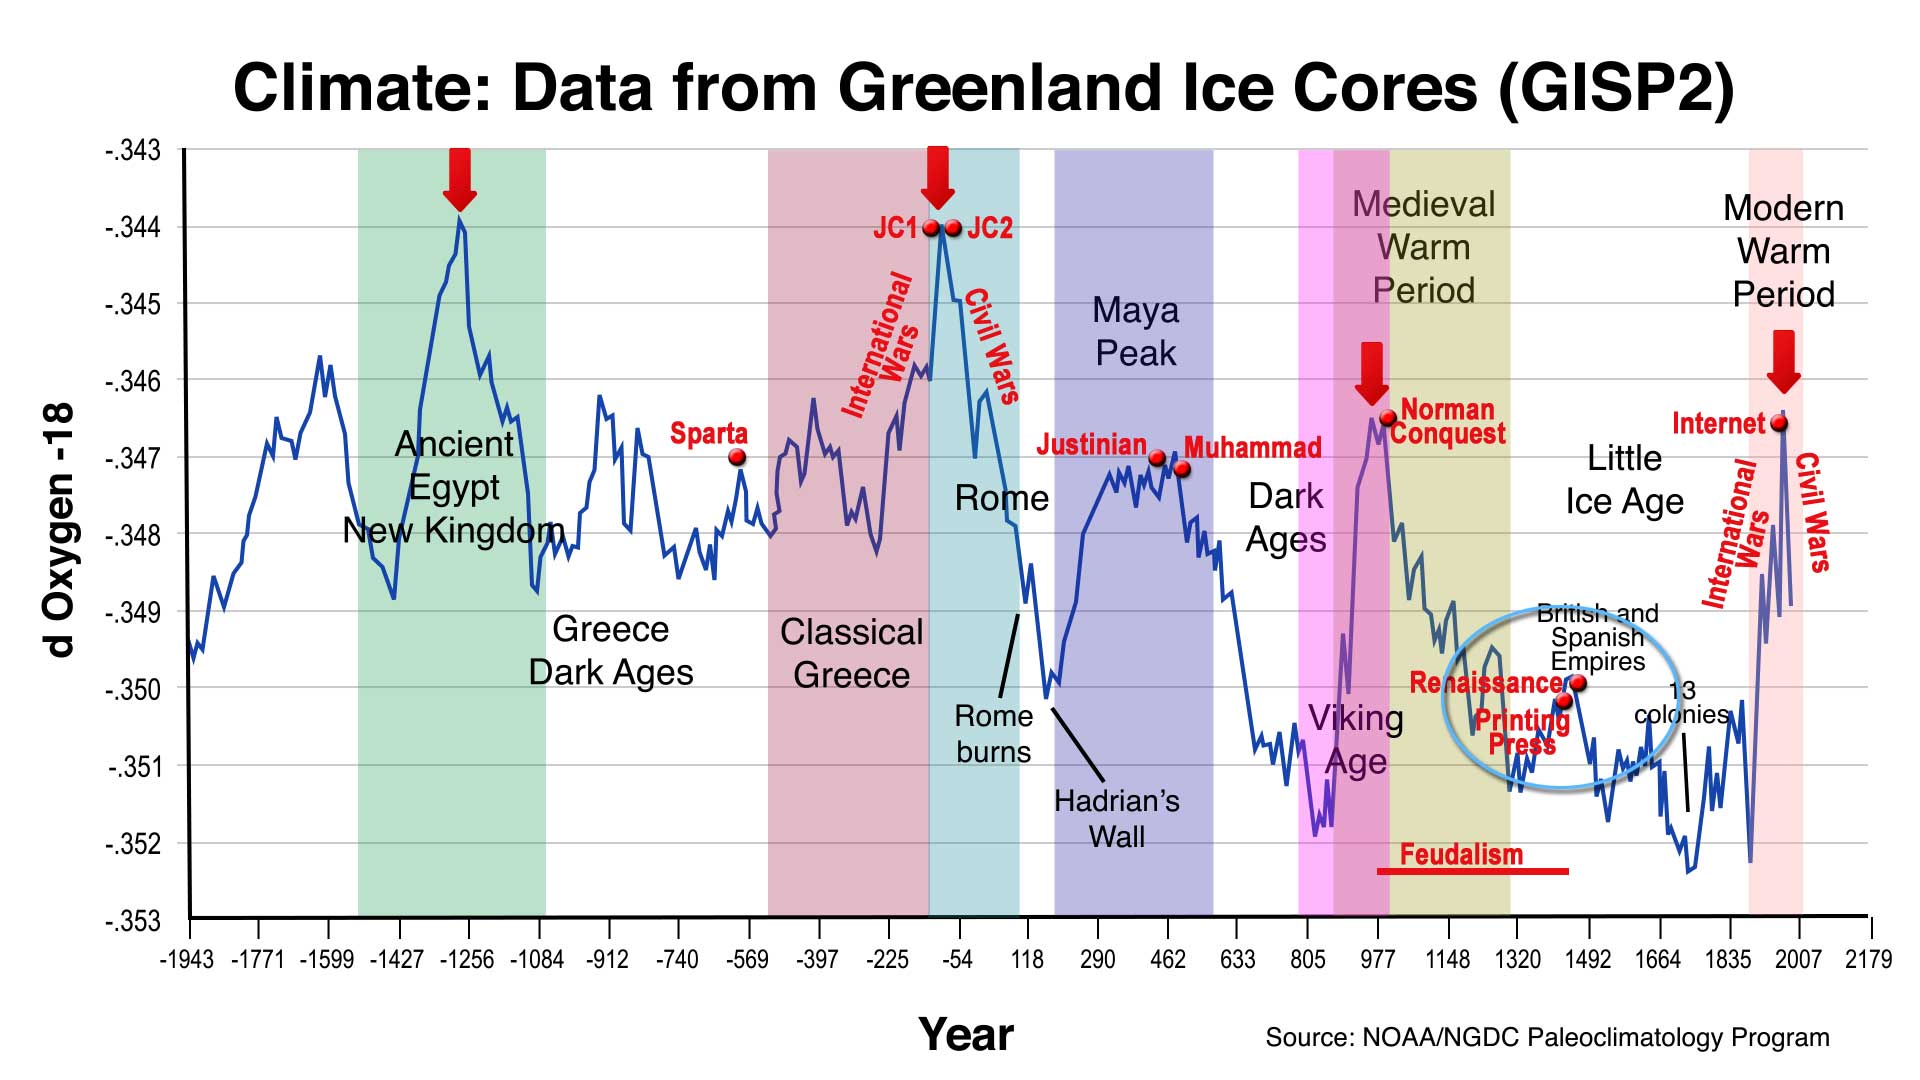
The data above comes from the National Oceanographic and Atmospheric Administration—from the Greenland Ice Core Research project ending in 1992. Ice cores are an extremely accurate method of determining temperature back through the centuries. This data is undisputed by the scientific community, but has been suppressed by the UN-associated, man-made warming advocates. It also reinforces the findings of Dr. Raymond Wheeler in his research over fifty years earlier of tree ring data, weather records, military records, locust plagues, historical chronicles, sunspot records, etc.
What the above chart shows is the temperature cycles (blue line) over the past 4,000 years. Each time there’s a temperature peak (red arrows), a major civilization also peaks and then goes into contraction. This has happened over and over again throughout recorded history.
The gaps between the red arrows are approximately 1,000 years in length. Certain world events take place at predictable points along this 1030 year cycle peak spectrum. “JC1” refers to Julius Caesar, “JC2” to Jesus Christ and the start of Christianity. Note that the Islamic religion also began at a climate peak, around A.D. 600 (Muhammad). Many events have a level of predicability.
International wars always take place as the climate warms and there is abundance, while civil wars happen on the downswing, in difficult financial times.
The circle on the above diagram highlights a period between 1148 and 1320 AD, which I’ll use as an example of how a typical 172 year cycle unfolds.
History Rhymes. If you want to know the future, study the past.
Every 172 years, there is a major financial collapse, a key component of what I refer to as “The Financial Collapse Cycle.” These 172 year cycles follow a similar pattern, which has been apparent in all the cycles from 1148 through to the cycle top we’re in now (2018). It’s likely this has been the case since the ancient Egyptian dynasties of thousands of years ago, but the data becomes more difficult to source the further back in time that we travel.
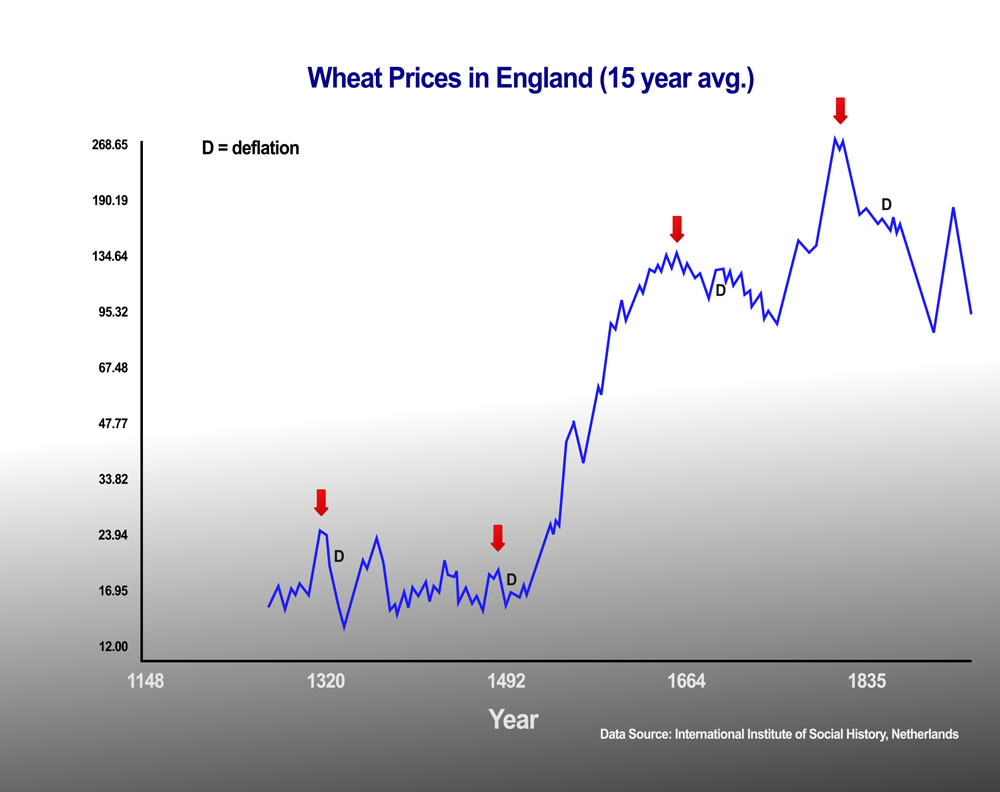
This chart above shows the cyclical nature of inflation. It rises during the cycle, but collapses into deflation at the end.
After each deflationary period prices stabilize again. Gradually inflation increases until, near the end of the cycle, it takes on a life of its own. Prices always rise but wages don’t. Eventually the population is squeezed into poverty We continually run into the same situation we have today, leading to an inflationary bubble and eventually, a financial crash, resulting in deflation.
The red arrows show the inflationary peaks that coincide with the natural 172 year cycle tops.
In my research, it’s become obvious that these 172 year cycles align with the movement of the planets of our solar system, more specifically, the conjunction (alignment) of Uranus and Neptune every 171.4 years. Fourteen years after each Uranus-Neptune alignment, there has been a financial collapse, from the 1148 cycle high right up to 2007. I’m currently researching earlier cycle tops, but the data starts to become sparser the further back you go.
My research, which includes the independent work of others, shows these financial collapses occur at regular 172 year cycles, every third cycle (515 years) more devastating We call the 515 year cycles “Civilization Cycles”:
- 1320 — The Siena world bank crash in 1298, followed by the Florentine banking collapse (various banks crashed from 1302 through 1346. Medieval Europe came to the edge of disaster. Volatile climate usually accompanies these cycle tops, with the years 1315-18 ushering in one of the largest famines in history. In 1348, the Black Death set in and in three years, wiped out almost 50% of the population of Europe.
- 1492 — During the last quarter of the 15th century, the cost of living rose to extremely high levels. In 1492, Lorenzo de Medici suddenly died and the mood in Florence, Italy turned dramatically. The turn was marked by the Burning of the Vanities in Florence in 1497 when great books, paintings, and musical instruments from the Renaissance were burned in a huge bonfire. The economy failed, riots developed. Famine was followed by epidemic disease.
- 1664 — (also a 515 year Civilization Cycle) The great bull market that had begun in England in 1503 came to a top in 1662. An 89 year bear market followed with a deflationary spiral that affected the European continent, as well. Revolutions had already broken out in virtually every country in Europe. The Great Fire of London gutted the city in 1666. The bubonic plague had laid waste to the city and countryside the year before.
- 1835 — The financial crash came a little early in this cycle, topping in 1811. By 1812, more than half of English families were dependent on some sort of relief program for the poor. The Napoleonic wars began at this time and Europe also suffered the most severe weather period in its history in 1816 (and surrounding years). It all culminated in the Panic of 1837 with another major stock market crash that began a bear market and depression that lasted almost to the end of the century. Cholera epidemics from 1829-51 wiped out hundreds of thousands of people.
- 2007 — The Great Recession, which is just the precursor to a larger depression yet to unravel during 2018. The economy has only been kept aloft in superficial manner by central banks, but governments are reeling in debt as a result of the greatest financial bubble in history. Central banks have been able to inflate and keep the stock market afloat for nine additional years, but expect a final top this year (2018). The World Health Organization is already warning about the increased risk from pandemics.
All these cycles have unfolded in a similar manner. As Mark Twain said, “History doesn’t repeat, but it rhymes.”
And of course, the most famous quote:
“Those who do not remember the past are condemned to repeat it.” — George Santayana
___________________________
The 172 Cycle of 1148 – 1320
Below is a chart (click to enlarge) of an early 172 climate cycle (1148-1320) showing temperature and rainfall for the period, based upon the work of Dr. Raymond H. Wheeler, who spent much of his life documenting climate from 600 BC up to the present time (about 1940, as he died in the early 60’s). He also recorded major events across a wide spectrum of fields.
He immediately noticed a correlation between the events and climate, and certain cycles appeared that were indisputable, as they were periodic (they happened over and over again in a specific timeframe. He identified climate cycles of 25, 100, 170, 100, and 1,000 years.
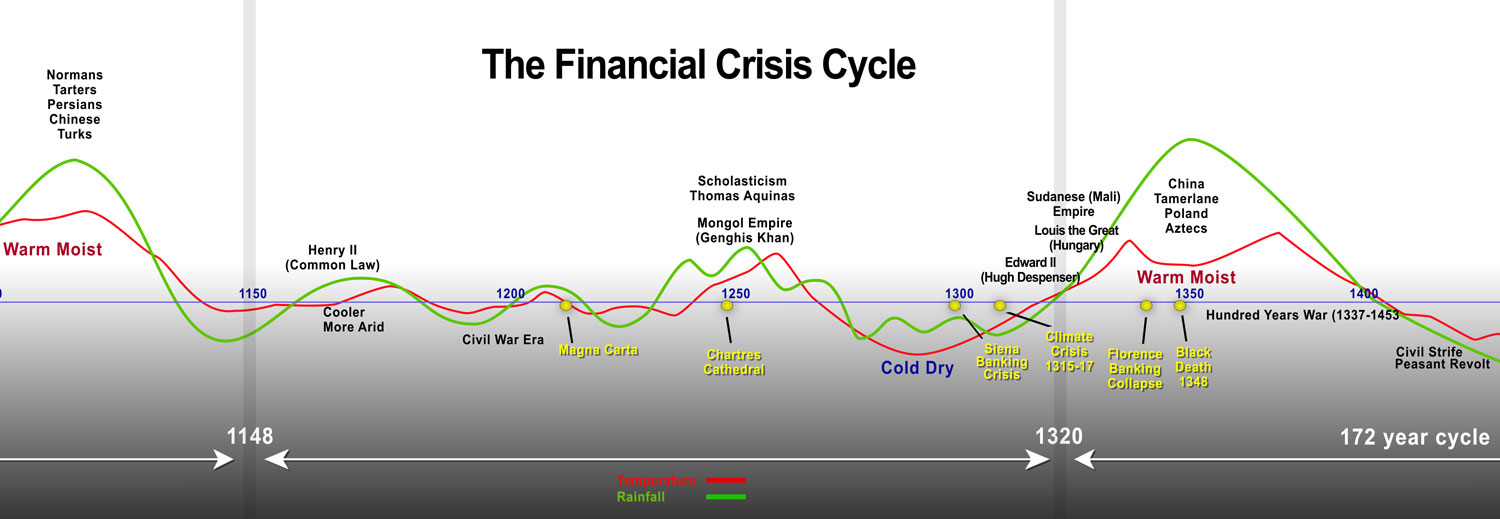
At temperature and rainfall highs, civilizations peak. As the temperature turns colder, the economy falters, there’s often extreme weather, resulting famine, a population reduction, and a following pandemic. This pattern seems to play out for each and every cycle.
Dr. Raymond Wheeler sums up these cycle tops:
“As the warm-wet phases terminates, climate becomes drier and hotter. As it does, other phenomena manifest themselves: creativity declines; reaction and decadence set in; governments become despotic; minorities are persecuted; general health declines along with the birth rate; economic systems collapse; socialistic and communistic regimes rise under an epidemic of dictators; individual freedoms vanish; and the moral tone and society reaches a low level. Toward the end of this period comes another series of wars we call nation-falling wars because many of the governments initiating them during this period are either tottering or about to collapse internally. These particularly savage conflicts occur on falling temperature and a rising rainfall curve.”
As it turns colder, reinvigorated populations revolt against tyrannic governments. Civil wars break out and gradually, there is a move back towards democracy.
For example in the period above, King Henry II of England greatly expanded the role of royal justice in England by establishing trial by jury and is generally considered to have set the basis for English Common Law. In 1215, King John signed the Magna Carta which promised swift justice and protection from unjust feudal payments. In the cold 1260s, there was a rebellion of barons and Henry III was forced to create the Oxford Parliament. The French national assembly (the Estates-General) was established in 1302. Democracy always moves forward during cold-dry times.
Each 172 year cycle has a “golden age,” which aligns with a warm-wet period. Scholasticism (a method of critical thought) arose and dominate teaching in universities. This period boasts Thomas Aquinas, the proliferation of cathedrals, the amazing Mongolian empire of Genghis Khan, and the English philosopher, Roger Bacon.
These 172 cycles always end badly, however. In 1314, the weather suddenly turned cold and very wet. Crops rotted in the fields. The spring of 1315 brought heavy rains again throughout Europe. The price of wheat rose eight-fold. Famine set in as never before. The economy disintegrated. Unbelievably, torrential rains came again in 1316. The crop failed for a third year in a row.
It’s estimated that a tenth of the population of Europe perished during 1315/16. Famine, epidemics, and oppression were followed by increases in crime. Bloody conflicts broke out between European countries. Uprisings began in England, Italy, and Sweden.
At the same time, the rich grew richer as the poor grew poorer. Inflation continued to cause prices to rise. In 1298, a banking panic arose in Siena, Italy, the financial capital of Europe. In 1307, it’s greatest bank, The Gran Tavola, failed.
The city of Florence picked up where Siena left off. The Florentine banks made huge loans to the kings of England and Naples. In 1302, the first bank went under, and over the next 40 years, all the rest failed.
In 1347, the Black Death established itself across Sicily and spread to Africa, and the mainland of Europe. Tens of thousands died. By the time it was all over, it’s estimated that Europe lost between 25-40 percent of the population.
A long cold-dry period set in for a hundred years; it led to the death of medieval civilization.
These cycles are all very similar in nature. You’ll find a four stage summary below. You’ll likely see a lot of similarities to the world we live in today. It’s already starting to get colder; we are swimming in debt, the disparity in wealth is at an all time high, and the stock market is at the top of the largest bubble in history.
Inflation During a 172 Year Cycle
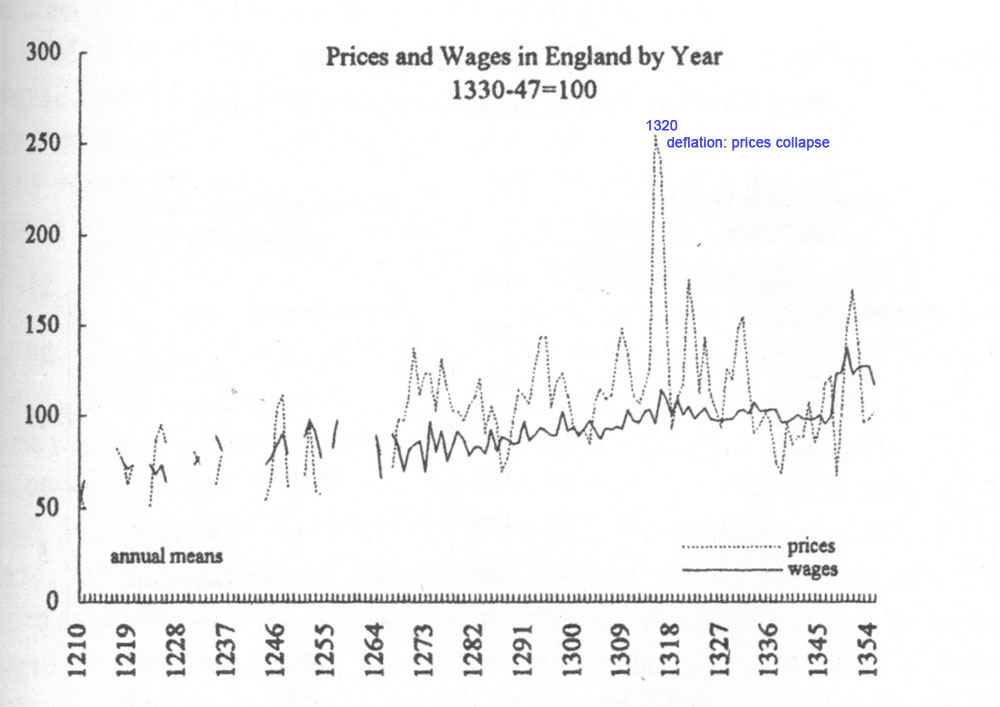
This chart from “The Great Wave,” by David Hackett Fischer shows the rise of inflation to a crescendo right at the year 1320, the theoretical top of this cycle. You can see how it starts slowly in the early part of the cycle and then gains speed as time marches on, only to crest and crash at the end. It’s always followed by an extended period of price deflation and depression.
_________________________
The Four Stages of a 172 Year Cycle
Following are the stages of a 172 year cycle. See if you recognize any similarities to the world we live in today.
Stage One
The first stage after a crisis and financial collapse begins slowly. After a period of spiralling deflation, prices stabilize and then very gradually begin to rise to a plateau that continues for some time. Food and fuel tend to increase ahead of anything else. The initial rise in inflation is a result of population increases, which leads to a higher demand for goods and services. Living standards begin to rise. Couples marry earlier and have more children. Civil wars stop and social confidence and optimism return.
This leads to a “golden age” in every 172 cycle:
- 12th century — Renaissance
- 15th century — Italian Renaissance
- early 18th century — The Enlightenment
- late 19th century — Victorian era
Stage Two
Inflation continues, with prices beginning to accelerate above the previous plateau. Government wealth increases, sparking political hubris, which leads to empire-building and wars of expansion. Examples:
- 13th century — rivalry between emperors and popes (gov’t vs. the church)
- 15th century — state-building
- 18th century — dynastic and imperial struggles
- 20th century — world wars
Prices become volatile, rising and falling, a signal in underlying instability. This results in political disorder, social disruption, and a general mood of cultural anxiety
Stage Three
In the third stage, the general population comes to see inflation as the norm. People began to make choices that only exacerbates the situation and causes inflation to increase. Governments increase the money supply, only to add to inflation (like a snowball slowly rolling down a mountainside).
Stage Four
Prices continue higher and gradually became unstable with increased volatility. Commodities fluctuate wildly and prices begin to fall. The money supply is expanded and then reduced with financial markets becoming unstable. Governments increase spending and go heavily into debt. The strongest nation-states are the ones to eventually suffer the most due to fiscal constraints:
- 16th century —Spain
- 18th century — France
- 20th century — United States
Real wages begin to stagnate. The rich grow richer; the poor grow poorer. The middle class are hit hard and the standard of living drops. Crime and violence rise, as does the use of drugs and alcohol, and the family unit begins to fail.
If you pay attention, you can see the changes throughout society and culture. Music becomes dark, as does literature. Sects and cults arise as people search for truth. Anger generally rises through all levels of society. Young people, losing hope, become alienated and drift to the edges of society.
The Crisis Crests
Finally, the cycle crests. Population dramatically decreases amid economic collapse and the rise of pandemics. Prices fall hard, along with rents, and interest. Spiralling deflation sets in. Prices stabilize for a short time before declining further. Governments and banks fail and civil war and revolution break out.
Eventually, prices hit a bottom and began to stabilize, wages began to rise in real dollars (money in a deflationary environment rises in value, while asset prices are depressed). Times begin to improve for laborers, artisans, and ordinary people. Families grow stronger and crime begins to subside. The use of drugs and alcohol decreases. Democracy begins to strengthen and freedom generally increases.
A new cycle is underway.
This pattern unfolds in the same manner throughout each 172 year cycle.
The most recent cycle top was in 2007, when we began the so-called Great Recession. The only reason it didn’t culminate in an even greater depression was due to central banks buying mortgages and injecting vast quantities of money into the financial system (in other words, banks). Central banks also lowered interest rates in an attempt to re-inflate. It always fails.
The problem with lowering interest rates is that this is how banks make money. Because the economy hasn’t been strong, there haven’t been high demands for loans for either housing, or corporate financing. As a result, banks are not doing well. If there’s a spate of mortgage failures, which there’s bound to be, banks will have “nowhere to hide.”
Once the banking system and stock market collapse, virtually everything else is going to go with it. This is what happens in the crisis stage of 172 year cycles. It’s happened in every cycle since there’s been an economy of any size. You can cheat Mother Nature for a short time, but she always wins in the end.
____________________________
Sources
- The Great Wave — David Hackett Fischer
- Secular Cycles — Peter Turchin and Sergey A. Nefedov
- Climate: The Key to Understanding Business Cycles (Wheeler) — Michael Zahorchak
- The Unified Cycle Theory — Stephen J. Puetz


outstanding, gann would be proud of your work
Thanks. It’s simply putting the work of a few tireless researchers together … but still much more to do.
Hi Peter,
what a well-founded story. It confirms things that I have encountered in the past 15 years, but now related to each other. Super! I am going to send a link to my Dutch acquaintances.
Thanks, Willem.
I’m very appreciative of your YouTube and website videos and blogs. All things financial, especially the Stock Market, investing and trading, not only are so far above my expertise (I work in Health Care) but they scare me.
Would you blog especially for us befuddled non-experts, how to survive FINANCIALLY through the coming depression?
-Do we cash out our 401k’s and savings, buy gold or keep it as cash? Or leave it invested and hopefully reap the benefits of the next upswing? I do understand to not buy into housing right now until after the collapse.
-Is “prepping to bug out or bug in place” important, as in get a years supply of food and water for both the financial collapse and coming global cooling?
-Do we need to move “south” to survive the coming global chill? Please Help!!! My sincere thanks for any advise you offer???
Hi Debbie,
The answer is “yes.” I have some issues to deal with this week (mostly taxes … lol) and then my main focus will be on a webinar called Navigating the Crash, which will cover off almost all the items you mention. I will also do some blogs on this going forward. As the market is topping (the crash likely won’t happen until fall), there’s time, but it’s starting to get important to prepare.
I’m also working on a book to have out by fall on “how to profit from deflation” which will be all about the money aspects of what’s coming.
Thanks very much for the comment and the list of concerns. It helps me greatly in preparing both the webinar and coming blob posts.
Peter
I eagerly await both your upcoming webinar and book. Hints, tips, suggestions and advice about surviving whatever happens is truly needed and wanted , certainly by me. When it’s ready, would you please post instructions for viewing your webinar, when it will occur and how to watch, and will it be replayed on YouTube. And let us all know when your book is finished and ready for purchase. It is more productive to focus on doing specific tasks for surviving and maybe even thriving, instead of feeling helpless, hopeless and fearful. Thanks again for all your great resources and also for ones yet to come. Debbie
What are you targets for USD/CAD for the long term? Over the next 5 years would I be better off holding cash in USD or CAD as a Canadian?
Ralph,
This is a very good question and is sparking me to write a blog on this subject this week. The US Dollar has another wave to the downside to go (a new low) and then it will turn up and head for a new high. We’re heading for spiralling deflation, as we’ve experienced in every single depression in history. What that means is that currency will go up in value. However, the Canadian dollar will go down in value relative to the US dollar.
That’s because the US dollar is still the reserve currency and when countries default, creditors will want to get paid in US dollars. Credit is going to dry up at the same time, leading to a huge reduction in the amount of US currency out there. Demand will rise and supply will fall. That’s deflationary. But it causes the value of the US dollar to sky rocket.
So, the answer is that for the next few years, it will be more lucrative to keep your cash in US dollars. Where you keep it will also be important. The big six Canadian banks have already been downgraded and there have been warnings about Canadian banks and the economy from both the BIS and IMF (the latter, the more important). So if, you’re in Alberta, which has a public bank (ATB). Otherwise, I’d be thinking about a safe or safe deposit box longer term.
Banks are essentially mortgage holders. Canada has arguably the biggest real estate bubble in the world (Australia’s right up there with us) and the largest household debt in the world. When mortgages fail, and investments crater, look out below. We’ll be losing some of our big six banks, for sure. It takes a while for mortgage defaults to work through the system, but when the banks start talking about “everything is just fine,” that’s when you want to start worrying.
The CDIC, which guarantees Canadian banks deposits, is grossly underfunded. Canada is one of only six countries in the world that doesn’t regulate the level of reserves our banks keep on hand, a big red flag.
Hope this helps.
I have a question in which I hope you can answer Mr. Temple. At what point does the Elliot Wave Cycle starts and how can we plot the progression of civilization prior to the opening of the stock markets in England and the US? Furthermore, is it possible to predict the economic cycles of Corporations before they issue a IPO on the stock market? I recently found your website and its a treasure trove of fantastic information. Thank you.
Omar,
Thanks for the kind words. This is a short question with a relatively long answer, but I’ll try to give you my thoughts.
The Elliott Wave cycle, which is a price cycle, pertains primarily to the stock market. While the stock market as we know it began to be tracked in the 1700s, you can track grain prices back through the centuries, and in China, they have records going back thousands of years. Five wave trends are throughout society and the economy, but volume and data accuracy are important in being able to identify the subwaves of a 5 wave move. The crypto currencies, for example, as also following an EW pattern, and suggesting a top at the same time at the US indices top.
In terms of accuracy of cycles and tracking economies back through time, Stephen Puetz’s book, The Unified Cycle Theory, is an important one to have in your library. I am behind in adding a couple of newer books on economic waves throughout history, but I’ll have those added by the end of this weekend. My book recommendations list is here: https://worldcyclesinstitute.com/books/
In regards to tracking the life expectations of corporations, you can do this if you have access to sales data, for example. Edward Dewey, in his 1947 book, Cycles, spent chapter 12 on this very subject.
Hope this helps.
Mr Temple thank you for answering my questions. You’re the first person who has provided a logical solution in overcoming the dilemma of mapping out the progression of civilization and counting the waves of corporations that have recently issued a IPO. I will read the recommended books listed on your website, hoping one day I can have the same knowledge as you. Once again, thank you Mr Temple for responding back to me.
Omar … You’re welcome … and “Peter” is just fine. Mr. Temple was my father … lol.
I was lucky enough through trading and my association (for a short while) with the Foundation for the Study of Cycles, to run across the work of Dr. Raymond Wheeler (I write about him in other posts on my site). He’s the one that put it all together. The other luminaries I’ve studied worked in their own fields to discover much the same information. I’m attempting to put it all together in one book.
It’s fascinating stuff.
I didn’t get those two additional books on the site, but I’m working on it now (I’ve been dealing with website issues for the past few days).
Haha:) From now on I will refer to you as Peter.
This site is packed with fascinating information. Initially when I listened to your commentary on Dr. Raymond Wheeler on his take on climate change my eyebrows were raised. This is because in Britain we are taught since secondary school how global warming is a product of human activity. The media, academics, celebrities and governments have all peddled this idea. Showing any contrarian opinion to this school of thought would label you as a crackpot.
But conventional wisdom doesn’t necessary mean its correct. In the western hemisphere the lobbying power for green technology is tremendously strong and the industry is easily valued at hundreds of billions of dollars. So naturally the various stakeholders would want to hoodwink the masses to maintain the status quo. I can’t make a decision on which side is correct as my knowledge is rather weak. This will change though in the future.
I will purchase Dr Raymond Wheeler’s book and study the material inside. I have great respect for those luminaries who have spent there entire life of trying to unravel the mysteries of the universe. I hope you can complete the project of writing a book on this subject.
There’s another individual who also believed in cycle theory and his name was Mr Sanjin Hosoda the creator of the Ichimoku Kinko Hyo indicator. He spent more than 30 years with 2000 students helping him to verify his theory. He believed the market has cycles of 9, 17, 26, 33, 42, 51, 65, 76, 83, 97, 101, 129, 172, 200-257.
When such cycles failed to meet the criteria then he proposed the principle of equalization. The indicator itself is useless in my opinion, but according to Mr Sanjin his three core theories were Time, Price and Wave theory. Unfortunately most of his work is written in Japanese and nobody has taken the task to translate it into English.
Hi Omar,
Dr. Wheeler’s book is expensive and hard to find … you’ll only be able to get a second hand copy, but it will open your eyes. I would also suggest Stephen Puetz’s “the Unified Cycle Theory” – will provide all the probabilities for you of cycles since the beginning of the Earth. It’s fascinating.
The main cycles, as far as I’m concerned, are harmonic (x3 for the next higher). 7, 18.5/19, 65, 172, 515, 1030, and 1500. There are longer ones that you’ll find in Puetz’s book.
To explain anything, in terms of propaganda, you only have to follow the money. It’s always about money. (climate)
Stay healthy, keep learning and you’ll find out how much you don’t know … haha.
Dear Peter I just ordered
steven Dewey’s book The unified cycle theory on your recommendation.
We experienced a 200 hundred year flood here in the walton/Hancock (Catskills)
NY in 2006. Going by a 18 year cycle, an we expect another heavy rain in about 2024. Thank you Peter for your important climate cycle information. Warren Schaich
Hi Warren,
I think you’ll enjoy it. It’s a bit on the “technical” side, but Steve did a thorough and exhaustive job of legitimatizing cycles. Yes, as you know 18.5 year cycles are lunar nodal cycles, a rainfall cycle, and also a real estate cycle.
Stephen Puetz, who lives in Hawaii, is the author.
I’ll have more articles on cycles (and more videos) in the coming weeks.
I have a question regarding the wave principle. In Elliot’s original book “Nature’s Law” he spoke about a pattern called the AB Base. This pattern was disregarded by Prechter and Frost. In your opinion is this pattern valid in the Elliot Wave Principle? I’m surprised there hasn’t been more discussion on this issue. Thank you once again for educating the public with your knowledge.
Hi Omar,
I had to go look it up, because I didn’t remember it in Elliott’s original work. I’d disregard it, too. He spent little time on it, with good reason, imho.
What he refers to as an AB base is a small wave at the start of a corrective wave (an A wave, with B wave in the opposite direction), followed by a C wave of 5 waves. It results in a very simple ABC corrective wave. If you took apart the small A wave, it would either be in 3 or 5 waves (the number isn’t important).
I don’t know why he singled it out as being “different.” It’s not. It’s so common in the market, and comes in so many different sizes (versions), that I think a label for it is counterproductive.
Hope this helps.
Thank you Peter! Upon reading the original book I was confused about the AB base pattern. But you have cleared this misconception with a precise explanation. I have also started reading Edward Dewey’s book “Cycles: The Science of Prediction” and it does open up a new world. Once again thank you.
Dear Peter,
Elliot wrote in his book the different types of corrective patterns that occur in the market but he never mentioned there Fibonacci retracement and Extension levels. Therefore when Robert Pretcher observed that a wave B of a Flat can retrace to a 1.382 percent level was that based upon his opinion or the guidelines issued by Elliot.
Furthermore, Elliot wrote about the fractal nature of the market, however sometimes when we have a clear trending market the internals don’t adhere to the rule of a five wave structure. A good example is the SPX 500 in October 2009. Its almost impossible to count its internal structure as five waves when it looks too choppy. Therefore, can there be more than one variant of an impulsive structure?
I took this idea from Ian Copsey who wrote about harmonic waves and Glen Neely who said a Diametric pattern can occur. I just want to say I love Elliot wave, the man was a genius. someone who should be regarded more highly in the finance world.
Omar,
Not true about the internals of a trending impulsive market. You’ll have to provide an example, and it’s not October, 2009, which is part of a B wave, a corrective market. If waves are too choppy, obviously it’s not a trending market. Never understood Ian Copsey, who was mostly wrong when I sparred with him and I don’t understand any of Neely’s work — how to complicate EW.
So, I’m not sure what point you’re making, particularly about the flat.
Dear Peter,
Thank you for responding to my questions. Pretcher mentions in his book on page 89 that the guideline of a wave B retracement of a Flat is usually between 100-138 percent of wave A. This observation was never mentioned by Elliot in his book. Therefore, in your opinion can the retracement of wave B exceed the 138 percent of wave A and sometimes target the 161.8 percent instead. If such a case existed would the pattern still be regarded as a Flat pattern?
A number of Ellioticians have labelled the SPX500 bull market since 2009 as an impulsive wave structure. However when I looked at the internal structure on some occasions it looked too choppy. Does that mean wave IV didn’t finish in 2009 and are we still technically in a correction phase? I always thought a 9 year correction phase was too short but most people who claim to use Elliot Wave thought differently.
Ian Copsey explained in his book that the impulsive wave structure should be 3 waves rather than 5 waves because Elliot took inspiration from Dow Theory The problem I had with his book was how can we tell the difference between a corrective structure and impulsive structure if the market always moved in 3 waves. I wanted your opinion since your knowledge on the markets and finance in general is tremendous. I just wished you can do more video’s on youtube:)
But based upon your observation if we have a choppy market then it can’t be impulsive. Cheers for clearing that up. The video below issued by Elliot Wave International is a count on the US Index Market. They have labelled the daily bear market as a five wave movement. This seems quite clear however the internal structure of wave 3 is too choppy.
https://www.elliottwave.com/Currencies/The-Optimism-of-a-Dollar-High?rcn=comem082318clubez&tcn=EZIND&sc_camp=3DBF56B7710F4BAB9A9B4410FADAC80F
Hi Omar,
I’ve done a lot on the flaws in the book (and there are many). You can find it here: https://worldcyclesinstitute.com/a-pending-top/
Regarding flats and 138%. I’ve never seen it exceed that proposed limit, so I’m not going to dispute it.
My analysis of the B wave is here: https://worldcyclesinstitute.com/elliott-wave-the-long-term-corrective-scenario/
Elliott considered a B wave possible. Prechter did not, for some unknown reason, but he made changes to Elliott’s work, with little to back it up. I’ve researched all the charts in Prechter’s book and most of the inconsistencies are in this article. There’s a whole lot more in the area of fibonacci relationships that I’ve learned that is not in the book.
I find people like Copsey and Neely have invented their own “takes” on EW, possibly due to their inability to see patterns, or a lack of time really studying EW. I’ve spent over 20,000 hours watching the market from an EW perspective and discovered quite a few nuances and rules that aren’t in the book. EW works just fine and is a science, imho. If I go in with an objective mind, then I am seldom incorrect in my calls. But, as I’ve said before, I have a bit of a gift. I go right off the charts when tested for the ability to mentally manipulate three dimensional objects, so patterns come very easily to me. I can tell you if a wave is motive or corrective just be looking at it (most of the time). Therefore, my mantra is: Trade what you see, not what you think.
I have Neely’s book and put it down after about the first chapter. I have no idea what he’s on about – needlessly complicated. Haven’t read Copsey’s, but sparred with him for a few months in a forum and eventually gave up making sense of his perspective. EW is NOT broken; it’s just fine. It’s the analyst that’s always the weak link, imho.
As far as EWI goes, as I’ve said many times, if I have the same count as them, I get worried that I’m incorrect. I’m not kidding. The way they label their charts is often criminal.
And here’s the B wave and long term (500 year view) on one page. https://worldcyclesinstitute.com/a-complex-wave-nears-an-end/
Dear Peter,
Thank you for providing an explanation to my question. I’m glad you’re upholding Mr. Elliot legacy instead of discarding his rules or guidelines. In my opinion he should be regarded more highly in the finance world. Instead his theory is ridiculed and often labelled subjective in forecasting the markets. People in general are lazy they expect everything to be given to them on a silver platter. Hence when they make a mistake they blame the theory rather than their incompetence.
The first link named a ‘Pending Top’ opened my eyes. I presume you were talking about Daneric. He certainly has labelled the bullish uptrend on the SPX500 as an impulsive wave structure. Tony Caldaro issued a similar sentiment. The reason why I thought the market was impulsive was because I use the Eight Path Method invented by Joe who took inspiration from Dr. William’s work. The first link contains his methodology and the second shows his Elliot Wave count on the SPX500.
http://studyofcycles.blogspot.com/2016/01/the-eight-fold-path.html
http://studyofcycles.blogspot.com/2018/06/patience.html
When I read the motivewave quiz I was shocked. I never knew an impulsive sequence requires a valid second wave that retraces 62%. I thought this was just a guideline not a rule set in stone. This would mean Joe’s count is wrong. On his chart the second wave had a 38.2% retracement, the fourth wave didn’t even touch the 38.2% and it doesn’t even have the right look of an impulsive structure.But when the market looks bullish people use their bias to force a count. EWI have claimed for a number of years that a shallow wave 2 can exists because it alternates with a deep wave 4.
Point one in the motivewave quiz can take the subjectivity out of the Elliot Wave theory. I always wondered what is the wave personality difference between an impulsive wave and a corrective wave such as a zigzag and you have answered that question wonderfully.
I always assumed when Mr. Elliot mentioned the concept of an irregular top he was talking about the expanded Flat pattern since the internal structure was 3-3-5. In your opinion and extensive experience what is the Fibonacci retracement level of an irregular wave B? Currently its touching the 238.2% zone from the wave A marked on your chart.
Mr. Elliot also spoke on the idea of a double retracement occuring once an extended fifth wave was completed. This was disregarded by Prechter but I know Mr. Edson Goud who tried to copy Mr. Elliot’s work based his three steps and stumble philosophy on this idea. In your opinion should we keep this rule?
Finally one last question. Do you agree with Pretcher’s idea of giving the complex wave sequence a WXYXZ notation. In the book he said each of these complex waves must represent a standalone pattern from the correction wave family. But Elliot never made that clear in his writings.
I agree Glen Neely view on the EWT is confusing. I was scratching my head when he talked about monowaves and polywaves. He doesn’t often use Fibonacci in his wave count. According to him the original principal is invalid in today’s market because of high frequency trading. He also said because Prechter made the theory accessible to the public its potency has decreased as the market operator institutions have taken countermeasures. Glen Neely has included 3 more new patterns. I have read Ian Copsey’s book hence I wanted your opinion on the matter because it was more sound than Glen Neely’s work.
Peter, I just want to say thank you, for showing consideration in answering my questions. When I first came across Elliot Wave it struck a chord inside my brain especially when Mr. Elliot mentioned the world is governed by a higher order and where there is chaos we have order. I still have a long road to understand his theory, but I won’t stop until I have mastered his work. Your knowledge is astounding I can tell you have studied the markets for years. You have kept Mr. Elliot’s legacy alive and haven’t introduced your own bias into the frame. I’m sure Mr. Elliot would have been proud of your contribution. Elliot Wave will continue to be stigmatized negatively because of its association with Prechter and his book. Therefore, I hope one day you can write a book to guide the next generation of Ellioticians.
Hi Omar,
Thank you for the kind words. It’s wonderful to find someone who holds EW in such high esteem, as so many don’t. It’s only subjective when the analyst brings bias to the table.
There’s a lot in here and I may not be able to address everything, due to time constraints. But I’ll try to work through it.
I don’t know who Daneric it. The wave up from 2009 does not meet any EW rules or guidelines for an impulsive wave. Plus the count was complete at 2007. If this was an impulsive wave, we’d see a much deeper fourth wave in the SP500, for example. At some point, we would need to see a wave four retrace of 38% of the entire structure, which we haven’t had. And the subwaves don’t have 5 waves. As far as I’m concerned, the case is closed on that fact alone.
And then there’s “the right look,” which the wave up from 2009 certainly doesn’t have.
The 62% “rule” for a second wave isn’t a rule in the Elliott Wave Principle. But find me as example of an impulsive wave that doesn’t do that. Same with a 38% retrace for a fourth wave. It’s never NOT happened, as far as my research shows. Prechter wants this to be considered a science, and yet he has loosy-goosy events called truncations, which would mean that this science can fail at any time. Well, I’ve never seen a truncation, and as I’ve shown, the charts in the book are not valid examples. Prechter’s group breaks the rules over and over again, and that’s why their counts seem more often incorrect.
In answer to your question about the wave B measured top in SP500, on a log scale, the 4.23.6 extension of the A wave (top at about 1200) is 3000. There’s a fib level 200 points above that which is also an option. But I think 3000 is more realistic.
I don’t remember an Elliott reference to double retracement and I’m afraid I don’t have time to research it at the moment. I doubt it’s a rule or guideline. I may be more an observation, but I could be wrong, as I simply don’t remember the reference.
I agree with the WXYZ labelling. It’s simply a way to separate out the different structures in combination wave to make them clearer — no magic there.
Regarging fibonacci in the market: The distance between the planets in our solar system averages out to 1.618. The golden mean is in everything. In the market, it defines the lengths of both corrective and impulsive waves in any market (that I’ve studied). To not use it is losing a key tool in prediction.
I still have the plan to finish a course first on EW and then perhaps a book. This market has been so difficult to analyze since January, that it has gotten in the way of those plans — my analysis has taken far more time to complete on the ten or so assets I cover daily. Hopefully, that will clear up with the coming C wave downturn, which will get all these asset classes “on the same page” … finally. This seems to be the turn that will finally get them all moving in lock-step.
Andy finally, I haven’t noticed the influence of high frequency trading on anything having to do with EW. EW is a natural phenomenon. It’s the movement of the Universe exerting its power through electromagnetic waves (or something of a similar nature), imho. There can be no other explanation when day after day, the market repeats the same structures over and over again, with waves that are the proper fibonacci lengths, with very few exceptions that I can find. Those relationships are sometimes very hard to find, due to the complexity of some patterns, especially around tops and bottoms.
But then on a grander scale, history repeats over and over with periodicity. That’s where my focus is at the moment. It’s fascinating to see the same patterns over and over again over hundreds of years.
Thank you for taking the time to answer my questions. God bless you.
Hi I m counting in here to comment that as one interested in astrology cycles and losing interest, until these larger 172 cycles were mentioned. Your work is filtering down and I too would be interested on how to cope with whatever is ahead.
I am to understand it is actually illegal to hold at least gold, silver in safety bank boxes out of flow, and that they can inspect and u required to sell here in Canada.
It is written in bank policies and some workers don t seem aware while some are.
I m a little confused about where we re at now but I certainly felt the change in 2007.
Hi Charlotte,
To my knowledge, it isn’t illegal to own gold or silver. I would be nervous about leaving it in a bank safe deposit box, depending on the bank, as if they go under, you’re likely to lose the metals, as well. The 500 cycle top was in 2007 and central bankers, as you likely know, created a whole bunch more debt to keep markets up and the economy somewhat rolling along, although the tires are now next to flat. We have about a years and a half to the final stock market top, although it’s going to be a rocky road even before we see the top.
I am putting together another webinar on the subject in the next month and will be announcing on my site and elsewhere, if you’re interested.