
The Elliott Wave Principle and Probability
The Elliott Wave Principle is a theory based upon probability. A common definition of “probable” is “a reasonable amount of suspicion, supported by circumstances sufficiently strong to justify a prudent and cautious person’s belief that certain facts are true.”
There’s a very good dose of science in it. The patterns repeat over and over again: In motive markets, they move in the same order, in corrective markets, not so much, but there are still rules that cannot be broken. Fibonacci ratios run all through the market and this is another scientific aspect of Elliott waves.
So the secret to success is to determine the current wave count, and based upon the rules of how waves have historically moved (the consistent cycles that play out in an extremely accurate manner), determine the next probable move. There are many times that multiple possibilities are on the table, however, more often than not, the signs are very clear as to the current position of the market within the wave structure. Using fibonacci measurements, both the direction and the target for a move often rise to a level of very high probability. It’s seldom there is more than one “correct count,” in my experience.
The weak link is the analyst and his/her ability to analyze wave patterns and structure. The successful analyst must not inject subjective thought into the wave structure. It’s critical to analyze patterns down several degrees of trend to truly account for wave structure. Most waves have pre-defined targets they must hit in order to confirm the count. Most analysts I know of do not do the work (or don’t understand the finer requirements of certain patterns) to definitively reduce the risk of an ultimate “call” being incorrect. This is the major problem with Elliott waves—not the principle itself, but the lack of skill of the analyst (or the lack of attention to detail).
The Current Count
The count has not changed in ES/SPX. We’re waiting for the top of the third wave. It’s very close.
We’re jumping through a series of hoops as the US dollar finds a turn point. Everything hinges on what the dollar does. It’s the reserve currency (still) and it will determine the overall economic conditions. As the dollar bottoms, we have a bit of reflation happening. As it turns and heads up, we’ll see deflation finally take hold. Deflation always wins; it has throughout history with no exception.
As I’ve written before many times, as the value of the reserve currency rises, it leads to deflation. The dollar for the past few months has been a particularly easy asset to analyze (at least, for me).
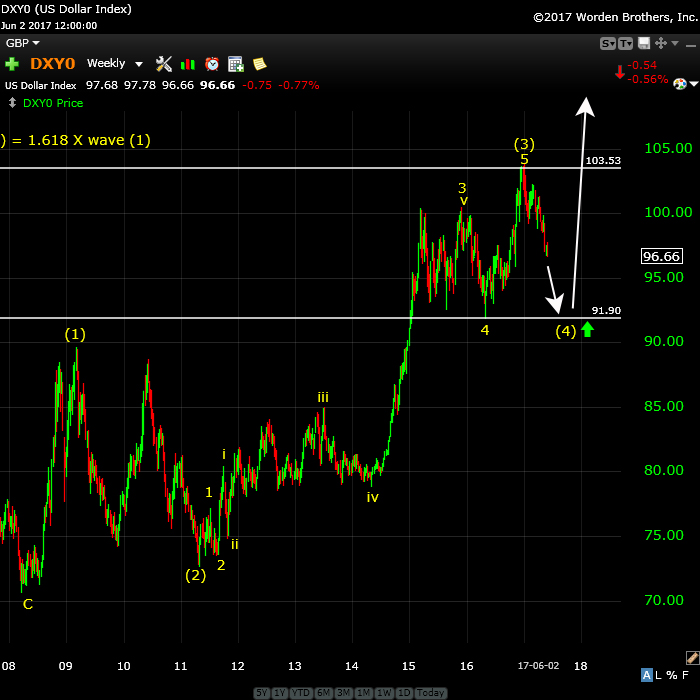
Above is the weekly chart of the US dollar. I had called the obvious top at ~103.53 and projected the drop to the previous 4th wave low of one lesser degree. I’m projecting that point to also be the top of the US indices. I’ve presented this before and the information was not well received. I was told there was no correlation. Well, there is, has been, and will continue to be.
It’s only logical that all the assets that have been moving in more or less in tandem (after all, they’re all related to each other by the US dollar!) for the past year and a half will reach a projected top (or bottom) all at the same time. I suggest you pay attention to that very obvious (and logical) phenomenon.
A Higher Tide Floats All Boats
Last week, I summarized a very important aspect of this current top. Some of you “got it” (and we had subsequent clarification in comments back and forth) and some of you obviously didn’t. I’d even bolded the heading of the section:
________________________
Another technical signal to pay attention to:
As well, there was the non-confirmation between some of the US indices. The SP500 has previously gone to a new high, while the NYSE and DOW had not. While others thought that this non-confirmation was OK, the market has proved once again that it is not, as all the major indices are slowly reaching up to exceed their previous highs. Both these indices are likely tracing out flats as well (most likely regular flats, as opposed to the “extended” type).
I have always maintained that once one index tops, they all have to (so that they stay in sync). I had let that personal guideline slip from my analysis, wherein it should have been a big red flat (and something for you to keep in mind for future). I’ve not seen it fail yet.
________________________
This week, we completed this important step. We have one more to go: a major turn of just about everything associated with the US dollar.
All the Same Market
I’ve been mentioning for months now that the entire market is moving as one entity, the “all the same market” scenario, a phrase that Robert Prechter coined many years ago, when he projected the upcoming crash (although he and his group don’t seem to be paying much attention to it now …).
We’re starting to deleverage the enormous debt around the world. Central banks are losing the control they had and we’re slowly sinking into deflation world-wide, with Europe in the lead.
The US dollar is fully in charge of both the equities and currencies markets. They’re all moving in tandem, as I’ve been saying since September of 2015. For a short while, currencies were moving contra to the US market, but for the past several months or so, they’ve been moving together. The EURUSD is very closely aligned and will likely trace out a fourth wave as the SPX traces out one, too.
All the currency pairs will turn at the same time as the US indices for this fourth wave. Even Andy Pancholi has alluded to this, but he didn’t get the date correct. It is still to come. This is the final hurdle.
Dating of the Blog Posts
I complete the free blog posts on the weekend and do not update them during the week. Obviously, during the week, the information that the market imparts can change. My Traders Gold subscribers get the full story with targets and suggested action to take across the US indices, USD currency pairs, gold, silver, and oil.
This website is first and foremost a business. I do not provide the entire picture in the free blog post. My subscribers get a much fuller picture. But I suggest you read all of the blog post.
Fibonacci targets can change. If one is met, the market can reach for the next one. In the case of this past week, Traders Gold members had that additional target. I am not going to update mid-week changes in the free blog.
A true expert in Elliott Wave FL 2
A true expert in Elliott Wave …You are a true expert in EW analysis. What you provide is not available anywhere and is priceless. Subscription on your services is the best thing I have ever done. Many thanks for your effort to make me a better investor. I now have more trust in my investment decisions. I hope you will continue the excellent work! —FL |
The best of them JL 2
The best of them …Last couple of years, I subscribed to several ‘market traders’. You are by far the best of them and the personal contact is awesome. Daily and daily updates are very well written! Besides your expertise in EW, I also like your cycles analysis. Best investment I ever made! —JL |
Have not had a losing week RW 2
Have not had a losing week …I have been with Peter almost a year. The only thing that matters is have I made money with his service. I think I have finally turned the corner using Peter’s EW. I have not had a losing week in the last 5 months. Thanks Peter, for your amazing amount of hard work. —RW |
the real deal SM 2
The real deal …‘Educational, insightful and thorough market analysis for all levels of traders. It’s Elliott Wave at its best….Peter Temple is the real deal’ —SM |
Tops in your field DZ 2
Tops in your field …You are tops in your field. Tried to follow Elliot Wave international for years. They were always behind the market. After discovering you, I perceive that you are an expert in reading the waves, which puts you way ahead of the rest of your peers. And you can read the Waves like you are reading tomorrow’s financial section. I pray you stay healthy. —DZ |
Rise above the rest … SM 2
Rise above the rest …I have only ever met a few people who, in their chosen fields (astrology, medicine, music, martial arts, technical analysis), rise above all the rest and you are one of them…you have ‘the gift’…and that’s why I’m a Trader’s Gold member. —SM |
Get an upper hand … JC 2
Get an upper hand in trading …Seeing all the different currency pairs and the wave structures and hearing you explain why this has to do that on a nightly bases gives one a upper hand when trading. Elliott Wave applies to all stock and indices and can be applied to any candlestick chart. If someone ask what you want for Christmas – Tell them a membership to Peter’s “Traders Gold!”—JC |
Couldn’t be happier … KK 2
Couldn’t be happier …The analysis and insight you provide is simply amazing! I’ve been trading the futures and equity markets for well over thirty years and usually average around 5% monthly. Since joining your Traders Gold Service two months ago, that number has better than doubled. I couldn’t be happier.—KK |
The Market This Week
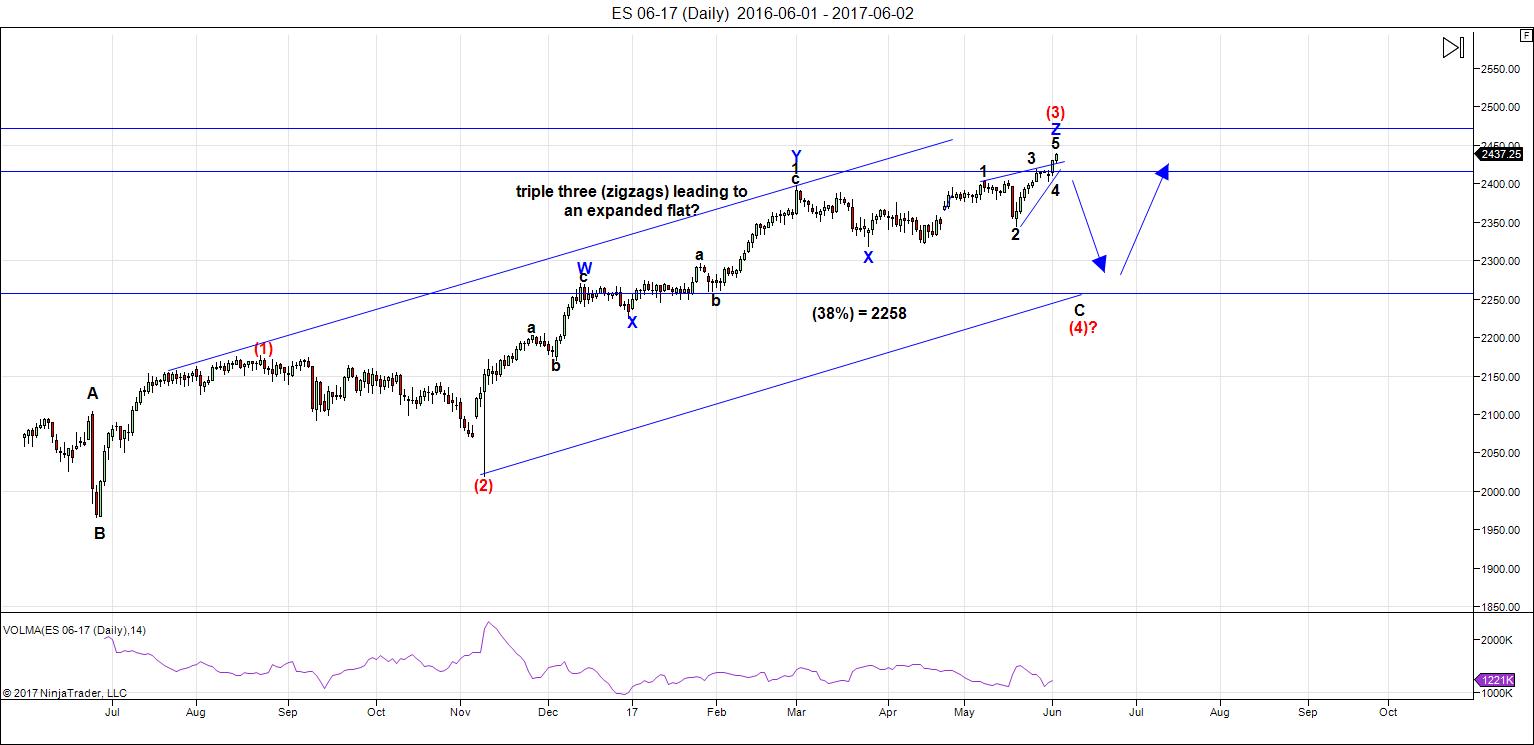
Above is the daily chart of ES (click to enlarge, as with any of my charts). The count has not changed appreciably. What appears to be a third zigzag of the third wave (you can only have three patterns within a corrective wave—this third pattern starts at blue X on the chart) has continued slightly higher and continues to build a potential very large expanded flat at the top of the circle red third wave. The top of this last wave has now formed what looks like an ending diagonal, and that is also very close to a top.
Last week, as I mentioned above, I warned that the DOW and NYSE still had to top. That step was completed this week. Now we're waiting for the USD currency pairs to hit their targets. Everything is going to turn at the same time. It takes time to turn around an ocean liner.
Summary: We're completing the third wave in ES with a possible expanded flat. Look* for a turn down this coming week.
After completing the larger fourth wave, we'll have one more wave to go, which could be an ending diagonal as a fifth wave. The long awaited bear market is getting closer.
* When I use the words "look for," it's the same as "watch for," as in "Watch for a tornado in the western plains area this afternoon. The conditions are right." It doesn't mean we're going to have a tornado, but you should be on the alert, just in case we do. It applies to my call for this week, as well. I'll leave you to debate the turn date, but the conditions are just about right for a turn. However, as I've stated above, the USD currencies must reach their targets as a pre-condition of the turn.
______________________________________
Sign up for: The Chart Show
Wednesday, June 14 at 1:00 pm EST (US market time)

The Chart Show is a one hour webinar in which Peter Temple provides the Elliott Wave analysis in real time for the US market, gold, silver, oil, major USD currency pairs, and more. You won't find a more accurate or comprehensive market prediction anywhere for this price.
Get caught up on the market from an Elliott Wave perspective. You’ll also get Andy Pancholi cycle turn dates for the balance of the current month. There’ll be a Q&A session during and at the end of the webinar and the possibility (depending on time) of taking requests.
All registrants will receive the video playback of the webinar, so even if you miss it, you’ll be sent the full video replay within about an hour of its conclusion. For more information and to sign up, click here. NOTE: the weekday and time have changed - to Wednesdays.


Peter’s Wave 4 ES target – 2258
SPX Weekly EMA52 – 2260
SPX Monthly EMA13 – 2283
Thank you for the updated count Peter.
Nice throw over on the possible ED.
Looks like both the ED’s inception and the 200 dsma around 2267.00.
🙂
Interesting about the 200 dsma. You know enough to know that the final wave of the ED isn’t in 3 waves …. yet.
I went back and checked to see if wave four headed back into wave one territory and it certainly did. I didn’t look too carefully at the structure of wave five (other than the 1,3 throw-over) but assumed we had some wave compression going on as it approached the end. I will take another peek…. 🙂
Hard to read the sub-waves so I took another approach. Wave three looks to be about 65 points and wave five has to be equal or shorter. It seems a fairly safe assumption we have a max upside potential for wave five of about 30 points to about 2470.00
If all the projections for a top around 2500 are correct, we should see a decent decline and a short swift final wave up.
Next week should be fascinating. The banksters of late seem determined to resist anything more than a single day decline in these markets. It will be an interesting contest between EWT and bankster shenaigans. Who will win?!
2470 area should definitely be a target. For me that would start the wave 4 down that Peter had mentioned.
Consolidation today so that upside target very likely. The market is difficult to gauge as a five wave decline recently has not indicated the start of a new down-trend. While I do not believe intervention can ultimately change the larger trend, it is impossible to deny relentless short-term arrests of initial market declines issuing in these complex and unpredictable wave forms. Very tough for traders. If Peter’s ED is right, and I must admit it has a bit of disproportion in the second and fourth waves so not quite the “right look”, the 2470 area would be a good candidate for a nibble on short positions. EDs are also tricky in that they can fool you in not reversing immediately as they normally do after the throw-over. We saw this with bonds last Summer. Once they do reverse though, the retrace is swift and brutal so that is what I would expect to see here as well if we do have an ED. The longer the meandering persists the more likely it is that something else is going on.
2470 area could also provide us with a very significant pullback.
Verne,
Allow me to continue the A/D line discussion! I am quite sure you understand this but for others…My questio…Wouldn’t the indiscriminate buying of all stocks that are components of an index whether they are making money or losing money lead to a distortion in the A/D line?
A big portion of the stocks making new highs would not “be purchased” in the like amount if they were not part of said index. In the case of the Russell 2000 stocks
Per John Mauldin’s “FrontLine Thoughts” currently 30.7% of Russell 2000 stocks are losing money…but are enthusiastically purchased in the current ETF and Index funds not because of good fundamentals but because they are part of a particular ETF or Index.
My point…it seems to me…many stocks are making new 52 week highs without the merit of underlying fundamentals. Wouldn’t that create the “illusion” of a broad market advance? I do not know so I am humbling asking! Does not make sense to me.
Another point made by John Mauldin’s is that 30% of stocks that make up the Russell 2000 are owned inside of an ETF or Index fund by smaller investors. Another 20% of the Russell 2000 stocks are owned within Index created funds by very large institutional investors.(think large corporate pension plans and public plans). So 50% of Russell 2000 stocks are owned without the benefit of “price discovery”.
Am I missing something?
I think that is certainly happening. What is going on now with risk assessment managers in the investing world now is total and full-blown insanity. I had imagined that redemption by retiring baby boomers would have had a bigger effect on the passive investment flows into the market but that could still be a source of money flow, of course in addition to the share buy-backs and central bank such as BOJ’s persistent buying. The buying is also quite focused on specific names, especially in the Nasdaq. The lion’s share of the advance has come from relatively few stocks and the weighting of these particular stocks can certainly mask fundamental weakness in the indices. Probably the most critical thing that has been happening is VIX suppression and the parity trade. An artificially low VIX allows investment managers to not only maintain big leveraged positions, but to continue to buy the market at ever higher prices, seemingly without violating risk management protocol. Some even argue that so much volume these days come from trading bots that this is an algo driven phenomenon for the most part. So I would say yes, that all these factors can definitely skew market breadth analysis and possibly paint a healthier picture than is actually the case. The thing people are forgetting is that if only a relatively few stocks are keeping indices elevated, it is not going to take months and months for those indices to slowly start a process of deterioration but simply a collapse of those specific components of the index, and that, for any number of reasons can happen with dramatic swiftness.
BTW, I recently read about the proliferation of new ETFs and how their preference by retail investors is indeed having the kind of impact you describe.
Thank You for your insight. Your earlier comment that “The top we are seeing is absolutely historic. Unlike anything any analyst alive has ever experienced. I think it is a very dangerous game….” That in my humble opinion will end up being very prescient insight.
Thanks, Peter. Your EW lesson each week is very useful.
tks, Hope so.
🙂
Ed
You make a good point
I’d say based on what your saying that many stock will drop further
Than the index implies .
St the moment I’d say your correct , the etf buying drives bad company stocks
With good stocks higher , yet on the down turn in wave 4 the losers will drop further
And the few companies with decent growth and earnings will hold up better and out performance
In wave 5 .once the market peaks those companies losing money will tank much further again
I can’t rule out a test of 2500 by the end of June yet I’ll watch the spx about 20 points higher
Before adjusting up to the 2500 mark .
June 30 I’m sticking to .
Thanks for the update on the US dollar index Peter as well as the es
Joe
Thank You for your comments. I always look forward to your posts.
Valley,
How does your PALS system look day by day this week. I am thinking if we move below 2430 and stay below it we enter 4th wave down.
Monday to Friday weak on all PALS factors. Only looking to short this week. Week after looks strong.
we can see a sharp drop in next 5 days to somewhere around 2274
Hi Bill. It would really be helpful to forum readers if you would also include, even if briefly, a reason your target projections. I for one am always eager to learn from other posters but that is all but impossible when people make declarative statements but provide absolutely no basis for what they are saying. In my humble opinion, I think this keeps comments more interesting and credible and results in more meaningful exchange. Thanks!
Sure…4 of the best players are aligning with my thoughts
1. Peter T
2. Valley
3. Urban carmel
4. onthemoney
lookup last two guys on twitter… here is another one not sure about his track record..
http://blustarmarkettimer.blogspot.com/
Thanks! I don’t necessarily disagree with your target. I am just interested in learning from other posters what kind of TA they use to generate their projections. I think for example it is really insightful when different approaches yield similar results which is why I am so interested in how folk come to the conclusions that they do. Thanks for the link. I will check it out.
Great article! I am glad I asked!
OBV is in fact one of my favorite and few of remaining fairly reliable indicators and they are right on the money in what they say. OBV has moved up to a resistance line that has repelled upward movement several times previously.
I think other readers are really going to benefit from reading that analysis. Thanks again for the link!
I checked out Urban Carmel and I really like this guy!
The first thing I read is response to someone that says:
“If you have a factual point to make, show the numbers, the chart, the facts. Otherwise it’s just postulation and not very useful. jmo” 🙂
I am curious about their next Bradley turn date which they said was June 9. I thought it was June 20, and was actually thinking that was when we would see an interim low….
How do you like the two on twitter…. no worries sharing an collaborating is must ..still no guarantee to making money in this game
“Today is not just like 1987” – Urban Carmel @ukarlewitz
https://twitter.com/ukarlewitz/status/871831858694074368
“Advance Decline lines confirm new $SPX highs” – James Goode @OntheMoneyUK
https://twitter.com/OntheMoneyUK/status/871787135967408128
https://worldcyclesinstitute.com/usury-comes-to-america/#comment-15858
“…before deciding to buy into Gudgeon’s long-term forecast one should read through his previous articles…not sure if any other forecaster has been more consistently wrong…”
Kinda scary the number of folk out thrre who think thar just because they can stick a number on a chart, that qualifies them to be an EW analyst.
Thanks for pointing out BlueStar is written by Brad as I had not made the connection. If more traders would call out incompetent folk posting wave counts on the web perhaps we would not have so many of them. I have not checked out Brad’s previous calls so if you have a few you noted that you can point out that would be very helpful. I think these guys giving out consistently erroneous counts should be outed. They give EW a bad rep.
Um … I don’t disagree with the last coupla statements. :–)
valley…are you a member of the WCI Forum? if so, please send me a message…there are some interesting things that may correlate with PALS…be well!
Hi Rotrot,
What is WCI Forum? White coat investors?
My little forum that I don’t spend enough time on. If you’re a member, you can private message other members, upload charts and do just about whatever you like.
Peter past the test…yup, the World Cycles Institute Forum…
https://worldcyclesinstitute.com/wishlist-member/?reg=1396740553
passed…duh…
Now forum member, “Valley”.
Rotrot,
Send me a message, I became forum member today. Can’t find your account.
Part 2 of “300 Years of Lies” is live on the landing page of the site.
interesting…thanks for sharing…lived on Saint Simons Island back in the 80’s…have vacationed there over the years…frequently visited Jekyll Island…take a tour if you are ever in the area…great take!
Dr. McHugh has given permission to share his recent article on the Hindenburg Omen with proper accreditation. Enjoy!
https://www.technicalindicatorindex.com/subscribers/guest-articles/Hindenburg%20Article%20June%205th%2C%202017%20McHugh%20backup.pdf
I would be interested in hearing some perspectives of how focused buying in the indices could mask underlying weakness, and give rise to the HO phenomenon, and that in turn lead to devastating market declines, as I had hinted at earlier. It was really eye-opening to read Dr. McHugh’s history and explanation of the omen.
I love Bob’s work. Jason Goepfert of sentimenttrader.com has noticed something of perhaps greater significance with “omens.” When both the NY and the Nasdaq show Hindenburgs on the same day, the results are far more impressive. I won’t give you the exact dates, but we just experienced double double Hindenburgs over the past month, i.e. both the Nasdaq and the NY experienced “Omens” on the same day twice since early May. Here is an idea of the general time zones in the past…Oct ’87, Sep ’89, July 90, Late ’95 (the only significant failure), December ’99, July 07, Oct ’07, Sep ’14, Dec ’14, May ’17, Jun ’17. Nine prior occurrences in past 30 years, eight successful warnings of trouble to come relatively quickly. Perhaps of most significance is that every significant decline of past 30 years was closely preceded by double Hindenburgs. We just experienced double Hindenburgs. No guarantees, folks… 🙂
Peter G,
Thank You for that input! And thanks to Verne for getting the discussion going!
Dr McHugh refined the signal with two additional proprietary triggers which were added to the original three, and greatly improved the omen’s predictive accuracy. He calls it a “confirmed” HO when all five have been met.
Verne, thanks.
For me the double Omen are AMZN and GOOG hitting 1000 last weeks
Lol! The bulls are giddy to the point of being beside themselves! 🙂
But looking at the bitcoin I understand that I can’t imagine the point the craziness may go up to
http://www.investopedia.com/articles/trading/07/hindenburgomen.asp
Called JNUG in last weeks post @ $16.95 on Friday.
It’s approaching $20.00 today.
Above $20.40 I think it has room to run to $30 or above IMHO.
Good call, Jody!
The question now is whether we have topped or we are going to see some kind of extended fifth wave. No serious selling pressure so far, so this could still, amazing as it would appear, be a corrective move.
Added another layer to short position, will take profits if they comey quickly as seems we are in a market that won’t budge. Thursday Britian votes.
Doesn’t look like we will have a down swing…but who knows..may be by EOD friday
It certainly doesn’t. Every impulsive move down being followed by a slow torturous climb that ultimately fills the gap-rinse and repeat. This is totally nuts. Looking forward to Peter’s take at the chart show today.
I’m going to spend some time on silver and gold today and show you a couple of interesting charts relating to them and the next move. Plus a complete review of currencies as they relate to the dollar and US indices.
Backing out of short position with tiny gain so far. This week should be selling based upon PALS and isn’t moving. Sign of market strength. Everyone is expecting something comeying Thursday and so maybe any selling will wait until after Fed rate hike next Wednesday.
Ice actually increasing in Arctic in May, instead of melting. IceAgeNow.info
“The global elites have a secret plan for the next financial crisis.” Rickards goes on to explain, “They are going to lock down the system when the crisis hits. In 1998, everybody wanted their money back, and they printed the money. In 2008, everybody wanted their money back, and they printed the money. In 2018 or sooner, everyone is going to want their money back, but they are not going to print the money. They are going to tell you that can’t have it. They are going to lock down the system and close the banks. Money market funds are going to suspend redemptions. Stock exchanges are going to be closed
My question is: I read the above comment in somewhere. What will happen if I have short position on indices such as SP500 or DJ with broker like IC Market/ Oanda etc in above scenario?
Can anyone share their valuable view please? And how do we make profit in such situation, except keeping physical metal?
thanks again.
Thats why “they” have tied all the CB’s together, control.
Allen
The question becomes what happens when they unlock the system and open
The banks and the exchanges back up ?
They can’t keep everything closed forver
Political suicide , markets collapse and if they do take your money or a portion
Of it to bail in the banks were looking at deflation .
In the mean time I’m still waiting until June 30th before getting short .
Still putting timing model together which is close to complete .
I’d leave my tv off the next couple days if I was trading .
Focus on the chart not the spin 🙂
Joe
Peter G,
You had mentioned early this week that sentimenttrader’s Jason Goepfert’s work emphasized the importance of a combination of the NY and Nasdaq Hindenburg Omen signals were of greater significance than th HO derived from the NY.
Did we get another HO on the Nasdaq this week in combination with the additional HO on the NY? I was not sure if criteria was the same. Could you comment further?
I believe another double HO was just missed on Wednesday, Ed, but the current status remains that two double HOs have been registered since early May.
NYSE missed a third by just two new 52 week lows.
Peter is right in that the confirmed HO is now in play over the next four months.
Peter T,
Do you think we got your turn we were expecting, just wanted to get your thoughts?
yes.
Thank you sir..I thought we have to wait on USD for more time..Awesome so we are probably on a long awaited 4th wave
DOW closed at ATH
This week PALS was very negative. Next week PALS is mixed with greater strength later in the week. So, if Monday is sell off continuation will look to take a small long position (this is June after all, sell in May and go away).
We had new all time highs in many indices this week, as well as a new 52 week low in VIX, so it seems to me the markets were quite strong, especially small caps. Quite a few analysts are looking at this top as being of intermediate degree. I am inclined to view it one degree higher at primary as I suspect by the time the correction is done we are gong to have a lot fewer giddy bulls and all this talk about DJI 50,000.00
Peter, in the ES chart above can you explain why your blue capital Y is not your red (3) from a EW standpoint? If it was, would we currently be in wave 5 now?
I think Peter is seeing the moves up as all being in three waves Jeff and so he is seeing a series of zig zags. Triple threes are not very common but I think that is the reason for the current labeling. If I am wrong about that I am sure he will correct that in his response to you.
Jeff, I explained it in depth this week and last week. Verne is correct. The bigger reason is “All the Same Market.” You can’t look at ES in exclusivity. There are several more reasons.
https://worldcyclesinstitute.com/elliott-wave-the-long-term-corrective-scenario/
Andre’,
Will you be posting an update this weekend? Your update is usually here on Saturday like clockwork! We hope to hear from you!
A new blog post is live: https://worldcyclesinstitute.com/elliott-wave-triangular-oil/
Verne and Peter G,
I went and read both of you posts concerning the Hindenburg Omen signal.
Verne, you mention that the HO per Bob McHugh can stretch out to as much as 4 months. I am assuming you are referring to the NY HO only. Would that be accurate?
Peter G, you brought Jason Gephfert into the discussions adding in the HO on the Nasdaq. I have been aware of the HO for 17-18 years but never relative to the NASDAQ.
Peter G, you mention that the predictive ability of the HO when both the Nasdaq and the NY generate the signal simultaneously…tend to come or could come “relatively quickly”! Are you saying that it is your understanding that previous resolutions have occurred somewhat sooner than the 4 months that Bob McHugh allows for said resolution when you have the simultaneous signals?
Any comments from either of you would be appreciated!
The four months refer to the period after the HO has been confirmed within which the expected matket decline is expected to occur.
Here you go, Ed. Picture=1,000 words…
http://docdro.id/YhLC8Vo
Peter G,
Exactly what these “eyes” of mine needed! Very much appreciated!
This website is for educational purposes relating to Elliott Wave, natural cycles, and the Quantum Revolution (Great Awakening). I welcome questions or comments about any of these subjects. Due to a heavy schedule, I may not have the time to answer questions that relate to my area of expertise.
I reserve the right to remove any comment that is deemed negative, is unhelpful, or off-topic. Such comments may be removed.
Want to comment? You need to be logged in to comment. You can register here.