
The SP500—About Five Miles Out
I’ve maintained for several years that this final wave up in the US indices is a corrective wave. It simply cannot be motive, as it breaks too many Elliott wave rules. But I see so many disregarding the obvious, which is the main issue I have with all the “pretenders”: They don’t pay attention to the details (the subwaves) and so we have all these incorrect counts out there from people who haven’t done the proper homework.
Analyzing markets using Elliott waves is an exercise in attention to subtleties. Below, I’ve placed a weekly chart and below that, an explanation of why this entire structure up from 2009 is a corrective wave.
Why is this important? Three reasons:
- Knowing the structure helps us understand the final subwaves in current wave circle wave 5 heading to the top
- It helps us predict a final top in price
- It helps us understand the potential magnitude of the drop once the market tops (more below)
NOTE: The term “corrective” does not mean that this wave is correcting another wave. It’s rather an elliott wave term that 1) addresses the structure of the wave and 2) the fact that it’s moving against the larger trend.
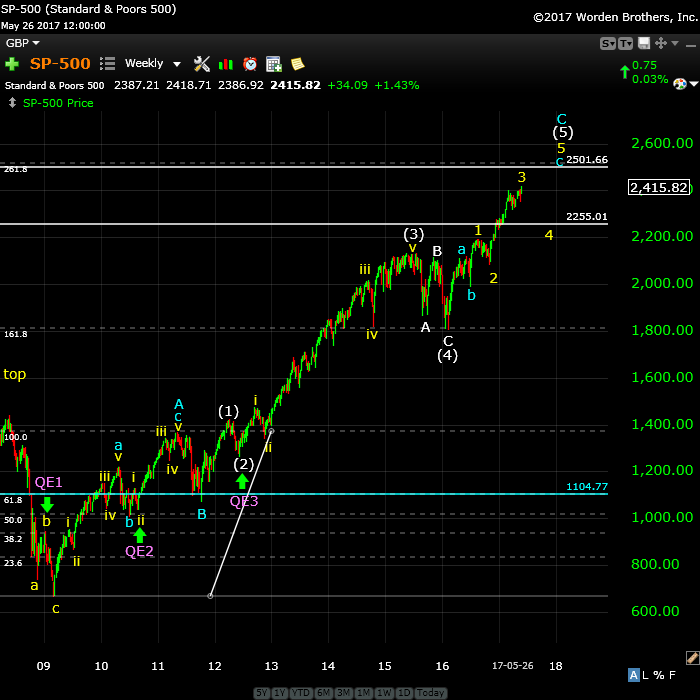
Above is the weekly chart of the SP500. I’ll take you through the important elements of this final wave up from 2009, moving more or less from the bottom up to the top.
QE 1, 2, 3: In purple, you’ll see the timing of the various quantitative easing (the Federal Reserve introducing cash into the system by buying mortgages, etc.). You can see the “bump” up in the market when they were added—fuel for the fire, as it were. In the case of QE1, it was set in place before the wave down in 2008 was complete. The result was that it shortened the wave, making the final 5 wave of that sequence only three waves. You can see that I’ve labelled yellow abc just below the green arrow. That meant the the entire wave down changed from motive to corrective—it was a subtle change that many of us did not catch when it happened (and many still haven’t clued into it).
The effect of that change to the final wave meant that in Elliott wave terms, it signalled that we would likely see a wave up from the bottom to new highs. To that same point, the blue horizontal line at 1104.77, marked the 62% retracement level of the 2007/8 wave down, which, if it had been motive, was where we expected the third wave down to occur. It began, but came down in three waves and headed right back up with QE2 kicking in.
Corrective Wave blue A: This is the most important wave of the entire wave, as it sets up whether the continuing wave up is going to be motive or corrective. Let’s review the reasons it’s a corrective structure:
- The first wave yellow ii is a second wave. However, it did not retrace even 38%, which is the minimum it must retrace (by Elliott wave rules in Prechter’s Principle book) in order to be a “legal” wave 2 in a motive sequence. This is a “hard” Elliott wave rule that cannot be broken. It has been, however. So, right off the bat, the entire wave up has to be classified as “corrective.”
- Wave blue b (a little higher) cannot be a wave four, as we already have a wave four in the wave up of on lesser degree, so it has to be a wave blue b. It is also too large for the sequence so far and therefore the sequence does not have “the right look” for a motive wave.
- The lengths of the subwaves of the blue abc sequence up do not conform to the requirements for a motive wave. Also, the 5 waves of wave blue are not the correct lengths for a motive five wave sequence; the blue c wave has the same issue.
- Wave A up is a zigzag, for the reasons I’ve mentioned. In fact, there is nothing that supports the idea that blue wave A is motive (that I can find).
Fibonacci Prediction for the Top: Knowing that we have a blue A wave in place means that the next major wave up will be a blue C wave (which is not complete yet).
In a corrective sequence, we’re typically able to measure the A wave and then expect the C wave to be either a fib ratio extension of that wave (in terms of length). Expectations are either for a C wave that is a measured extension of the A wave or alternatively, the C wave will be 1.618 or 2.618 times the A wave.
In this case, an extension measurement of the A wave at 2.168 projects at top at 2500. We achieve this same target with a similar measurement of the subwaves within wave white circle 5 (below).
Wave white (4): To be considered a motive sequence, this wave should retrace 38% of the entire length from the bottom in 2009 to the top of wave (3). It doesn’t come close; it is way too short.
Wave white (3): (from about 1104.77 up to about 2136.60):
- Wave white circle 1 is the first wave up of the C wave; however it is in 3 waves, which means it’s corrective (it is, in fact it is a zigzag)
- Wave white circle 3 should be 1.618 the length of wave 1 (in this case, the established blue A wave), but it is not quite long enough. In motive waves, you find that lengths tend to be exact, in corrective waves, not so much. So this tells me something else is going on (likely corrective). One more nail in the motive wave coffin.
Wave white (5): This wave is also turning out to be corrective.
The wave up from the bottom of white circle four is a zigzag. That’s because:
- The blue a wave up does not have the “right look.” The fourth wave is far larger than the paltry second wave. The entire wave looks more like a zigzag. Also, the 5th wave of the a wave is not nearly long enough for a motive wave structure.
- If the entire wave yellow 1 up from white circle 4 is the first wave of the fifth, wave yellow 3 is shorter, which it should not be.
- Wave yellow 3 is currently 1.618 X the length of wave yellow 1 (as marked on the chart), which it should be, whether motive or corrective. However, this means that wave blue a is indeed a different wave and not part of yellow wave 3.
- I have picked apart the structure of yellow 3 in another blog post. You’ll find it here.
- If I measure the length of the blue a wave of white circle 5, having a C wave that is 1.618 X the length of the a wave, gives me a target of 2500, the same target I got with the larger measurement of the blue a wave at the bottom of this entire structure from 2009. That supports the count as I have it shown and gives me two reliable measurements to the same target.
____________________
Even one of these rules or guidelines being broken would have me questioning whether the wave up was motive or not. However, we have warning bells sounding right from the bottom up. So, the wave structure is clearly corrective.
This means that:
- Once we reach the top, the waves coming down are likely to be impulsive to the point of downright scary
- The final wave up in white circle five is more likely to be an ending diagonal, as this traces out in overlapping waves, which is a final pattern with an underlying bearish theme and fast-waning volume.
Hopefully, I’ve given you lots to think about as we move haltingly to the top (in my calculations, it’s about five months away (“five miles out”)). Look to the September/October timeframe.
Rise above the rest … SM 2
Rise above the rest …I have only ever met a few people who, in their chosen fields (astrology, medicine, music, martial arts, technical analysis), rise above all the rest and you are one of them…you have ‘the gift’…and that’s why I’m a Trader’s Gold member. —SM |
Get an upper hand … JC 2
Get an upper hand in trading …Seeing all the different currency pairs and the wave structures and hearing you explain why this has to do that on a nightly bases gives one a upper hand when trading. Elliott Wave applies to all stock and indices and can be applied to any candlestick chart. If someone ask what you want for Christmas – Tell them a membership to Peter’s “Traders Gold!”—JC |
A true expert in Elliott Wave FL 2
A true expert in Elliott Wave …You are a true expert in EW analysis. What you provide is not available anywhere and is priceless. Subscription on your services is the best thing I have ever done. Many thanks for your effort to make me a better investor. I now have more trust in my investment decisions. I hope you will continue the excellent work! —FL |
Have not had a losing week RW 2
Have not had a losing week …I have been with Peter almost a year. The only thing that matters is have I made money with his service. I think I have finally turned the corner using Peter’s EW. I have not had a losing week in the last 5 months. Thanks Peter, for your amazing amount of hard work. —RW |
Tops in your field DZ 2
Tops in your field …You are tops in your field. Tried to follow Elliot Wave international for years. They were always behind the market. After discovering you, I perceive that you are an expert in reading the waves, which puts you way ahead of the rest of your peers. And you can read the Waves like you are reading tomorrow’s financial section. I pray you stay healthy. —DZ |
The best of them JL 2
The best of them …Last couple of years, I subscribed to several ‘market traders’. You are by far the best of them and the personal contact is awesome. Daily and daily updates are very well written! Besides your expertise in EW, I also like your cycles analysis. Best investment I ever made! —JL |
Couldn’t be happier … KK 2
Couldn’t be happier …The analysis and insight you provide is simply amazing! I’ve been trading the futures and equity markets for well over thirty years and usually average around 5% monthly. Since joining your Traders Gold Service two months ago, that number has better than doubled. I couldn’t be happier.—KK |
the real deal SM 2
The real deal …‘Educational, insightful and thorough market analysis for all levels of traders. It’s Elliott Wave at its best….Peter Temple is the real deal’ —SM |
The Market This Week
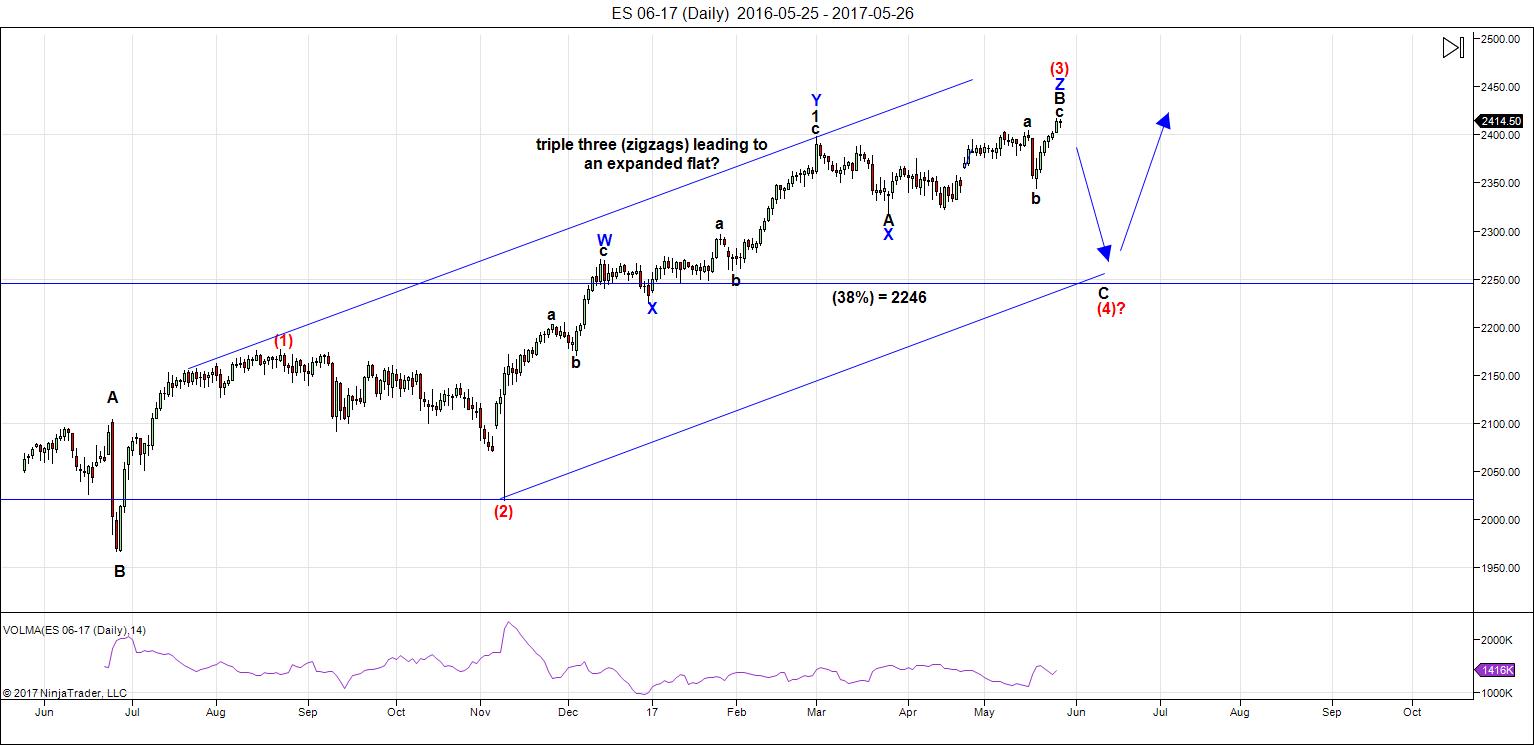
Above is the daily chart of ES (click to enlarge, as with any of my charts). I had to backtrack this week on a call made in this very difficult "corrective" market. What appears to be a third zigzag of the third wave (you can only have three patterns within a corrective wave—this third pattern starts at blue X on the chart) has continued slightly higher and now looks to be building a very large expanded flat at the top of the circle red third wave. The analysis was confused by an earlier, smaller flat (May 16), which resulted in a down wave of five waves (the uppermost b wave down on the chart). Five waves down would normally follow-through to a zigzag to the downside.
A teachable moment ... lol: In retrospect, that final wave of last week's flat (5 subwaves down) must not be considered the beginning of a zigzag; it must be kept within the confines of the flat (3-3-5 configuration) and once done, it would need to completely retrace. To recap, the last wave of the flat last week was an ending wave of 5, rather than a beginning wave of 5. It can't be both.
In any case, my original target for this third wave was 2410-15, and we've now exceeded it by one point. That's a head's up as to the importance of fibonacci ratios in all markets. They affect just about every wave, in my experience.
This market, being such a "one-time-wonder," is rife with lessons one could only get from a major corrective ending wave, which we have never seen before (markets usually end in motive wave patterns; however, that's not the situation here). We have circle red wave three ending in overlapping waves: That's corrective (as I've maintained for months now).
Another technical signal to pay attention to:
As well, there was the non-confirmation between some of the US indices. The SP500 has previously gone to a new high, while the NYSE and DOW had not. While others thought that this non-confirmation was OK, the market has proved once again that it is not, as all the major indices are slowly reaching up to exceed their previous highs. Both these indices are likely tracing out flats as well (most likely regular flats, as opposed to the "extended" type).
I have always maintained that once one index tops, they all have to (so that they stay in sync). I had let that personal guideline slip from my analysis, wherein it should have been a big red flat (and something for you to keep in mind for future). I've not seen it fail yet.
For this reason, I look at multiple indices before committing to a direction, or turn.
Summary: We're completing the third wave in ES with a possible expanded flat. Look for a turn down early next week.
After completing the larger fourth wave, we'll have one more wave to go, which could be an ending diagonal as a fifth wave. The long awaited bear market is getting closer.
______________________________________
Sign up for: The Chart Show
Wednesday, May 31 at 1:00 pm EST (US market time)

The Chart Show is a one hour webinar in which Peter Temple provides the Elliott Wave analysis in real time for the US market, gold, silver, oil, major USD currency pairs, and more. You won't find a more accurate or comprehensive market prediction anywhere for this price.
Get caught up on the market from an Elliott Wave perspective. You’ll also get Andy Pancholi cycle turn dates for the balance of the current month. There’ll be a Q&A session during and at the end of the webinar and the possibility (depending on time) of taking requests.
All registrants will receive the video playback of the webinar, so even if you miss it, you’ll be sent the full video replay within about an hour of its conclusion. For more information and to sign up, click here. NOTE: the weekday and time have changed - to Wednesdays.


Well written as always my friend! Keep it up Peet! (Y)
Cheers,
W
🙂
Same overall structure as DAX and AEX.
excellent analysis and explanation…well done!
Peter T,
Get ready for the “back benchers” to adopt your analysis as their own! Excellent work that adheres to all the Elliott Rules!
We’ll have to see … lol … to believe it.
What a pleasant surprise, I thought I would have to wait for Monday, thanks Peter!!
After 2 weeks of flu off and on (it was wicked!), my energy is back … haha.
Peter just want to let you know thank you for the time spent on free blog
🙂
Outstanding analysis! We are very blessed each time you share your Elliott Wave analysis.
Amen!
Excellent post, Peter! Appreciate your being true to your school (EW). You are a great teacher and genius when it comes to patterns.
Peter,
as far as I understand even if you see the market to turn down early next week you still expect NYSE and DOW to make the new highs before ?
That would be my guess.
Peter is one of the hardest working Analysts I Know and I know many!
Thanks, buddy!
2000 to 2009 is clearly a beautiful ABC 4. That would strongly indicate this is a 1 and probably Feb 2016 was a 2. So we are in 1 of 3. Could 2000 to 2009 be an ABC A and now we are in a wild b to a new high with c ahead. Possible but doubtful. Remember the low in the Dow was in 1932, and we were still 9 years before WW2 started. The 2 low was a few months after that. So the news is so bad it is hard to imagine we are in a top area.
Kent,
2000 to 2009 was definitely not an abc in EW terms. The 2008 high was higher than 2000 in the SP500.
The Universe speaks …
http://www.zerohedge.com/news/2017-05-28/powerful-geomagnetic-storms-hit-earth-will-stocks-fall-next-week
Today is far North declination, I wonder if moon being far from the equator correlates to more geomagnetic activity.
I may add that the FED is very well aware of these phenomena and actively studies them when they’re not too occupied by the standard fraud money counterfeiting operations…for the non believers*
Alex, do you realize, there is no governing body in the USA, that can stop the Federal Reserve from doing any financial operation they see fit, or stop them from accruing debt, or stop them from printing or flooding M1, M2, or M3 with any amount of paper they see fit for any reason. Did you know that?
There is no one, there is no oversight, of their monetary policy, none.
I swear I realize it every single day. We’re in unchartered waters. A normal country would simply go bankrupt / default on its debt. I mean, seriously: http://www.usdebtclock.org/ is it really supposed to ever be paid back?
There’s another way I guess…the great equalizer…that’s why I don’t like the atmosphere or Trump’s recent foreign trip, basically breaking up with the EU, with the EU leaders publicly stating he needs psychiatric treatment (I’ve never heard a similar tone in public declarations before in my life). This happened in 24 hours. Merkel was talking about Trump like my drunk friend at the sport-bar would do, Macron few minutes later basically said to Putin, to his face, he can go f* himself. Now Japan is planning with US the attack on NK, with Mad Dog, not the most risk-averse of them all, saying it will be a total carnage for US troops and certain death for all the citizens in Seoul.
The world is already gone nuts. That ties with my thesis that without so many machines operating the market we would already be talking about the crash of the millennium. When it’s that III World War Peter again? :/
Peter, I am not a believer in any system that has to do with cycles or EW.
I believe the market trades on binary events, available liquidity on a daily basis from central banks, and at best Fibonacci levels set by HFT’s, support at 10,20,30dma, and RSI, are at least daily mathematical tools to help day by day, but not to forecast any further. My question to you is, if EW is so accurate, why doesn’t everyone know when the market will go up and down according to these waves? Everyone would be rich. To say that market prices are pre-determined, is to discount major geo-politcal events. You state there are all these sub waves within waves, I contend that’s an excuse. You even discount all the QE programs as if they have no affect on the market, the affect was inevitable because of EW.
I submitted this respectfully to you, I hope I get a reply, thank you.
Vinnie,
Well, all I can say is your ignorance of EW and Cycles is your loss. There are many that have made vast sums of money trading through either, or both: Paul Tudor Jones, Clement Stone, W.D.Gann, the Rothschild family, Martin Armstrong (who got locked up for it for seven years), and the list goes on and on.
Why do people not believe in it? People, for the most part, are uneducated. They’ve certainly been programmed; they believe what they’ve been fed. Just look at anthropogenic warming or the ozone scam. There’s no science in either of them; it’s all on the other side of the argument.
And learning EW takes time. I’ve spent over 20K hours studying the market and reading waves. Most people that trade cycles will have put in similar amounts of time. The herd is not about to do that.
I’m not going to defend either. There are volumes written on both cycles and Elliott Waves; the science is indisputable. But believe what you want.
There are books on cycles, EW, and other related topics on my recommended books list, but it’s not necessarily up-to-date (I read a lot of books): https://worldcyclesinstitute.com/books/
Regarding QE and the market: I said no such thing. Please don’t put words in my mouth. In fact, I said just the opposite. I mentioned that QE1 changed the projection of the last wave of the 2008/9 bear market, so that the wave actually predicted a new high due to QE’s effect.
For every person you claim made money with EW, 100 lost
I suppose my “ignorance” sees what I see in any EW board or blog. Whenever something doesn’t happen it suppose to “predict”, out come a litany of excuses until one finally fits. Here are some “terms aka excuses” I’ve read:
It turned out the wave extended a little.
It turned out sub b was really just still sub a an not finished.
It turned out to be a rounding top
It turned out to be an descending wedge with a possible minute lll to follow
My point is simple, not one EW person EVER admits he/she gets it wrong ever, there’s always an excuse why something happens. Market moves happen because algos adjust every minute to binary events and the amount of liquidity poured in by CB’s. The Fed does almost daily $160-$250 billion in reverse repo to manipulate interest rates, so that means EW told the Fed to do this daily to get to each day’s closing price. You take away CB intervention, the SPX would swing wildly every day +/- 20-25 points. The Fed wants none of that, in extension a VIX that has become non-existent.
As I said, you will believe what you want to.
EW/cycles are not ‘belief’ systems…your belief is not a requirement…….they exist whether you ‘believe’ or not…….they are much bigger than the individual…..that’s kind of the whole point.
Communism also exists and has tens of thousands of followers who claim it works, regardless of whether I believe in it. Your point is one of cultism, not willing to debate any of the many flaws in the system.
To have EW followers state so blindly, “it just happens that because the waves say it does”, that doesn’t seem oddly cult like? I maintain its a system whereby if you give enough excuses and exceptions, eventually one will fit. Why can’t EW claim for instance, SPX will retrace to 2380 between June 1st and June 5th? Just a scenario, but my point is, if its s system and it works, then why can’t you put a time period in for your claims of a market move up or down?
You forgot to mention Robert Prechter, his EW forecasts are wrong because of what if I may ask?
Your lack of knowledge, understanding and experience is quite apparent yet you insist on expressing an opinion about a subject in which you clearly don’t grasp. Your communism analogy simply compounds your lack of understanding and is just plain silly. I have made my living trading the markets for 8 years now so maybe your lack of success is you and not any particular trading theory/system. Sorry…can’t continue the conversation….haven’t got time…too busy making money! Goodbye and good luck. P.S. I didn’t forget to mention Prechter…I don’t follow him….I follow the work of Peter Temple.
Vinnie,
If one goes to LunaticTrader.com, and studies Danny’s past performance chart for new moon/full moon trading (buy full moon plus four calendar days, sell new moon plus four calendar days. About 90% of the net gains since 1950 are during the full to new cycle, leaving only 10% during the new to full cycle. While this could be artifact it has done ok during the last few years. 90% vs 10%, maybe a trader could use this to their advantage; only go long during the 90% and only go short during the 10%?
It is a mistake to think humans are rational. 80% of your ‘decisions’ come from the lizzard brain. The lizzard brain has no logic; that’s in the neocortex.
The lizzard brain is about herding; safety in numbers. This is what socionomics is about.
When you buy a car it is a rational decision. You can be certain the car you buy today is the same car you will have in a year.
When you buy stocks, there is no certainty they will look as nice as they do today. Now the decision is emotional. That is why we see serial correlation in prices. People buy stocks when they go up. This is not rational.
Get used to it; we are monkey’s with a conscience.
I love it ,,,, Nick ,
Leasing is more rational…
Vinnie, you mean that this market, with nuclear missiles flying and a 2-4 year max countdown till they hit the target (in the US, Japan atm is probably more 2-4 months), an FBI investigation on the potus for treason, debt flying out the roof, social, religious and political tensions that may very well lead to a civil war, oil and the dollar hanging for dear life, Merkel and Europe saying officially that US are no more a believable country, you mean…you really mean that the market moves on major geo-politcal events 😉
I understand what you say, I have my doubts too in some aspects (mainly how much human emotions can really influence a market traded for 90% of liquidity by quant algorithms and HFT machines), but please believe me, market doesn’t care how the world is doing 🙂 they just use the news to cover their “simple merchandising” operations…
That’s correct Alex. Currently humans account for 23% of total daily trading volume, a fact that is tracked monthly by several independent services.
If you go to https://www.newyorkfed.org/, and go to temporary operations, and see the daily flood of money.
27th is far north lunar declination. Most months,the days following far north are bullish. Seasonals are ok next week. Phase and distance are weak. So mixed PALS and it gets weaker the following week. So will sell my call and buy put if we get a rally.
And by chance we get a binary event and the SPX falls say, 15 points, then what?
What Lunar Phase correlates with war, famine, hurricanes, and most especially, terrorist attacks?
Lunar has nothing to do with that. The 172 and 516 cycles do. They always have throughout history.
It is all about rep’s, Vinnie. The more rep’s, the greater chance of having an even number of heads/tails. With lunars there is a slight advantage with phase, distance, and declination. Added to that seasonals, there can be more advantage. So if you are starting with 75% of market going in a particular direction on any given week, and it doesn’t happen then that is filling in the 25% side of the balance. Over hundreds of rep’s the PALS system gives an advantage, yet it is no guarantee, that is why I trade small.
The first part of a 3 part series entitled “300 Hundred Years of Lies” is now live on the landing page https://worldcyclesinstitute.com
Peter
Thank you for the “long count ”
Joe
Andre’,
Any updates on the days that are popping up on your work? Those dates have moved around. That is not a criticism! Peter thinks this is a 500 year top! What I have taken away is that your work is searching for a very important top…For the benefit of others…Is that accurate? Not looking for trading and investment advice!
Peter T’s latest commentary seems compelling! Do you have any dates that looks for a turn in the same timeframe as Peter T? Any comments are appreciated!
Spotted heavy criticism here eh!! Bigly. Sad. (just joking 😛 sorry, I feel particularly stupid tonight, it must be the electromagnetic storm 🙂 I can’t sleep and I’m even more dorky than usual…
Vinnie
Elliott wave theory is best used by looking backwards .
We all try to look forwards and assume based on x that
Y is next yet that isn’t always correct .
Also a person must be able to put the present wave
In the correct time frame .
What gives Elliott wave theory a bad wrap is pretty simple .
A lot of people don’t follow the rules or the guidelines
And they put an arrow pointing straight down stating wave 3 of 3
Of a 3rd of a 3rd wave decline ( a wonder to behold ) is coming next
Week and the Dow or spx will drop 40 % by August 1st .
My thoughts are that all waves should be seen in many time frames
Daily , weekly , monthly and quarterly , I also watch close only charts
Vs bar charts .
If a person was to stay 1 wave behind so to speak and not look forward
Then you would find more Elliott wave analyists in agreement .
As they say everyone is correct through hindsight .
The common theme ( or error ) lately has been that the next move
Would be a wave 4 . Think about that for a second .
If the next move or swing of wave should be a 4th wave then
What wave are we still in ?
Which wave tends to be the longest and the strongest of a 5 wave structure ?
The Fed nor the bankers have any control over this market
In fact as we will see going forward , the Fed will attempt to slow
And or stop the rise in the stock market by raising interest rates .
By raising interest rates they will create a flood of money towards
The US dollar as well as the US stock market which will drive stocks higher .
The point being the Fed has no control over this market and to assume
They do is foolish .
The question though becomes this . Does the stock market begin to
Act like a commodity ?
5 th waves up in commodities are more of a fear based panic affair
Spike up where as a typical stock market 5 th wave is weak and
Exhaustive and slow and complacent .
Whether you think we get wave 4 tomorrow , the drop then bounce
Which becomes a new high or a failure we still have to finish wave 3
Enter and exit wave 4 then rally up in wave 5 or fail and all of that
Is going to take some time .
Then after we get through all of that we will need to see wave 1 down
Complete and wave 2 back up Complete before actually taking
A longer term bearish position .
So if your an Elliott wave trader and your looking at a medium term
View , we are topping in wave 3 Yes but waves 4 and 5 then 1 down and 2
Up still need to be seen before we exit the building and short this market
For all its worth .
Draw the Map and then wait for the set up and trade through hindsight .
That is my thought of how to use Elliott wave theory .
How
Imho every single system on earth, if traded by trying to follow somebody else, will fail. It’s impossible to duplicate risk tolerance, psychology, real-time analysis (if the position goes against me, what I’m gonna do, call Peter in the middle of the night?).
So basically every outside analysis should be used to support your own system. You can’t expect someone else to trade for you.
Vinnie makes some good points imho. Even Peter says that most of EW analysis out there is complete BS. I follow Peter and Daneric, they’re almost always in line, while I see a lot of counts out there, almost 1 different count for trader.
EW is a very complex system. I’m not even trying to learn to be an EW trader. I trade my own system and use Peter’s analysis for complementary info (they match very well, I trade smallest swings but try to not contradict Peter’s general direction on higher tfs or cycles).
Some degree of subjectivity seems to be part of EW as a system. Put the same chart in front of 100 demand-supply traders, you can have 5, maybe 6 interpretations. 100 EW traders will probably have 112 interpretations.
That’s not inherently bad imho, it’s just that it’s a very complex system, the more the complexity, the more the subjectivity…pretty normal in every life situation, no? Ask 100 people about how to cook an egg or how to define relativity in quantum physics…
All in all, it may be that 99% of EW analysis is cr*p (sorry for the french), and Peter’s one is excellent. I think Peter has the same position 🙂 so I don’t see what all the fuss is about 😛
PS: All in all, I also like that Peter is very clear and has balls…he doesn’t dance around things and always exposes himself. I’d be interested in his analysis even if he traded a completely different system…so basically I’m more interested in Peter’s analysis that on “general EW” if such thing even exists…
Well put and thanks. The only thing I disagree with is your point about subjectivity in the system. There is none. The problem is that analysts inject their biases and then the count becomes subjective. This is the key reason I don’t look at other people’s charts (plus I simply don’t have the time) or discuss fundamentals.
Or they can’t see patterns properly, or just don’t understand the finer points about EW (I have a rather long list of things I practice in my analysis, and a lot of it doesn’t exist in books—it comes from experience). Although I like Bob P., his group is absolutely one of the worst at EW analysis and, as I’ve said here before, are the ones that drove me to this. They cost me a lot of money when I didn’t know better. I still see the most amazing and weird counts in their work that don’t adhere in the slightest to the rules.
And yes, EW analysis is complicated. 🙂
Me too! 🙂
eheh…yes Peter…the 112 interpretations on how to define relativity in quantum physics are probably just 98 people not knowing what they’re talking about 🙂
Good point, Alex! Skill and suitability and hard work must all be combined (along with some amount of luck/intuition). Even tho’ astro/lunar/seasonals may seem bizarre it works for me because I enjoy it, have a knack for it, work hours a day on it. Reminds me of a quote from Steve Jobs: “Believing is seeing”. In other words, give the customer what they don’t know yet that they want.
Sure Valley! And we could both look at the same identical signals and have completely different results. There are too many small nuances in play, you can’t trade anyone else’s beliefs, you have to find your own 🙂
Also, in my experience, bad traders can trade signals directly from the market makers and lose money, good traders can trade on mas crosses and make money. There’s no inbetween, good traders, with a lot of experience, just get a feel for how the price moves…something that I don’t believe can be really taught…
I’ve been told that EW is subjective. right now am reading the following books:
TECHNICAL ANALYSIS of the FINANCIAL MARKETS by John J. Murphy
TECHNICAL ANALYSIS and STOCK MARKET | “The REAL BIBLE PROFITS of TECHNICAL ANALYSIS” | by Richard W. Schabacker
TECHNICAL ANBALYSIS of STOCK TRENDS by Robert D. Edwards and John Magee
interesting reading, so far.
I follow #GANN
..also follow $SPLV for $SPX $SPY direction. weird as it may sound. but it works on a daily basis.
..and yes.. am familiar with your work/site. am familiar w/tons of sites.
Hi E!
Cool to see you here!
Cheers,
Wouter
Hi Emily,
I have Murphy’s book. Edwards and Magee is the Bible of technical analysis, but virtually the same thing. Another one I really like (I have too many of them … lol …) is Martin Pring on Price Patterns. All great books.
I am guessing volatility picks up next 16 days (full moon, apogee, south declination, weak seasonals) all occur next two weeks.
What if?
A/I, Robotics dramatically increase profitability of S&P 500 companies and the QQQ companies especially since they are the producers. The laid off workers (factory, transportation, lawyers, accountants, medical workers) are given a monthly check from the govt. to cover their basis expenses and encouraged to create small businesses. All government sponsored retirement programs are replaced by 401Ks and the beneficiaries accept this as the stock markets has gone way higher.
Peter,
do you take this wave down ?
Not me. 🙂
Well,
I’ve have taken one at DJ 21085 on Monday and another one at Cac 5330 today.
Hope for good swing
I was in VXX, sold tiny profit, looking to reload on next Monday’s open. First trading week of June is usually bullish and several lunar tuner components are strong until Friday. Next week, however, is a rare completely lunar tuner negative week for the entire 5 trading days. May the short be with you!
How about this corrective structure for June seasonality? ? http://imgur.com/a/QSutP
Looks like first few days of June on that chart are up, second week is weak, and fourth week is weak.
OCTOBER: This is one of the peculiarly dangerous months to speculate in stocks in. The other are July, January, September, April, November, May, March, June, December, August, and February.
Mark Twain
The author of Huckleberry Finn is not exactly WD Gann.
On second thought, maybe he was =).
The dominant cycle is down fro 6/1 into 8/1.
Within this cycle we have low 6/23, and a high 7/13.
Gravity gives an inversion into the weekend, so next week is down.
One other cycle is up into 6/15 and the down into early august. So after mid june things will get volatile. First two weeks down trend but some support. 6/13 low, 6/15-16 high and down into 6/23.
After the august low we will test 10/2-3 before we dive into 2018.
Andre’,
Thank You for the update! Much appreciated!
Thanks, Andre’. Yes, looks like tomorrow will be a low risk exit from market and most likely market will be a few percent lower by the Fed meeting on June 12.
Incredible this break out to ATH in SnP.
No volume.
Looks like algo melting up on derivatives.
Peter,
I should admit you to be right. This market goes to the new highs in all indexes.
God knows where it will stop.
I have a pretty good idea where it will end. We’re close.
But the Prechter folks always say that non-confirmation of the indices don’t matter, but it does. It matters a lot. If they were to turn down without topping they would have to start down in 3 waves, which doesn’t work; they need to have a first wave down in five. So they all need to top. Just something to keep in mind for future. 🙂
If the DOW has to make a new ATH high now, the S&P would go well above 2.500 🙁 I think I’ve missed a couple of pieces here lol
Sorry I meant RUT, not DOW.
It will stop on Friday or Monday and then sell off into Fed Meeting on rate hike uncertainty.
May be stops tonight if Trump “covfefe” something.
But Friday for sure ……
for the weekend
I would say we don’t use “for sure” eh 🙂 not here
Peter do you expect an overnight crash? Because on normal momentum this is not going down anywhere soon…
Anyone have any trades on/or trade recommendations?
Valley,
There are lot of stats which argues that this kind of strength does not fizzle out so easily so how confident are you in your call for next week weakness. if there is a weakness and then may be a spread bet on NDX droping 400 points in 4 weeks ..may be? I know we keep changing the goal post constantly.
I sometime wonder if we are very wrong on this long term bear market starting theory.
I’m still holding to an important high comes June 30 th
Alex
You make some good points
Number 1 being that everyone should rely on their own trading rules, money management systems etc ..
Not sure if you mentioned daneric or someone else did but ….. It seemed to me a long while ago he was copying Steve
Hochberg from ewi and his counts were very wrong . .
Peter
There is 2 people in prechters group worth listening to in my opinion
Jim Martin’s ( I haven’t followed in a long time ) and Jeffery Kennedy . Both the those
Guys are pretty good . I haven’t followed either in a long time but found them pretty good .
Hochberg has never been good from the begining .
Some of the best market timers or the past , George Lindsay was the most consistant for the longest time period .
Jerry favors who I suppose not many know adopted wd Gann Elliott wave and George lindsays work along with
The bradly model . Jerry favors was also one of if not the first to put it on disk . Now days just like Elliott wave
You have various ” bradly models ” not all of them are the same .
What I learned The most from Jerry favors was to be patient and wait for the indicators to guide me .
Timing and indicators to me are number 1 and Elliott wave theory number 2 .
My reasoning is pretty simple , an oversold market and a cycle low implies a rally
An over bought market near a cycle high implies a pause or a sell off .
The degree of rally or decline is based on the wave count .
The wave count will show itself eventually in all time frames .
This would be consistent with the first year presidential pattern of market rising until July.
So, are we back into wave 3 again?
Valley
I don’t follow that cycle yet if your correct then I’d say there is 3 reasons
Instead of the 2 I’m looking at for the June 30 high .
One of those 2 calls June 30 the high of the year .
I’m just thinking ( subjective at this point ) its an important high .
The latest hype I’ve been reading is mini microphone companies
And marijuanna stocks . The thinking is as the internet of things takes over
You will need good voice recognition and that will mean many mini microphones
Everywhere . The pot stocks being the new growth story , I know alcohol sales tend to
Rise in bear markets yet if everyone gets stoned ??? They may wake up and find out
They missed it .
Don’t worry be happy 🙂
Joe, I heard Jeremy Rifkin talk about the internet of things. He suggests the next 30 years will be an epic time in equity markets as the internet of things gets rolled out. People will be needed to build the new economy build on robotics and a/i. After the roll out is complete all jobs (driving, human to human services (acct, doctor, lawyer), labor (factory, construction) that can be completed by machines will be. So, my guess is that buying QQQ and not looking at the account for a decade or two is the best bet.
We’re very far from wave 3 fibonacci target, anybody has any (real) idea on what is going on?
I doubt it. No one I know so far has got it right.
Apparently you are very right…
FWIW, since NOBODY has called a final wave up, as well as our proximity to a commonly cited long- term target of SPX 2500, arrived at by several different methodologies, a critical cycle date of June 20 and the ludicrous levels in VIX, I personally think the end is nearer than most think. I now am layering in what will be my largest short position this year. 1/4 at the open today after exiting my long position, 1/4 on Monday, and the remaining half on any one of my own favorite reversal signals – outside reversal candle, and/or intraday strong VIX price divergence with the market.
Daneric switched (yesterday) to considering this wave V jfyi
july 7th as per mahendar….
yes, the one that said no new ATH…
lol…all of them are like that…no body can predict accurately otherwise they wont be selling anything…its just a best guess system.
there’s a difference between not accurate and almost always wrong, we’re way past that point lol
This is correlated to the station of Jupiter happening right now going from reverse to forward. These Jupiter turns correlate to major market swings. Jupiter is in a 150 angle to Neptune also which makes it all the more high froth. The station will be complete June 9. The turn can come anywhere in here but probably before the 9th.
there might be something to this…an associate subscribes to a financial astrological newsletter…weeks ago the author of the newsletter forecast a turn today…still six hours to go…let’s see how things play out…
another astrologer chimes in today (free email advisory)…
“…the period of rising equity markets without meaningful swings to the downside is ending today…a correction will start next week…it will not be a strong correction or lasting correction…for the next three months…there will be swings larger than 100 S&P 500 points…”
Valley
I dug into the internet of things a few years back
And also looked into Apple suppliers and autonomous cars and took
Positions in several stocks based on that theme .
My thinking now though even while I still own them
Is who really wants to have their fridge tell them they need
A gallon of milk . Who wants a tech showing up saying the start
Capacitor is going out on your heating system .on top of that
Who wants to have the dis honest guy showing up and just making
Up something saying something like hey you need this or that
When you really don’t .
Now let’s go back to late 1999 tech bubble , Amazon got killed along
With several others and many never came back .
If anyone has ever bought into the mining story stocks or any story
Stock for that matter you will notice a common theme .
This is the future and The potential is huge and if this then
This stock will go to the moon . The problem though is the story
Drives the stock way up but the company never has the earnings
And when the cycle turns those sticks get hammered .
Also advertising companies ( Peter comment if you can ) suffer
In bear markets . Yahoo was an advertising company that once dominated
The internet before Google ate it up.
Facebook is an advertising company as is Google
Netflix trades at 175 times earnings, Amazon still loses money .
If they ever come out with a FANGS etf it would be the short of the century .
Facebook Amazon Netflix Google you can throw in Microsoft along with
The heavy weights of the Dow . Even Apple I’d consider as a short .
To add I’d say GM FORD and TESLA .
If you create all electric cars then the price of gas would collapse
Which doesn’t bode well for tesla because the gas cars will be cheaper
To drive . The internet of things in my opinion is hype at the point
I’m seeing several of the stocks priced no different the late 1990’s
No doubt the future will bring more tech . Think if Lucent and fiberoptic
Or if you want to go way back us steel and the rail roads , rca was one the future
And everyone would have a tv yet where is rca today ?
Dell computer , Hewlett-Packard or amd or rambus
Sears was a big company and was based on mail order yet they missed the internet
You once could by a house from Sears and now they are pretty much gone .
The Dow industrials were once 12 stocks added up and divided by 12 .
Who in the original Dow even exist anymore ?
I follow the Dow only because I have a lot of history on it
But if you think of it the Dow is really a dead index .
Tech is running away because it’s the future but if
Those companies are running higher based on hype and no earnings
Then those stocks will collapse worse then the stocks that earn real money .
My point is , the QQQ may be a great long term play after the crash if your looking
10 years out you may be in for a couple to 5 years of serious pain .
Food for thought
Look it up
Years ending in 2
1932-42-52-62-72a high-1982-1992-2002-2012.
What do you think 2022 will be a high like 1972
Or a low like all the others ?
Short term I’m still sticking to a June 30 high . I won’t get crazy bearish untill the market
Proves itself yet I’m getting short June 30 th . If the market proves me wrong
I’ll look out further yet I’m not going to get carried away on the bullish side of this .
Keep in mind I have been long through out this move , I warned of the March 27 low
I also was watching for a may 18 low which I allowed to run into may 25th and then
A run higher into June 30 .my cycle from March 27 runs into the end of the year
The June 30th date I still see as important .
Peter you.understand the advertising business and I’m assuming
You understand how business treats advertising costs in down turns .
I would think Google and Facebook would will see ad revenue decline .
I’ll have my timing model completed in about a week ( I work on it at sea )
I’ll be back home around June 20 th .
That should give me time to assess everything .
Blockchain technoiogy is another place to research ( not bitcoin )
Bitcoin might be a good short .
June 30 should provide a turn is all I can say at this point so keep it in mind
Is all .
Joe
I agree with everything you say Joe, as it is sensible and factual, and Xerox was once the “forever stock”, in 20 years FANG stocks could/probably will be Xerox’s. But, broad market SPY DOW has risen over time in excess of other asset classes as it is made up of the makers of goods and services (a hamburger cost $.05 in 1900 and now is $5.00), so, if one buys the broad market at the beginning of a truly transformative technological age (think England in 1825) and hold it for 20 to 30 years (think England in 1865) to price multiple of the surviving stocks (most of which are never at FANG valuations) will make them a winning investment.
Peter, is there any possible way the market is in wave 5 blow off wave?
This thing defy’s all logic.
My count hasn’t changed. Logical so far to me. I’ve been calling for all the major indices to reach new highs. Only the DOW to go.
Hi Peter,
sorry, maybe I miss something. I thought top is around 2410 to 2415?
Yes, you did. Read the blog post. When I bold something, it usually means it’s important.
Whitemare
I’ll have to research Jupiter Neptune .
My understanding though is the 150 degree angle tends
To be a bullish angle
That said I’m wondering which way this angle is moving .
Is it moving towards 180 or towards 120 ?
I’ll make a point to dig into it over the next week .
Joe, Jupiter is the timer for equities going through its 12 year cycle of signs, along with the nodes.
When two planets are in 150 degree angle, one needs to be retrograde for there to be a significant reaction, otherwise they don’t really see each other. That just happened as Jupiter retrograded back one degree past exact 150 to Neptune; and now is stationing. The amazing thing is Neptune also stations, but goes retrograde June 16, so again they will make that quincunx crossing with one retrograde, on July 4. This is a unique situation so who knows what kind of unleashing there could be. There’s a Jupiter line at 2305 calling, and Neptune at 2454, if the node at 2435 can’t stop it.
correction, that node line is at 2438. See if it sticks there.
6/5 will be a high and likely the high this year. In any case the market will turn between 6/5 and 6/15. And then it’s down into may 2018.
6/5 is a stronger date than 6/15 so I doubt 6/15 will bring an ATH. But it will be a high. So 6/10 low. 6/15 high, and 6/23 low.
Peter,
Can you go back over the Fibonacci relationship to your 2410-2415 target in the S&P? From your comments…it seems you think the S&P is on track to turn down in this vicinity, right? Said another way…wave 4 dead ahead! Andre’ certainly agrees with you!
Didn’t you share with us that Pancholi felt the the S&P was turning lower?
We hit that fib target. What I also said was that the DOW and NYSE need to do a double top and that this would change the target – all boats rise. We’re at the next higher ratio with an ED formed. Let that be a hint.
Well done for DOW
all the puzzle pieces …
🙂
Both did precisely the double top .
Incredible magic
Well it was fun. For the nearly 30′ it lasted 🙂
And now RRRRRIP to infinite and beyond…
https://ew-forecast.com/newsletter/e-mini_sp500_ahead_of_nfp
Grega Horvat, an associate of Dale Pinkert…
E-Mini S&P500 Ahead Of NFP – June 02 2017
“S&P500 is trading at all time highs with some sharp price move up from 2403 that we see it as fifth wave rally; final part of a five wave recovery from 2345, called an impulse wave*. There are some Fibonacci levels around 2440 that may play out an important roll for the next few sessions, as we think that upside can be limited and that new corrective set-back can be coming at the start of June. However, extended fifth waves are very common on stock markets, so do not chase it and call a top until you see a five wave drop from the high.”
Yesterday the market was buying good jobs stats.
I wonder how they will explain todays ATH with bad jobs stats ?
Good point. Should be interesting. 🙂
News doesn’t drive the market. I said 6/1 was a major high so the jobreport was supposed to be bad. A short term inversion brings the high Monday. That is why SNP is still up. But Monday will be the high for 2017.
Amen.
Cross the fingers.
To the next wrong projection, let’s go!
Thanks André!
I had a dream last night about a stockmarket crash. I’ve never had a stockmarket crash dream before. It was a sudden drop and everybody was surprised cause nobody saw it coming. No date was given but there were a lot of shocked people staring up at trading screens. Maybe it was just the tasty chicken wrap I had before bed? Time will tell but time can’t speak it’s just a figure of speech, and speech has no figure it’s just made up of audible sounds, go figure, do I make any $cents? Smell you later!
Tom,
Ha, Ha, I liked that, very good Friday Funnies. 🙂
Steve
Just broke support.. Could this finally be it!! lol
We shall see..
JNUG looks like its getting ready to go… CP $16.95
Anyone have any trading ideas for next week? I would like to know what the QQQ will do in the next five days.
Ask Citadel.
If they don’t know than nobody knows
May be this will give you some help:
http://www.safehaven.com/article/44451/the-june-2-5-time-and-cycles-cluster-high
Thanks, Dimitri! I worry (being short in a small way) that too many people are expecting a sell off next week, ahead of the June 12 Fed meeting.
Andre’,
Can we expect any more details like in previous weekends?
Ed,
Sure.
6/6 is a very significant high as my Mars indicator peaks with Jupiter and saturn down.
But 6/13 is also a major high so next week will be somewhat consolidating with a high and low on Monday, a high on Tuesday , a low Wednesday, a high Thursday and a low Friday.
My vix indicator gives a low reading Monday. And bond yields will peak. Both suggest a high Monday. Vix is up into 6/22 and bond yields down into 6/26. This suggests a low 6/23-26. 6/24 and 6/25 are strong so either Friday or Monday.
After the june low 6/30 – 7/1 could be a high, so I agree with Joe. Then a low 7/5-6
and a high 7/13.
As stated before my dominant cycle is down into 8/1. This cycle is based on musical vibrations.
So; the market is turning. next week down into 9 but not wild. 6/13 major high as 6/19 after opex.
Cheers,
André
Bis repetita.
The market should open down Sunday evening but the algos will reverse Monday morning to close higher.
Buy the f…ing terror attack at ATH as usual
Fun fact: “Fibonacci” in Italian is combination of “filius” and “bonacci” as he was son of G. Bonacci of Pisa. Fibonacci’s actual name was Leonardo Bonacci.
Elliot wave theory was based in part on the years Ralph Nelson Elliot spent in central America living close to the shoreline where he observed wave action which inspired him to look for wavelike patterns in the stock market.
It is snowing in Moscow on June 2. Cooling cycle?
No change to my June 30 date as an important high
Yet I doubt it is the absolute high
Still I see it as meaningful …
From Raymond Merriman free post below
Quote
We will resume the normal publication of this weekly column by Raymond Merriman next week. Stay tuned! It is going to be one hot summer with the Sun/Mars conjunction in Leo on July 26, and the solar eclipse conjunct Mars on August 21! For this week, we are right in the middle of two important Jupiter transits: Sun trine Jupiter (June 2) and Jupiter endings it retrograde motion and turning direct (June 9). In typical Jupiterian fashion, the stock markets of the world are experiencing an excess of euphoria and confidence.
Old post of oex targeting the 1064-1084-1108 price levels
Another 10 pts and we’re into the next level at 1084
And June was the targeted month for the high
Still looking for a June 30 high
http://imgur.com/9MIZbGc
This website is for educational purposes relating to Elliott Wave, natural cycles, and the Quantum Revolution (Great Awakening). I welcome questions or comments about any of these subjects. Due to a heavy schedule, I may not have the time to answer questions that relate to my area of expertise.
I reserve the right to remove any comment that is deemed negative, is unhelpful, or off-topic. Such comments may be removed.
Want to comment? You need to be logged in to comment. You can register here.