

For Trading and EW Novices
For those of you who know little about Elliott Wave and apparently don’t want to read the book to learn about it, let me try to make a few things a little clearer.
I called this B wave (that we’re near the top of) a corrective wave right from the start .. because it was and is one. It will never be impulsive. That was a no-brainer to me.
I’ve been sniped at all along the way. That’s OK. People who don’t understand often do that, and I have a thick skin. But, as I’ve said, I will not allow the negative comments; I will remove the ability to comment if they continue.
For someone to accuse me of being stubborn because I will not change my mind about what is clearly a corrective wave up, is a sign of abject ignorance. To people who think like this (including Global Warming nut-cases), I would suggest you to go another blog and find a wave count that’s more to your liking. Let your ingrained bias direct your future in the market.
This is an educational blog. Here’s some is some educational points (all of which I’ve written about previously in this blog):
- Some time ago, I provided a list of 14 reasons this wave up is corrective. I had no points on the other side of the equation. To tell me my count is wrong misses the point
- You should not, under any circumstances whatsoever, trade based upon a single daily chart (like the one I provide here). That is sheer insanity and shows a complete lack of understanding of trading and the market, never mind Elliott Wave. ! As Bernie wrote me on Friday:” I was just saying that you probably would have a higher probability of getting struck by lightning than trying to trade on these EW forecasts.” He’s absolutely correct, but not for the reason he thinks.
- I DO NOT, as a rule, recommend trading corrective waves (I have written about this previously here). It’s a countertrend move and therefore, is extremely risky. You can triple that sentiment for this particular B wave; it is the most dangerous one I’ve ever encountered, as it’s in the middle of a fourth wave. On top of that, futures and cash have different bottoms (about a 30 point differential), so you can’t reliably measure it — which I have stated several times over the past few months)
- Elliott Wave methodology requires that you wait for a trend change, which is signified by a first wave with a 5 wave count that travels to the previous fourth wave of one lesser degree, followed by a second wave of three waves that retraces 62%. That’s the entry. That is a top. There has not been a top, so I HAVE NOT called one. I’ve been warning of one coming, but this is certainly not the same thing.
All you people who are really ticked off (and sniping) because you didn’t lose any money on my watch: Please go somewhere else and lose money there; you’re novices and have a lot of learning to do (and some growing up to do).
All those who don’t like the methodology:
- it’s not mine, so I don’t really care what you think of it (it’s cowardly to criticize a dead guy, because he can’t fight back)
- ignorance breeds fear and misunderstanding: Learn
- you should have your own trading methodology. This free blog is not here to provide you with trading entry or exit points. It’s here for educational purposes only
- don’t snipe at each other (or me, but I have a thick skin, so you’re just showing your ignorance)
- pay attention to the commenting guidelines; they’re quite simple
I’ve also written about FOMO (the fear of missing out) here. It’s a powerful force; don’t let it ruin your life.
One more thing. There are times when being part of the herd is a good thing (as in third waves). It is not a good thing at the top of a B wave. If you don’t think for yourself in the market, you are destined for failure.
And, if you don’t pay attention to the past, you are destined to repeat it.
The following article is from Investopia
What is Herd Instinct
Herd instinct is a mentality that is distinguished by a lack of individual decision-making or introspection, causing people to think and behave in similar fashion to those around them. In finance, a herd instinct relates to instances in which investors gravitate toward the same or similar investments based almost solely on the fact that many others are buying the securities. The fear of missing out on a profitable investment idea is often the driving force behind herd instinct.
BREAKING DOWN Herd Instinct
Herd instinct, also known as herding, has a history of starting large, unfounded market rallies and selloffs that are often based on a lack of fundamental support to justify either. Herd instinct is a significant driver of asset bubbles in financial markets. The dotcom bubble of the late 1990s and early 2000s is a prime example of the ramifications of herd instinct in the growth and subsequent bursting of that industry’s bubble.
By nature, human beings want to be part of a community of people with shared cultured and socioeconomic norms. Nevertheless, people still cherish their individuality and taking responsibility for their own welfare. Investors can occasionally be induced into following the herd, whether through buying at the top of a market rally or jumping off the ship in a market sell-off. Behavioral finance theory attributes this conduct to the natural human tendency to fear being alone or the fear of missing out.
Herding and Investment Bubbles
An investment bubble occurs when exuberant market behavior drives a rapid escalation in the price of an asset above and beyond its intrinsic value. The bubble continues to inflate until the asset price reaches a level beyond fundamental and economical rationality. At this stage in a bubble’s existence, further increases in the cost of the asset often are contingent purely on investors continuing to buy in at the highest price. When investors are no longer willing to buy at that price level, the bubble begins to collapse. In speculative markets, the burst can incite far-reaching corollary effects.
Some bubbles occur organically, driven by investors who are overcome with optimism about a security’s price increase and a fear of being left behind as others realize significant gains. Speculators are drawn to invest, and thus cause the security price and trading volume to climb even higher. The irrational exuberance over dotcom stocks in the late 1990s was driven by cheap money, easy capital, market overconfidence and over-speculation. It did not matter to investors that many dotcoms were generating no revenue, much less profits. The herding instincts of investors made them anxious to pursue the next initial public offering (IPO) while completely overlooking traditional fundamentals of investing. Just as the market peaked, investment capital began to dry up, which led to the bursting of the bubble and steep investment losses.
_____________________________
Elliott Wave Basics
Here is a page dedicated to a relatively basic description of the Elliott Wave Principle. You’ll also find a link to the book by Bob Prechter and A. J. Frost.
____________________________
Registration for Commenting
Want to comment? You need to be logged in to comment. You can register here.
If you register, it protects your information. It also allows you to comment without filling in your information each time. Once you’re registered, simply go to the home page and click on the login link top right in order to log yourself in. Usually, you’ll be logged in for several days before needing to be logged in again.
______________________________
Problem receiving blog comment emails? Try whitelisting the address. More info.
______________________________
the real deal SM 2
The real deal …‘Educational, insightful and thorough market analysis for all levels of traders. It’s Elliott Wave at its best….Peter Temple is the real deal’ —SM |
Tops in your field DZ 2
Tops in your field …You are tops in your field. Tried to follow Elliot Wave international for years. They were always behind the market. After discovering you, I perceive that you are an expert in reading the waves, which puts you way ahead of the rest of your peers. And you can read the Waves like you are reading tomorrow’s financial section. I pray you stay healthy. —DZ |
Rise above the rest … SM 2
Rise above the rest …I have only ever met a few people who, in their chosen fields (astrology, medicine, music, martial arts, technical analysis), rise above all the rest and you are one of them…you have ‘the gift’…and that’s why I’m a Trader’s Gold member. —SM |
Couldn’t be happier … KK 2
Couldn’t be happier …The analysis and insight you provide is simply amazing! I’ve been trading the futures and equity markets for well over thirty years and usually average around 5% monthly. Since joining your Traders Gold Service two months ago, that number has better than doubled. I couldn’t be happier.—KK |
The best of them JL 2
The best of them …Last couple of years, I subscribed to several ‘market traders’. You are by far the best of them and the personal contact is awesome. Daily and daily updates are very well written! Besides your expertise in EW, I also like your cycles analysis. Best investment I ever made! —JL |
Get an upper hand … JC 2
Get an upper hand in trading …Seeing all the different currency pairs and the wave structures and hearing you explain why this has to do that on a nightly bases gives one a upper hand when trading. Elliott Wave applies to all stock and indices and can be applied to any candlestick chart. If someone ask what you want for Christmas – Tell them a membership to Peter’s “Traders Gold!”—JC |
A true expert in Elliott Wave FL 2
A true expert in Elliott Wave …You are a true expert in EW analysis. What you provide is not available anywhere and is priceless. Subscription on your services is the best thing I have ever done. Many thanks for your effort to make me a better investor. I now have more trust in my investment decisions. I hope you will continue the excellent work! —FL |
Have not had a losing week RW 2
Have not had a losing week …I have been with Peter almost a year. The only thing that matters is have I made money with his service. I think I have finally turned the corner using Peter’s EW. I have not had a losing week in the last 5 months. Thanks Peter, for your amazing amount of hard work. —RW |
US Market Snapshot (based on end-of-week wave structure)
This chart is posted to provide a prediction of future market direction. DO NOT trade based upon the information presented here (certainly NOT from a daily chart).
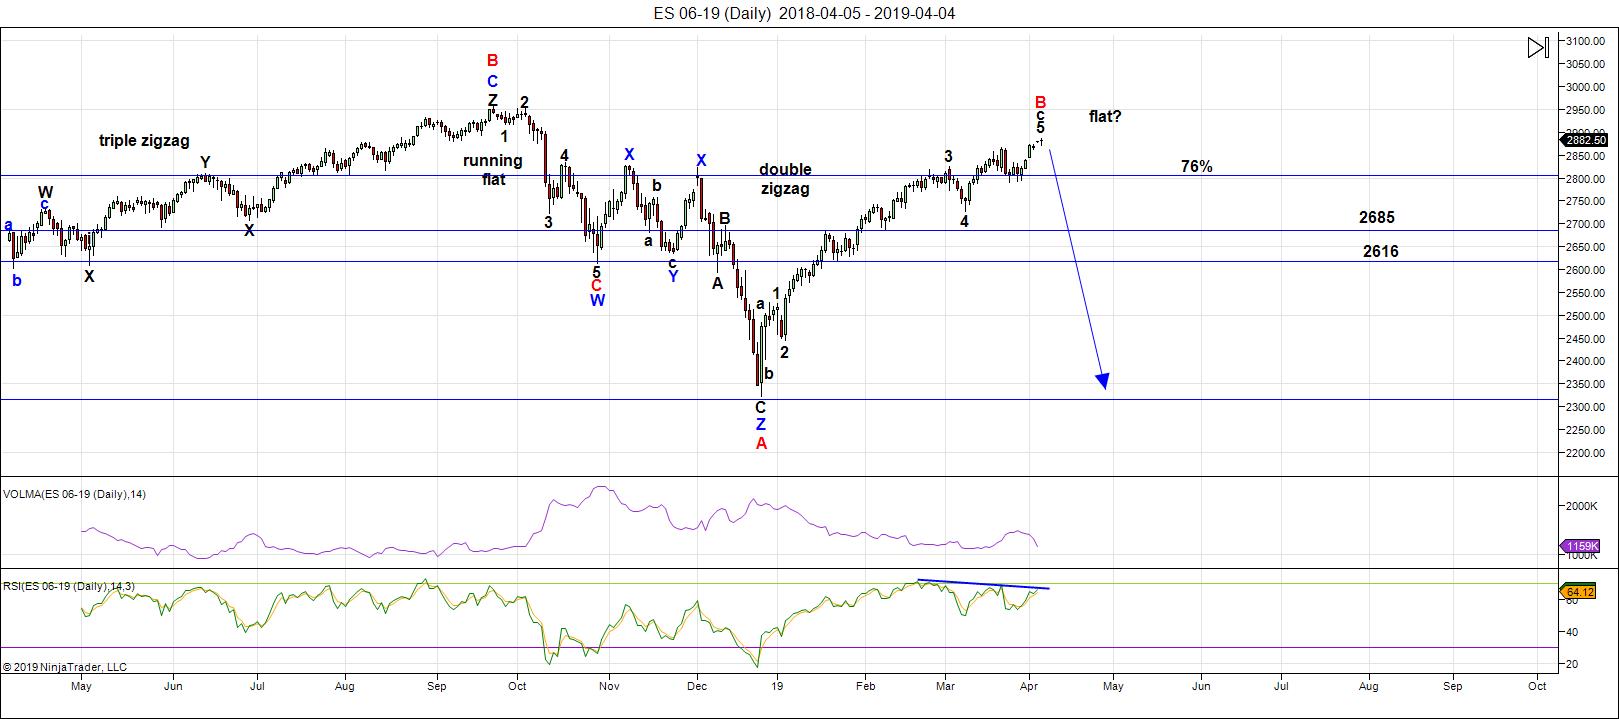
Above is the daily chart of ES (click to enlarge, as with any of my charts).
We're still sitting near* the top of a B wave that's risen to about the 76% level of the height of the previous set of waves down from the all-time high at October 3, 2018. Almost all the other assets I cover on a daily basis are hovering near inflection points.
*That word "near" means we're close but not at. It was the same word that was there last week.
The US indices are are working getting all "the gang" to a new high (same line that was here last week), as predicted in past weeks; progress is slow. That's because all asset classes I cover have to top (all the same market) before we they can all head down in tandem (same wording as last week).
As I've been saying, IWM (Russell 2000) and the DOW both need new interim highs before everything heads down in a dramatic capitulation (UPDATE: the DOW has reached a top/IWM HAS NOT — go check this out and don't snipe at anyone in the meantime). The US Dollar Index also has another leg down before it turns up in earnest.
(So far, this write-up is the same as it was last week, although apparently I called a top somewhere — still trying to find that entry).
We're in the final bullish 5th wave in ES - a minimal new high to finish what appears to be an expanding triangle.
The next major move is to the downside (boring, I know, but the same as last week).
As I've been saying, the wave up from Dec. 26 is clearly corrective and, as a result, must fully retraced. This is supported by the US Dollar Index, the major USD currency pairs, WTI Oil, along with DAX and other international exchanges.
Summary: Waiting for a first wave down; I suggest you do the same.
Once we've completed the fourth wave down, we'll have a long climb to a final new high in a fifth wave.
___________________________
Trader's Gold Subscribers get a comprehensive view of the market, including hourly (and even smaller timeframes, when appropriate) on a daily basis. They also receive updates through the comments area. I provide only the daily timeframe for the free blog, as a "snapshot" of where the market currently trades and the next move on a weekly basis.
______________________________________
Sign up for: The Chart Show
Next Date: Wednesday, April 10 at 5:00 pm EST (US market time)

The Chart Show is a one hour webinar in which Peter Temple provides the Elliott Wave analysis in real time for the US market, gold, silver, oil, major USD currency pairs, and more. You won't find a more accurate or comprehensive market prediction anywhere for this price.
Get caught up on the market from an Elliott Wave perspective. There’ll be a Q&A session during and at the end of the webinar and the possibility (depending on time) of taking requests.
For more information and to sign up, click here.
| "I think you are the only Elliot Wave technician on the planet who knows what he's doing.” |
| m.d. (professional trader) |
All registrants will receive the video playback of the webinar, so even if you miss it, you’ll be sent the full video replay within about an hour of its conclusion.


Peter T,
Thanks for the update. We continue to wait. All I know about EW (from a novice point of view) is what you have taught. I’ve never seen you deviate from that course. I find other contributors interesting, but EW seems the most principled and consistent. To me, as you teach, it is a principle, that’s it. A tool to utilize.
When others seem to argue with you, there ignorance appears evident. It seems that those who “create chaos” on this blog should be blocked from contributing, if they cannot respect the dialogue.
I know I’ve said it before, but thanks again for the wisdom you give.
Jeff T
Thanks, Jeff.
haha … there were some classically stupid statements on display this week, the one on lightening striking has to be my favourite all-time, bone-head comment. I’m happy to introduce moderation to the truly deserving. I can’t change people and I can’t change the market. They are what they are.
Thank you for the new post Mr. Temple!
I just created a Twitter account @WCIforum for people to exchange thoughts and/or emotions not suitable here. Mr. Temple, if you don’t like this idea, please let me know and I will delete the handle. Thanks.
Hi Peter and friends
energy chart for this week posted below
https://ibb.co/1d6t99w
Reason 4 my absence:
the energy chart did something I have never seen before
three weeks ago the chart flipped and has remained in this state
since. I’ve seen the odd day or 2 inverted and even a week but not 3
weeks in a row. I did not want to post something I could not explain or confuse people. Now that a pattern has been set I feel more comfortable posting. Just in case the pattern reverts back to the previous pattern? I’ve included both options for the coming week.
Tom
Amazing Tom! I have a theory…
As Exec. Director at the Foundation for the Study of Cycles, we were doing similar work, and found that our data very often inverted at the equinox.
Thanks Peter
Thank you Tom! I have a request: can you update your email address to those in your mailing list?
It seems to me the central EW concept of herding as the main driver of market price, in an era of CB intervention in narkets, is debatable. I have a number of reasons for wondering about this.
Firstly, is the persistently low market volume as prices have risen higher.
The way in which this is inimical to the “herding” concept is self-evident and needs no elaboration.
One corollary of this of course is that low volume markets can be more easily driven in either direction.
Retail investors who were leveraged (nargin debt was at an all time high) at last October highs faced margin calls during the steep market fall. Even those not leveraged lost a lot of money. To argue that retail investors are now responsible for driving the market back to near all time highs strikes me as far-fetched at best, and implausible at worst. That opinion is supported by the facts. Corporate buy-backs have been the main driver of this rebound. In fact, retail investors continue to steadily depart this market.
Despite no formal announcement, I think the final piece of the puzzle to solving this remarkable rally is a resumption of Q.E.
I freely admit I cannot prove this and it is merely my opinion. That opinion is based on observing money flows around support/resistance levels. What you see is phenomenal buying power often gapping prices past those levels. That is not imho retail sentiment, but CB buying. I contend that CBs remain the main drivers of market prices today, and as long as they are buying, chances are price will go higher. I am not sure of the implications for EWT. but I do not believe the role of CBs can be dismissed as some insist, Peter excepted of course.
It looks to me like they are targeting 2900.
I am going out on a limb and predicting if we CLOSE above that round number pivot, we will be challenging SPX 3000.00
You cannot, imho, ignore the Central Banks when trying to gauge how high this beast can climb.
Trade Safely.
Thank you Verne. I’ve grown to respect you as a trader.
I know Peter has been calling for some sort of “turn” for a long while, hopefully soon. I don’t understand the science of EW as well as most, but it appears to me that some outside force is hell bent on taking this market higher and higher. Maybe CBs?
I’m tempted to get off the sidelines and put a toe back in the water. For all we know, this could run to 3,000 or higher like you are suggesting. Every time I think, “here we go, it’s finally coming down”, it goes higher. This doesn’t feel like a top is close to me. I might add some SPY or QQQ ETFs this week.
Max,
I hear what you are saying. It’s like the boy who cried wolf. There may eventually be a drop, but it’s hard to believe it’s going to happen because it keeps going up.
Personally, I don’t see a case for the bears. I ignore the noise, investing for the long run. Economy and stock market still healthy! This approach suits me fine. I buy whenever there’s a big drop and it always comes back. Stay focused on long-term goals and you will be fine. Remember, it’s time “in” the market, not trying to “time” the market.
http://tinyurl.com/y6q4khy7
Anyone hoping for a down in the market is just wishful thinking. As Peter says trade what you see not what you think. This is a BULL market. All of the economic news lately has been extremely positive. Why would the market drop?
http://tinyurl.com/y6q4khy7
B waves are unpredictable animals. If that is what we have, nothing about the behaviour of this one is too anomalous, granted it has gone on for quite awhile. From an EW perspective, how you trade this market really depends on whether you think the move off the December lows is corrective or impulsive. Those in the latter camp clearly would have a bullish outlook, and if right, could safely swing trade or remain invested long the market for many weeks, even months ahead before we see a serious correction. Those in the corrective camp, by definition expect the entire move up to be retraced, with the December lows ultimately taken out. Nothing in life, besides death and taxes, is certain, but Peter T has made a cogent case for the move up being corrective. The bearish divergences in my own favorite indicators support that conclusion. If those divergences are negated by new AT highs in both price and indicators, I would clearly have to reconsider my conclusions. Another analyst I think knows EW well is Avi Gilburt and he does have an ALTERNATE count that calls for an upcoming second wave in a new impulse higher. The depth of the next correction will leave absolutely no doubt which view is correct. My expectation is for both 2800 AND 2700 to be demolished in SHORT ORDER, if we start a C wave down at this degree of trend.
I like Avi’s analysis better if he says 3,100. That makes more sense than “hoping” for a C wave. Where is his web page?
Thank you,
Milo
I’ve seen most of the analysts calling for 3k on S&P and 28k for Dow. That probably means Peter’s wave count is off as some alluded to?
I’m not sure how wave counts can impact tops? Or maybe Peter’s count can still allow a new all-time high? Maybe someone who knows EW can weigh in and let us know how there can be a new all time high AND still expect a C wave? What pattern is that?
http://tinyurl.com/y6q4khy7
Here, here! on the divergence Verne… and convergence of BTFD crowd. Net short by CTFC non-comercials is most negative in long time, and big increase in 5yr UST pushes short curve inverted (again). In rate of change terms, very interesting juncture (?) But I know the market is going to 3000 (sometime) 😉
Sorry! Net short by CTFC non-comercials (of VIX)
Tom c
I have been very impressed with your energy model .
I don’t know how you calculate it but you have done a very
Good job showing its worth .
My own work tends to invert from time to time and usually
If I’m going to see an inversion it tends to show up sometime
Between November to February .
For what it’s worth .
I also saw a longer term inversion take place back in the year 2010
And I’m begining to wonder if that finally flipped recently .
Glad your seeing it working even if inverted .
Peter T
After reading Raymond merrimans blog last night and then reading
One readers comments ( Raymond has been around for decades )
The readers comments were not polite ( keeping it simple )
I have never seen such comments on his blog before .
Your not alone is all I’m saying .
What ever the herd is thinking overall I’ll guess and say social mood is changing
In a negative way .
I’m not talking the stock market I’m talking social mood .
I know you understand where I’m going with this so I’ll keep it short .
People should read and understand socioeconomics and really look
Around the world to see what is going on social mood wise .
Thanks for your time and efforts Peter
I appreciate it .
Joe
Thanks for your input Joe
Thanks, Joe.
I’m very bearish on the comments section. Its days are limited, I think. It’s become mostly opinion.
I tend to think it adds some spice to the work Peter does. As long as people are respectful toward Peter’s work and the time he puts in and other posters. To me, it’s a great way people can discuss what’s going on – sharing ideas and strategies. My vote is to keep the Free Blog open. If people are rude, simply boot them. Don’t let a few naysayers ruin the good that this blog does.
It’s great to have a collaborate process to see what other view points there are. For example: turn dates, solar impact, energy charts, Verne and Charlie trading ideas, etc. That was what brought me here. Peter’s amazing work and a great community. That’s my two cents!
Joe, Yeah, I see … haha. Don’t know what touched her off. And she wants us to listen to Mark Carney … a bankster?
“I’m very bearish on the comments section….It’s become mostly opinion”
absolutely on point!
Blow off top
assuming the energy chart doesn’t flip back to it’s previous state
Friday April 12th appears to be the blow-off top and trend change date
Andrea may want to add his 2 cents about this pivot point
energy chart confirms the reversal
remember this is all speculation
so tread carefully
https://ibb.co/mz5DkTR
Hi Tom, it appears the SPX is following the first energy chart (upper one). Does your updated chart projects turn up tomorrow and a top on Thursday? Thanks.
Tom C,
Can you please help us and explain how you chart is constructed, give us some idea from where you are gathering this information. We have looked at https://www.spaceweatherlive.com/en/auroral-activity/aurora-forecast but cant decipher what you have got.
Also are you thinking mid week dip before we can buy again for friday ramp.
On a public forum such as this, it is inevitable that you are going to get a wide variety of perspectives and opinions. As long as posters are polite, I see nothing wrong with that, even if they are wrong. The great thing about open discussion is that it eventually becomes quite clear who knows what they are talking about, and who do not. If the forum is to be truly educational, I think we have to be open to allowing those who may have incorrect perspectives on the market to learn how and why that view is right or wrong. Market price is the ultimate arbiter, and will ulimately make clear which opinions are informed and which are not. I realize this is not a trading forum and so will respect Peter’s guidelines and not focus so much on specific trades.
But imagine for a moment, if every market opinion was required to be accompanied by specific action being taken based on that opinion? I gurantee it would not take long for the forum to become a much quieter place!
Thanks Tom..much appreciated.those charts are awesome…and Peter keep up the great work..
and if there is a way to get on the email list..please let me know..thank you!
Hi Joe, I have a quick question.
I know you are primarily a swing trader/investor and was wondering how you manage winning trades.
Do you have a pre-set profit targets? Add to the position? Use trailing stops? I tend to do the first, but as you can imagine, you can often leave a lot of money on the table. I am not sure how long I will hold the RIOT trade but the starting fifth wave means we are going to see new ATHs in Bitcoin, unless we get a fifth wave failure.
There are some legacy stocks I have held for years (mostly miners) and will never sell as covered calls means I am holnding pretty close to zero cost basis so it would smarter to eventually donate them, Thanks bud!
I agree. However, I do think the explosive energy displayed will come on the reversal.
The banksters have driven prices to these new highs with freakish leverage, and the underlying persistent bearish divergences is a dead give away, some now on daily time frames. The brutality of price reversals from these kinds of patterns does not represent dumb money suddenly becoming smart and deciding to sell. It represents banksters unwinding leveraged positions and literally stealing from traders positioned long and not giving them time to exit. Capisce??!!
I don’t know why I do it…I guess I just want to try and keep some of you out of trouble… ☺
I think we have one more high just ahead after this dip, so it is looking like any conquest of 2900 will be short-lived.
Anyone else noticing how much “spoofing” has been going on in the markets lately?
Today we have yet another gap down after a hanging man potential reversal candle. I suspect it is more bankster B.S.
Wanna bet the crooks fill that gap with another ramp higher?
Here, here! on the divergence Verne… and convergence of BTFD crowd. Net short by CTFC non-commercials (of VIX) is most negative in long time, and big increase in 5yr UST pushes short curve inverted (again). In rate of change terms, very interesting juncture (?) But I know the market is going to 3000 (sometime) 😉
They-re pushing Max Headroom on indices right now. If they can push thru, might hit ATH, but it feels corrective to me, and I added to shorts this morning
Hi Max. In some cases price alone does not tell the entire story. For example, expanded flats can put in a higher price than the start of the corrective pattern. Whether or not to trade them is entirely a matter of the trader’s level of sophistication in recognizing the pattern as it unfolds. Other indicators, such as persistent bearish divergences that accompany new highs is one of the things that can alert a trader to higher prices being bearish. Hope that helps a bit.
Note the DJIA doji on Friaday after the price gap higher. Ordinarily that candle represents buying exhaustion. If you attribute price pattern to only herd sentiment and fail to reckon with the constant attempts of the CBs to drive market price higher you will probably find yourself on the wrong side of the market often. In times past I would have happily shorted that Friday candle. Now, after years of observing how the banksters roll I know better. My only question is how much leverage can they actually deploy. Of course they are lying through their teeth about the official 30:1 limit. Only a fool would believe that this cabal would be subject to any kind of restraint, official or not. A move higher from here is going to require even MORE leverage, in the fact of such obvious market weakness. Nothing about this market surprises me anymore…..
I like the way you think… and I like being able to think that way. I started investing 36 years ago (my mentor told me to invest 10% of everything I make… I told him my new job only paying $672/month, after tax/insurance it’s only 300 bucks. He said “SO, you can’t live on that… put away 30 bucks a month 🙂 I went 100% cash Q1 2008, averaged in starting 6/2009 but now <20% market and trade around positions. I will use EW and overbot/ oversold indicators to offset top sectors with VOL positions and inverses as position size allows. Thanks for your feedback Verne, also Peter T, Joe and others. Cheers!
Most welcome Mojo. Nothing makes me happier than seeing traders beat the banksters and make winning trades. It’s the main reason I post, as well as to try and learn from others. Those of us alive at this point in market history are facing incredible, once-in-a-generation opportunities. Indeed if Sir Peter is correct, it would multi-generational as it could be a 500 year cycle top! Short term timing may need a bit of tweaking, but I think Sir Peter’s larger contextual analysis is on target. If you are a smart trader, and can maintain a larger perspective, you won’t be caught dead picking up dimes in front of an on-coming freight train, now would you? Best to leave that kind of thing to gun-slingers like Charles and yours truly…Lol! 🙂
HaHa! Feels lot like gun-slinging and avoiding trains lately. I would like to be on the right side (in a big way) on the next big drop on next 6-36 months (cuz I’ll certainly miss the next 500 year cycle HaHaHa!! Using an inhale/exhale approach to position sizing waves, trends and cycles to this (eventual) cycle low, then throw on long term asset allocation (which isn’t this site goal). Great day to be alive! ..LOL
Anyone following the circus in US politics?
The Democrats have descended to a whole new level of stupidity.
The saw the intellectual acumen of Mr. Barr when they interrogated him during the confirmation process.
Why would any intelligent Democrat, that vast majority of whom are are as dirty as as a NY Mafioso, go out of their way to antagonize a man like Bill Barr??!!
It is going to funny to watch what he does to those idiots.
They have no idea how they are being set-up in all that bellowing to see ALL that is in the Mueller report. You know what? They will1
And boy are they going to need some new Depends when they do…Hehe!
Certainly with you on that.
My wife watches this stuff, but if I had her reply, Peter T would ban me from the site HaHa!
Pete – what’s the probability of when this market drops to your target of around 2100, it then take’s years to do your 5 legs back up to an ATH. My thinking could this market follow Phillip Anderson’s real estate cycle that has it pecking around 2026 with a sharp dip around now which is happening in Oz at the moment or is this the end of real estate as we know it. https://www.lfeconomics.com/analysis/will-aussie-housing-market-peak-2026/
i know you rate him.
https://www.zerohedge.com/news/2019-04-08/ghastly-vancouver-home-sales-crash-46-lowest-1985
In Canada, it should be done. The drop so far around the world is growing, so we’ll see. I’m using Dewey’s original data and extrapolating with it. The Canadian low was around the year 2000.
I think the last wave up should only take 1.5 – 2 years, based upon the same distance in the 3rd wave up. I think there’ll be another QE to get us there. All speculation at the moment. I’ve always been at odds with Phil Anderson’s dates.
Steve Puetz also has 2026 as the next high, but it doesn’t necessarily mean an all-time high; it just means a high for that 18.5 year cycle. I can’t imagine that with what I’m seeing in Calgary, for example, that we can last at highs for another 7 years …
Oil is going to come way down with this coming drop and that’s going to cost a lot of jobs and exacerbate the situation, at least in Canada.
Thanks Pete. Fun times ahead. Weird stuff going on over here with Vegans protesting in the streets and on farms etc over the use of animals. To me it shows how way off realty we have come. Everything is too easy and if you are protesting on the food you eat then life is at its peek. Very strange but the Aussie humor is alive. check this out.
https://www.facebook.com/burrumbuttockhayrunners/videos/vb.1397618033820716/2363204350561759/?type=2&theater
He’s quite a character … lettuce has a heartbeat … yeah, people are coming up with pretty strange stuff. But this is just the start. After the turn, we get into a lot more mysticism … according to history.
Verne
Your question is simple but it’s a tough one for me to answer .
How do I manage a winning trade ?
First of all I am a follower of the simple 500. 700 and 900 daily moving averages .
I also buy stock specific to sectors . I follow the wave counts of the sector as well
As the individual stock along with my own index which uses the stocks I own .
It’s the group more so then the individual stock .
So as example only .
The semiconductor index ( $Sox ) holds specific stocks
Yet I don’t own all of them . I selected the stocks based on valuations and technical analysis
As well as timing .
Once I’m invested in a stock my initial target is both value based and pattern based .
I follow the group and let the individual stocks run .
when I see a price target being met I look to sell a portian
Yet depending on the cycle were in I will leave money on the table until a cycle high is reached based
On time more so than price .
Other times I will let a stock run but I will look to exit for various reasons .
An example : TEVA I bought several years ago because it was one of my choices to be invested in
The drug sector . It was undervalued and I think ( this was a while ago ) it had completed a multi year triangle
( my favorite pattern for entry ) . Shortly after my purchase it lagged the others in the sector badly yet stayed flat
So I held it . Then I got an email from my brokerage company ( they never send me emails ) their recommendation
Was to sell the stock. That email upset me just a bit because I felt I had made a good purchase and so I held .
Then the stock started to run higher . Then comes a new tax law change and I notice I am being charged a foreign tax
Which was the entire dividend ( this is in a SEP IRA account ) that tax told me to sell yet I held a bit still frustrated
And finally I just got fed up and following the cycle high date with the stock in decline I dumped the entire position .
I had a decent gain yet I felt my reason for buying was two fold . I wanted the dividend and the capital gain .
The stock went into freefall eventually and I was happy to be out of it .
Another stock as example only :
DIOD
I have an upside target in the low 50’s I’m currently overweight tech . I have held the position a long time
And my decision is to close it come mid August .
Every time I buy a stock their is a reason behind it .
Semi conductors I figured years ago would end up in everything so I felt the semis could grow .
I’m not a big believer in the internet of things yet others are .
I really don’t want my fridgerator or heat pump being set up on WiFi yet for some , the idea of your heat pump
Notifying someone that it needs more Freon or some part sounds good yet to me it’s a set up to be scammed .
How do I know if the tech who shows up at my house is legit or not .
Anyways .
I take the group of index’ s , Dow Sox spx ndx transports nya and I put them in a spread so to speak .
And I chart the entire market that way .
I do the same with my stocks and I do it like a sector .
Txn+nvda+intc+on= total . I run it both by stock price as well as dollar amounts ( number or shares )
Txn*100 + nvda*50 etc….. If one of the stocks runs in a huge way and it goes out of balance with the others
I thin it out .
I rarely add to a position how ever I will note you can make a very large fortune by focusing on a single stock
And adding on the way up . It’s just not my style .
Back in 2014-2015 I felt the market was going to tank yet I also felt we were going into a 4 th wave . So I sold a fair amount
Of stocks , thinning everything out based on the larger index wave counts As well as sector rotation I felt was coming .
In 2016 I felt a low was due near the elections yet I did not want to take on any new stocks because I could not find anything
That fit my value requirements so I just held . When the market took off following the election the wave count looked
Perfect and then the market extended beyond where I felt a wave 5 should have gone and their was still time left before the
Late 2017 early 2018 high so I just held and let the market do what ever it is going to do .
This past December the market had gotten so oversold ( a typical extreme I’d say based on my occilators which I have history
Going back to 1928 ) that I felt I would use those extremes to find some undervalued stocks . On average those stocks were 56%
Under priced . The dividends were decent and Peter T back then had been looking for a swing low on the SPX which was similar
To my level on the cash Dow . So I bought them a week prior then I had intended to figuring I’d ride out what ever came next .
To wrap this up .
I pick sectors , I dig into the individual stocks with in a sector index ( if the index rises chances are the stocks with in it will rise as well ) I run valuations checks and pick the most undervalued stocks with in that sector index and the minimum is a 40% undervalued calculation or I won’t buy .
When the stocks get up close to the initial valuation price level and I see a cycle high date I decide either to thin based on price
Or hold to a specific date . I also ask where is the market in terms of Elliott wave count and how overbought is the market
Based on my longer term and shorter term occulators .
I also ask what is the future ?
AI is being touted as a big deal , I tend to think it’s not such a big deal for the masses .
The average person will not need artificial intelligence yet the medical field might make huge strides using it .
I have followed a large pattern in both the HUI and the XAU index and also the gold to silver ratio .
Regardless of the US dollar index I put a portion of my money into various gold and silver stocks back in Sept 2018
Because I felt an uptrend was due and it’s a larger multi year pattern I’m following . This pattern though does not
Call for new all time highs in this next swing . I would never advise someone to trade a 3 wave move ( what I’m expecting )
Yet I am ok trading 3 wave moves .
I view the markets not as a stock market but as a Market of Stocks .
It is possible to create your own index or mutual fund so to speak .
You can weight it any way you wish .
The Dow today did what was expected . I will not touch the spx
Sorry if I got long winded here yet I was trying to explain all of what I do
To follow a winning position and my reasons for selling or thinning .
CMS I have held for a very long time . In January 2018 I felt that the utility
Sector was topped . I sold out of all utility stocks with the exception of CMS
Which I thinned by 75 % . My basis is we are in a rising interest rate cycle
And that typically is bad for utility stocks . I felt that the utility sector had completed
A multi decade ending diagonal wave pattern which then called for new multi decade
Lows . I was wrong …the utilities index made a new all time high yet I cannot change
My wave count because it still looks like the same wave count to me .
So I’ll admit I was wrong back in 2018 but I will continue to avoid utility stocks .
I held the 25% portion of CMS because it’s been good to me and I have a negative cost basis .
This next cycle high either Aug 13- Sept 6 or January 2020 is a big one in my work .
Martin Armstrong keeps pushing his Jan 2020 date as a cycle low .
Not saying I’m right or he is wrong . I’m just saying to me it’s an important turn in my cycles
Work . The years 2020-2021 are stacked and I’ll jump up and down calling them bearish
Years . The year 2020 could be just crazy where we see both an important high as well as
An important low .
I would be a fool not to use this run higher into August as a time to either close long positions
Or thin long positions or a combination of.
If we throw in politics I’d be writing more pages so I’m going to leave politics out .
Peter T, thank you
Tom
Your welcome 🙂
Thanks Joe. A much more sophisticated regimen than I.
That was indeed strange getting a letter like that from your broker. I wonder if they were part of the divest movement against Israel. The tax is even more strange. In a retirement account divedends are not usually taxed. VERY strange.
Market..at critical juncure.. my 2850..2880&2895 targets reached now reached on both ES & SPX..
2900..2940..2950..upper targets looking okay..but would appear that there needs..a pullback as rally..runnin exhausted..
Now..2 paths still in play folks..
1..SIR PETERS flat takin SPX to at least 90%..done! Side note..flash crash in 2015 & 2016..had 93% retrace..that brings us to 2day..93% is jus unda 2900..if pattern repetes..hmmm..
2..expanded flat path..where we get up to new highs & my upper targets..git hit!
Pls pls pls use..caution..many say imma uber bull..NOT TRUE!
I play da trends..in a long cycle so..imma naturally long..NOW
BUT day..to..day..i often go short..like today at open to catch a quick 25% in options.. UNLESS ur swift & nimble like Mr Verne & me..use caution cuz the writing is on wall that a turn is a coming..
I always say fall in luv wit peeps..dont fall in luv wit ur stocks!
Lowry’s has recently (last week) reported the lowest selling pressure recorded since the 2009 lows.This is ctertainly not news to traders. There are no sellers in this market. This is a monstrous problem for bankstets leveraged to the hilt. They cannot unwind. There is no one to put in a market bottom on any serious decline by short covering. The talking heads attributing the recent run-up to “short-covering” are fools at best. and disinformation agents at worse. For reasons I prior cited ad nauseam, it is likely leveraged buying, with likely a bit of stealth QE. thrown in for good measure. If that is an ED I spy with my little eye, we know how they conclude. As I said, those brutal reversals is not a sign of dumb money suddenly becoming smart. It is leverage unwind whereby they fleece momentum traders and trend followers as well as the sad schmucks who have had retirement funds plowed into the markets the last srveral months. It is all quite sad, but very predictable. This is what bankstets do. They steal!
The litany of gaps we have seen on the way up means we are going to see the unwind unfold in tranches, as those gaps are all filled on the way down. When is this going to happen?
Don’t know.
Don’t care.
Just knowing that it will is good enough for me.
A good start would be a violent break of the large rising wedge.
Oh I know they are going to throw in all kinds of head fakes to try and mask the unwind but they are hopelessly trapped, and those downside tatgets will very likely be achieved.
It is not vety often you get to grab the banksters by the short hairs, so to speak.
Just be ready!
It could be awhile before a similar opportunity presents itself….
Just also a quick shout- out to all the posters who add VALUE to the discussion. No need to mention names. You know who you are. Thank You! Nice to see sniping abate. I doubt the forum would be long for this world if it continues. Of course, snipers will always snipe, here or elsewhere. I actually had an individual from this forum post on another site that my trading ideas are not my own.
Can you imagine?!!
The kinds of trades I make NOBODY ELSE does.
WHY?
I invented them!
Others have offered me money. I share those strategies freely.
Traders I showed how now execute them routinely but NOWHERE will you read about them.
I mention this to tout the value of also having thick skin! Lol!
who, when, where?
I find headlines a bit humorous at times so I offer this one .
S&P and Nasdaq eke out gain; Dow drops on Boeing, GE weakness
seekingalpha.com
I bring this up because I see headlines like this all the time .
GE is not in the Dow anymore !
Boeing though is a big mover of the Dow .
I’m convinced late May early June is a Low now .
It runs from May 22 to June 3 . Not going to change my mind on that .
I’ll explain my reasons another day in as much detail as I can but
Not today . While I favor from a risk reward vs time point of view
I think the last week of April will be the best time to enter a spec short position
I do not have a cycle high date calculated at this time . My reasons for the late
April high are based on a pattern I’m looking at .
To sum it up, I can be wrong timing a high but I’m pretty much convinced May 22- June 3
Will be an important low .
I do not know if that cycle will also show up in bitcoin or riot for that matter but I’ll watch
For it just because . Not a forecast Verne but I thought I’d mention the date in advance
And explain it when I have time to go into detail because it’s a cluster of time .
Then after it proves itself ( or not ) I’ll state price and what I call a time based stop .
This week my bias is sideways . The Dow I said in the previous thread should have an
Inside week . Now new high this week yet now low below last week’s low .
Boeing is a big Dow mover so worth watching.
Next week should be sideways as well with an upside bios .
I would not touch Boeing with my worst enemies money !
That is all I can add at this time .
Verne
You think for yourself which is a very good trait
Those who can’t think for themselves or don’t understand the market
Just cannot accept others who do
Not all people are bad mind you but many read regurgitated ideas
” The Herd ” is not individual thought .
Tune out the negative quickly is all I can suggest .
Who ever said it might be baiting you
I’d avoid them in the future
BTW, RIOT coiling for another blast higher!
Added another boat-load of 5.00 strike calls for June @ 0.78, and hoping for at least a double in a week or two! 🙂
Great advice Joe! Thanks!
That G.E. headline is an absolute riot! 😁
Here is how I expect VIX to signal the top:
We will see yet one more vicious smash down to new lows in the form of an opening gap down. Doesn’t look like it will happen today. At the top VIX should bounce off that new low with gap closure and a higher close. Look for it….!
Home Prices’ Rapid Decline Warns of Recession Ahead
https://economyandmarkets.com/markets/real-estate/home-prices-recession-warning/
Harry Dent has been calling for a “Dark Window” move to new highs, but could test Dec lows first. Article above is his look at real estate which is similar to Peter T. Harry called for rebound in Dec to Dark Window because market didn’t “fit” the average drops of 2000 and 2008 (~41% drop in 2.6 months), so possible drop into May-June (like Joe) and then move to highs into late 2019-20 (like Charles). Like Joe says, you have to think for yourself and have a plan, how you execute, cut losses, know your set-ups and triggers. Appreciate everyone’s thoughts trying to dodge and weave through all this. I think it is interesting What Peter T does with his work and his association with Andy Pancholi, who also wrote a book on upcoming cycles with Dent. I don’t know if anyone subscribes to Hedgeye, which looks at 4 quadrants based on 2 factors: inflation and earnings and whether they are going up or down, specifically looking at rate of changes. Different factors are overweight or underweight in different Quads (Q4 was Quad 4, now Quad 3 for next 3 quarters). They have risk ranges for many products; If buy in Quad, buy bottom of range, sell top. If short in Quad, short at top, cover at bottom of range. Inflation and earnings are the 2 most causal factors in Ray Dalio’s work and his All Weather portfolios. Hedgeye has quantified it into a process… we all need a process. Cheers!
Funny you should mention those headlines Joe..I find them very comical every morning..and I think who pays for someone to write that crap
BTW, an analyst and VIX watcher with far more skills than mine ( Mella from Northman Trader) thinks that VIX has ALREADY broken higher from a bullish falling wedge. She could be correct. It does look like it came back down to tag the wedge upper boundary. If so, we will see VIX divergence on any new market high and my expectation of a new VIX low will be proven wrong.
Forecasting and trading are two different skills/jobs. Even while trading, it is extremely important to understand your own time frame rather than look at what others are doing. If you can learn from others, great. If not, they are best ignored if all they are providing is an opinion rather than a method. A method is very useful. My time frame is longer than some of the people who post over here – but that doesn’t mean I don’t benefit from what they post. I have been building a short position for weeks now – thats how it always goes with shorting the US equity markets. Either you are early or you are late – choose your poison. I don’t know of anyone who is exactly right about timing a top. I have a mix of outright shorts (cost basis now 2850 thanks to some range trading) and June 260 240 put spreads on SPY (entered between 0.80 and 1.15). For some people, I am already wrong (because I started shorting this market in early March). But then, this is how I trade. Once certain momentum indicators turn, I start building my position. At times it works out. At times, I get stopped. Just some food for thought – 90% of the rally from Dec lows had already been achieved by early March.
Hyuk! Hyuk!
Man, I just LOVE the precision with which Bill Barr knee-caps grandstanding intellectual pygmies trying to bully and intimidate him! Sweet! He!he! 😁😁😁
Flagging action in the index so we likely have some more downside but I do not think we have a top.
I suspect this move down is a bankster bear trap in the form of some kind of fourth wave. One more move up I think….getting close…!
DJIA shows two gaps down on 5 hour chart, SPX one. In the absence of selling pressure, does anyone else find that a bit suspicious? Sneaky bankster exits to throw us off scent?
QQQ is levitating compared to DJIA, RUT and SOXX. Most of it tied to VIX above or below 14. Interesting stuff from Mella, but the manipulation continues…
Amazing, is it not? 😱
When it comes to manipulation, I can say with a fair amount of confidence the move down today is bear trap B.S.
I see a few folk breathlessly opining: “We have a top!”
I doubt that. The price action does not remotely resemble a bankster leverage unwind, and believe me, you will not miss it when it arrives. I think they are not quite done. I would love to get a better entry on June expiration SPY 285 strike puts!
Standing by….
We have seen this play-book so often before it is laughable how predictable it has become. They play possum around or just under the round number pivot for a few sessions before jacking prices up past it. I expect the same here. The bottom of the SPX cash session gap is at 2891.16 so a move past that resistance will signal start of the next ramp higher…..
This (never) ending diagonal looks tired… VIX almost 14… yawn 🙂
These last 4-5 days feel a lot like end of Sept top, with even a possible evening doji. We’ll see move and volume before adding more… price, volume, volatility
Double yawn!
We now have a fill of last Friday’s gap technically making it an exhaustion gap.
In addition today’s gap down bolsters the bearish case with an island reversal pattern. The problem is that these signals are meaningless in a bankster driven market as we have seen them repeatedly negated by cabal buying. I am not buying any of this unless and until I see 2800 fall on high volume and price never looks back. That’s just lil’ ole me!
Almost back to levels where smart money sold VOL 4/3. Markets red around world, no large volume just yet but BTD crowd has to become nervous to counteract banksters…
Watching paint dry. No move below DJIA 26K and SPX 2860 means NO UNWIND. Nothing to see here. Tomorrow is another day. Laters, Alligators! 🙂
Ok, going to write up a few reasons why I favor a May 22 to June 3 low
Some of this you will have to look up and do your own research on if
You have the interest . Many of these themes line up each year .
It’s worth looking up is all I’m going to say .
Roughly calendar 30 days ( 20 to 25 trading days before a solar eclipse is a market turn )
July 3 is the solar eclipse ( July 3 minus 30 days = roughly June 3 )
The move from a new moon to the solar eclipse is usually a sloppy up trending or down trending move
We can argue this forever but this is my reasons so if you wish to disagree please show me your reasons .
Next : please read Chris carolans work .
http://spiralcalendar.com/chapter-1-a-detective-story/
My basis from that link above for the year 2019 .
The first new moon following the spring equinox
Is early April ( going by memory so look up when that new moon was )
The spring low is the 2 nd new moon plus 22-23 calendar days .
May 4 2019 plus 22-23 calendar days = May 26-27 th ( May 4 =2-1 )
Mars sextile Uranus on May 22 ( I look for mars Uranus 59 degree separation )
Following mars 59 degrees I look for a strong rally . It’s the typical move in this cycle
So I won’t fight it .
Now while I give credit to Steve puetz I’m choosing to post my observations here so please
Accept my observations and my credit to Steve puetz yet I’m choosing not to debate .
My observations of the puetz crash cycle is it’s a market turn cycle with a strong panic type
Rally or crash ( it’s not always a crash )
The larger move begins on the lunar eclipse following the solar eclipse .
The set up begins 30 days before the solar eclipse .
To close this out .
Mars Uranus 60 degrees May 22
https://darkstarastrology.com/2019-aspects/
As noted I mark the 59 degree day
June 3 new moon prior to solar eclipse
Spiral calander spring low due May 26-27
That’s my basis in as simple an explanation as I’m able to put it .
This is also leads to bearish cycles begining between August 13-Sept 6
As well as the mars Uranus bear cycle which begins Nov 24 2019
But those I’m leaving for another day .
Regardless of where this market goes throughout the month of April
That may 22-June 3 time frame has short term to medium term Cycle Low
Written all over it .
I mentioned the advance decline line , up vol minus down vol and the 5 day trin sum
As well as the 5 day moving average of the daily trin which were all warning on Friday .
We can all look at a simple 14 day rsi .
I’m just pointing out some simple indicators warned of a decline and I’ve given my reasons
For why a short to medium cycle low is due in late May .
Now it’s just a matter of will the market prove my timing correct .
It does not matter to me how far the market decline yet the Jan 22 lows kind of matter to me
At this stage of the cycle .
Pattern wise though there is a catch .
Following next week I’m expecting new highs in the Dow which could possibly become new
All time highs if the pattern continues . If that holds true the last week of April is a peak
Which will be followed by a decline into late May .
The focus for me is not the potential rally between now and the end of April
My focus is the Cycle Low due May 22- June 3 .
Good luck everyone .
I hope some of you back test this . You will find it educational .
What happens when corporate America runs out of buy back cash ?
It’s certainly not a fundementally driven market so worth reading
And understanding what’s going on from this guy’s point of view
https://www.marketwatch.com/story/if-this-relentless-bid-dries-up-investors-could-face-gruesome-nightmare-2019-04-09?siteid=yhoof2&yptr=yahoo
Joe, it seems to me, If I remember correctly, that the last few lunar and solar cycles saw not significant correlation with market price action. I don’t know nearly as much as you about this but I do remember paying very close attention as a few folk had cited upcoming super blood moons and other events as possibly being significant. I know the correlation is not always a given and we also do see inversions as well but I get the impression one can never be quite certain how these events will correlate with market price.
WHOAAAA!!!
Who in the hell lit that fire under VIX? Lol!
Are they planning a futures ambush??!! Hehe!
Don’t know if you guys are following AES..could be a good one to watch..
This website is for educational purposes relating to Elliott Wave, natural cycles, and the Quantum Revolution (Great Awakening). I welcome questions or comments about any of these subjects. Due to a heavy schedule, I may not have the time to answer questions that relate to my area of expertise.
I reserve the right to remove any comment that is deemed negative, is unhelpful, or off-topic. Such comments may be removed.
Want to comment? You need to be logged in to comment. You can register here.