

For Trading and EW Novices
For those of you who know little about Elliott Wave and apparently don’t want to read the book to learn about it, let me try to make a few things a little clearer.
I called this B wave (that we’re near the top of) a corrective wave right from the start .. because it was and is one. It will never be impulsive. That was a no-brainer to me.
I’ve been sniped at all along the way. That’s OK. People who don’t understand often do that, and I have a thick skin. But, as I’ve said, I will not allow the negative comments; I will remove the ability to comment if they continue.
For someone to accuse me of being stubborn because I will not change my mind about what is clearly a corrective wave up, is a sign of abject ignorance. To people who think like this (including Global Warming nut-cases), I would suggest you to go another blog and find a wave count that’s more to your liking. Let your ingrained bias direct your future in the market.
This is an educational blog. Here’s some is some educational points (all of which I’ve written about previously in this blog):
- Some time ago, I provided a list of 14 reasons this wave up is corrective. I had no points on the other side of the equation. To tell me my count is wrong misses the point
- You should not, under any circumstances whatsoever, trade based upon a single daily chart (like the one I provide here). That is sheer insanity and shows a complete lack of understanding of trading and the market, never mind Elliott Wave. ! As Bernie wrote me on Friday:” I was just saying that you probably would have a higher probability of getting struck by lightning than trying to trade on these EW forecasts.” He’s absolutely correct, but not for the reason he thinks.
- I DO NOT, as a rule, recommend trading corrective waves (I have written about this previously here). It’s a countertrend move and therefore, is extremely risky. You can triple that sentiment for this particular B wave; it is the most dangerous one I’ve ever encountered, as it’s in the middle of a fourth wave. On top of that, futures and cash have different bottoms (about a 30 point differential), so you can’t reliably measure it — which I have stated several times over the past few months)
- Elliott Wave methodology requires that you wait for a trend change, which is signified by a first wave with a 5 wave count that travels to the previous fourth wave of one lesser degree, followed by a second wave of three waves that retraces 62%. That’s the entry. That is a top. There has not been a top, so I HAVE NOT called one. I’ve been warning of one coming, but this is certainly not the same thing.
All you people who are really ticked off (and sniping) because you didn’t lose any money on my watch: Please go somewhere else and lose money there; you’re novices and have a lot of learning to do (and some growing up to do).
All those who don’t like the methodology:
- it’s not mine, so I don’t really care what you think of it (it’s cowardly to criticize a dead guy, because he can’t fight back)
- ignorance breeds fear and misunderstanding: Learn
- you should have your own trading methodology. This free blog is not here to provide you with trading entry or exit points. It’s here for educational purposes only
- don’t snipe at each other (or me, but I have a thick skin, so you’re just showing your ignorance)
- pay attention to the commenting guidelines; they’re quite simple
I’ve also written about FOMO (the fear of missing out) here. It’s a powerful force; don’t let it ruin your life.
One more thing. There are times when being part of the herd is a good thing (as in third waves). It is not a good thing at the top of a B wave. If you don’t think for yourself in the market, you are destined for failure.
And, if you don’t pay attention to the past, you are destined to repeat it.
The following article is from Investopia
What is Herd Instinct
Herd instinct is a mentality that is distinguished by a lack of individual decision-making or introspection, causing people to think and behave in similar fashion to those around them. In finance, a herd instinct relates to instances in which investors gravitate toward the same or similar investments based almost solely on the fact that many others are buying the securities. The fear of missing out on a profitable investment idea is often the driving force behind herd instinct.
BREAKING DOWN Herd Instinct
Herd instinct, also known as herding, has a history of starting large, unfounded market rallies and selloffs that are often based on a lack of fundamental support to justify either. Herd instinct is a significant driver of asset bubbles in financial markets. The dotcom bubble of the late 1990s and early 2000s is a prime example of the ramifications of herd instinct in the growth and subsequent bursting of that industry’s bubble.
By nature, human beings want to be part of a community of people with shared cultured and socioeconomic norms. Nevertheless, people still cherish their individuality and taking responsibility for their own welfare. Investors can occasionally be induced into following the herd, whether through buying at the top of a market rally or jumping off the ship in a market sell-off. Behavioral finance theory attributes this conduct to the natural human tendency to fear being alone or the fear of missing out.
Herding and Investment Bubbles
An investment bubble occurs when exuberant market behavior drives a rapid escalation in the price of an asset above and beyond its intrinsic value. The bubble continues to inflate until the asset price reaches a level beyond fundamental and economical rationality. At this stage in a bubble’s existence, further increases in the cost of the asset often are contingent purely on investors continuing to buy in at the highest price. When investors are no longer willing to buy at that price level, the bubble begins to collapse. In speculative markets, the burst can incite far-reaching corollary effects.
Some bubbles occur organically, driven by investors who are overcome with optimism about a security’s price increase and a fear of being left behind as others realize significant gains. Speculators are drawn to invest, and thus cause the security price and trading volume to climb even higher. The irrational exuberance over dotcom stocks in the late 1990s was driven by cheap money, easy capital, market overconfidence and over-speculation. It did not matter to investors that many dotcoms were generating no revenue, much less profits. The herding instincts of investors made them anxious to pursue the next initial public offering (IPO) while completely overlooking traditional fundamentals of investing. Just as the market peaked, investment capital began to dry up, which led to the bursting of the bubble and steep investment losses.
_____________________________
Elliott Wave Basics
Here is a page dedicated to a relatively basic description of the Elliott Wave Principle. You’ll also find a link to the book by Bob Prechter and A. J. Frost.
____________________________
Registration for Commenting
Want to comment? You need to be logged in to comment. You can register here.
If you register, it protects your information. It also allows you to comment without filling in your information each time. Once you’re registered, simply go to the home page and click on the login link top right in order to log yourself in. Usually, you’ll be logged in for several days before needing to be logged in again.
______________________________
Problem receiving blog comment emails? Try whitelisting the address. More info.
______________________________
Couldn’t be happier … KK 2
Couldn’t be happier …The analysis and insight you provide is simply amazing! I’ve been trading the futures and equity markets for well over thirty years and usually average around 5% monthly. Since joining your Traders Gold Service two months ago, that number has better than doubled. I couldn’t be happier.—KK |
A true expert in Elliott Wave FL 2
A true expert in Elliott Wave …You are a true expert in EW analysis. What you provide is not available anywhere and is priceless. Subscription on your services is the best thing I have ever done. Many thanks for your effort to make me a better investor. I now have more trust in my investment decisions. I hope you will continue the excellent work! —FL |
Tops in your field DZ 2
Tops in your field …You are tops in your field. Tried to follow Elliot Wave international for years. They were always behind the market. After discovering you, I perceive that you are an expert in reading the waves, which puts you way ahead of the rest of your peers. And you can read the Waves like you are reading tomorrow’s financial section. I pray you stay healthy. —DZ |
Have not had a losing week RW 2
Have not had a losing week …I have been with Peter almost a year. The only thing that matters is have I made money with his service. I think I have finally turned the corner using Peter’s EW. I have not had a losing week in the last 5 months. Thanks Peter, for your amazing amount of hard work. —RW |
Get an upper hand … JC 2
Get an upper hand in trading …Seeing all the different currency pairs and the wave structures and hearing you explain why this has to do that on a nightly bases gives one a upper hand when trading. Elliott Wave applies to all stock and indices and can be applied to any candlestick chart. If someone ask what you want for Christmas – Tell them a membership to Peter’s “Traders Gold!”—JC |
Rise above the rest … SM 2
Rise above the rest …I have only ever met a few people who, in their chosen fields (astrology, medicine, music, martial arts, technical analysis), rise above all the rest and you are one of them…you have ‘the gift’…and that’s why I’m a Trader’s Gold member. —SM |
the real deal SM 2
The real deal …‘Educational, insightful and thorough market analysis for all levels of traders. It’s Elliott Wave at its best….Peter Temple is the real deal’ —SM |
The best of them JL 2
The best of them …Last couple of years, I subscribed to several ‘market traders’. You are by far the best of them and the personal contact is awesome. Daily and daily updates are very well written! Besides your expertise in EW, I also like your cycles analysis. Best investment I ever made! —JL |
US Market Snapshot (based on end-of-week wave structure)
This chart is posted to provide a prediction of future market direction. DO NOT trade based upon the information presented here (certainly NOT from a daily chart).
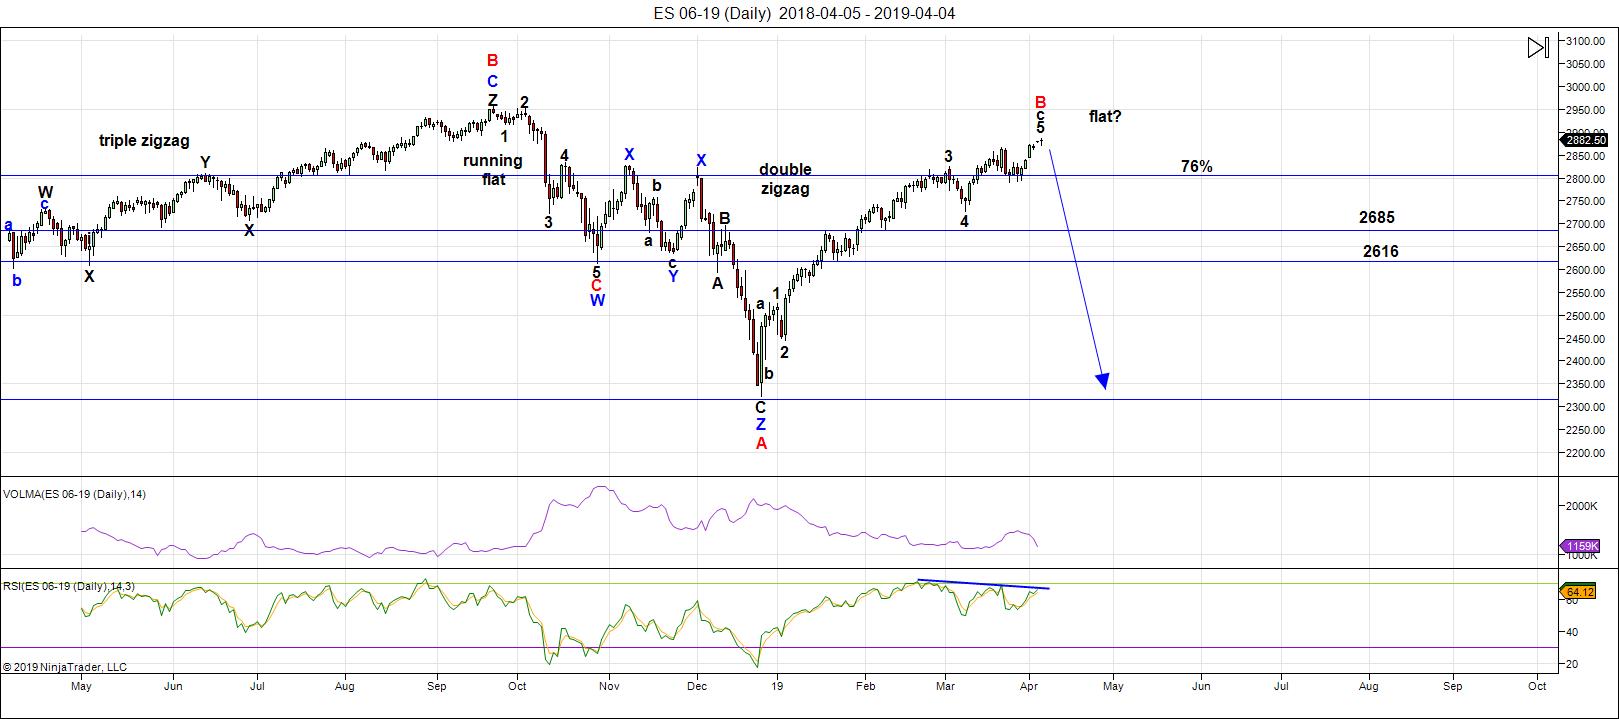
Above is the daily chart of ES (click to enlarge, as with any of my charts).
We're still sitting near* the top of a B wave that's risen to about the 76% level of the height of the previous set of waves down from the all-time high at October 3, 2018. Almost all the other assets I cover on a daily basis are hovering near inflection points.
*That word "near" means we're close but not at. It was the same word that was there last week.
The US indices are are working getting all "the gang" to a new high (same line that was here last week), as predicted in past weeks; progress is slow. That's because all asset classes I cover have to top (all the same market) before we they can all head down in tandem (same wording as last week).
As I've been saying, IWM (Russell 2000) and the DOW both need new interim highs before everything heads down in a dramatic capitulation (UPDATE: the DOW has reached a top/IWM HAS NOT — go check this out and don't snipe at anyone in the meantime). The US Dollar Index also has another leg down before it turns up in earnest.
(So far, this write-up is the same as it was last week, although apparently I called a top somewhere — still trying to find that entry).
We're in the final bullish 5th wave in ES - a minimal new high to finish what appears to be an expanding triangle.
The next major move is to the downside (boring, I know, but the same as last week).
As I've been saying, the wave up from Dec. 26 is clearly corrective and, as a result, must fully retraced. This is supported by the US Dollar Index, the major USD currency pairs, WTI Oil, along with DAX and other international exchanges.
Summary: Waiting for a first wave down; I suggest you do the same.
Once we've completed the fourth wave down, we'll have a long climb to a final new high in a fifth wave.
___________________________
Trader's Gold Subscribers get a comprehensive view of the market, including hourly (and even smaller timeframes, when appropriate) on a daily basis. They also receive updates through the comments area. I provide only the daily timeframe for the free blog, as a "snapshot" of where the market currently trades and the next move on a weekly basis.
______________________________________
Sign up for: The Chart Show
Next Date: Wednesday, April 10 at 5:00 pm EST (US market time)

The Chart Show is a one hour webinar in which Peter Temple provides the Elliott Wave analysis in real time for the US market, gold, silver, oil, major USD currency pairs, and more. You won't find a more accurate or comprehensive market prediction anywhere for this price.
Get caught up on the market from an Elliott Wave perspective. There’ll be a Q&A session during and at the end of the webinar and the possibility (depending on time) of taking requests.
For more information and to sign up, click here.
| "I think you are the only Elliot Wave technician on the planet who knows what he's doing.” |
| m.d. (professional trader) |
All registrants will receive the video playback of the webinar, so even if you miss it, you’ll be sent the full video replay within about an hour of its conclusion.


O.K.
The immediately SMASHED VIX but look at VX…!
It is giving the short sellers the proverbial finger.
This is about to get REALLY interesting…Lol!
Got the pop out the Vix today..but sold end of day..this could bounce tmo..
Peter:
thanks for your heads up, how low do you think the market will go with this C wave? Dow 23000 or 18000?
thanks for your time
For the DOW, somewhere around 18000 is my preferred target.
do you still think the correction is now? however looks at the technical chart , monthly is three white soldiers , it is very bullish though. confusing!!!
I just looked at the SPX monthly chart. I do not believe those candles meet the strict requirement for a TWS pattern. Look closely and it is quite obvious
It is true that the A/D line and OBV are making new ATH and I would ordinarily consider that quite bullish.
What is going on in this market right now is dangerous and deceptive. We are getting those signals in the larger context of a steep bearish rising wedge, steeper than the last one, and we saw how that one ended
Furthermore, bearish momentum divergences at recent new highs persist. Be careful out there!
Peter T
You mentioned pipelines the other up in Canada .
This project in southern Oregon has been a battle
For a very long time . As I drive around the area I have
Noticed a lot of infrastructure being set up even though
They were waiting on an approval . In January 2017 the trump
Admin had mentioned they intended to approve this site
Even though they didn’t mention it by name .
I’m certain they will meet what ever they have to get approved .
This will help me to exit 🙂
My plan was two fold rental income and appreciation and if
Jordan cove actually came to be I’d sell during the construction phase
As the what was to be 7 billion flowed through this small community .
Now there saying 10 billion .
http://www.kallanishenergy.com/2019/04/03/ferc-releases-draft-eis-for-jordan-cove-lng/
Pembina will probably sell part of their ownership off as they
Put it together . They will be building this on a sand bar in a potential
Tsunami zone .
Amazing
energy chart update
https://ibb.co/bgvqZJh
Thank you Tom!!
Thanks Tom, April could be a big turn.
12
Verne
I just read your comment
Joe, it seems to me, If I remember correctly, that the last few lunar and solar cycles saw not significant correlation with market price action. I don’t know nearly as much as you about this but I do remember paying very close attention as a few folk had cited upcoming super blood moons and other events as possibly being significant. I know the correlation is not always a given and we also do see inversions as well but I get the impression one can never be quite certain how these events will correlate with market price.
Answer
I guess it just depends on how you look at them .
Jan 4 solar eclipse ?
That Jan 21 super blood moon you mentioning ? Yea no significance to the Dow ( I’m kidding obviously )
I will admit though Dec 3 into the Jan 4 solar eclipse technically failed but for other reasons .
Jan 4 plus 6 weeks was mid Feb , the full moon surrounding that date being Tuesday Feb 19
Again no real correlation ( Dow peaked Feb 25 ) again I’m kidding .
It might not have been an extreme swing like a low to a high but it was certainly am extreme panic like move 🙂
Anyways I gave my reasons for a May 22 to June 3 low .
Now it’s up to the market to prove it right or wrong .
I’ll accept being wrong but my reasons are valid ( by me anyway 🙂
Until next time .
Tom C
Thank you !
I look forward to your energy chart going from late April into May 🙂
I’m a bit biased
Thanks
Verne
my last comment on this subject only because i do not want to
create any debates.
RIOT close at 1.57 on Jan 22 .
Just 1 example .
I think many people overlook acceleration moves
I appreciate the reponse Joe, and you are certainly right there have been times of VERY noticeable correlation. My only point was that since one does not know ahead of time if that will obtain, it makes it tough to trade, at least from my perspective. I do think perhaps in conjunction with other things the cycles can perhaps inform one’s thinking on PROBABLE outcomes. Thanks!
It looks to me like attempts at vol supression are becoming more frenzied but returns are diminishing. Vol supression and all other iterations of the short vol trade is one of the most reckless and bordering insane things the banksters have done the last ten years. It can’t end well, imho……
In case you are wondering what I am talking about, what was the reaction to fading futures this morning?
Yep! Short the HELL out of VIX!
These people are STUPID!
259000 or a close below in the Dow..I think is the line in the sand..if above 2600 I think we have one more up…
sad to hear about your community Joe ..
Yep. The round numbers definitely in play…big time. I expect at the very least an intra-day blast past them to allow a bit more distribution to “dumb money”.
typos..still haven’t finished my coffee.. 26,000
25,900
also…could be having a good Dust move coming up.
also…have IIPR on my radar..cannabis real estate stock..may grab that one in the next large dip..looks like wave 3 just completed and now in 4 down..
Eyeing DRIP for a nice run as oil heads for the basement
Trying to get in cheap via selling of 8.00 strike naked puts. Yikes!
Of course you NEVER, EVER, sell naked puts unless you actually intend to be assigned shares if in the money at expiration…but y’all knew that! 😊
Quad3 (inflation turning up, earning slowing) good for energy (I stopped fighting it for awhile 🙂
Hey Mojo! You trying to rain on my parade dude?
Peter T says oil in the twenties, Y’hear?? 😁😁😁
It really is amazing that market makers were willing to pay 1.00 for June 8.00 strike DRIP puts. They must be very bullish on oil!
If assigned at expiration my cost basis will obviously be 7.00 per share, and if Peter is right about where oil is headed, they paid me waaaay too much!
For educational purposes only. Of course!😋
If the cabal is shorting vol in an attempt to juice the risk parity trade yet VIX keeps rising…!!!
Uh…Oh!
Anybody else noticed that crazy VIX candle this morning?
Whoever pulled that stunt had his ass handed to him on a brass platter..hehe!
I forgot!!!
Today is VIX liquidation!
Ooops! The market makers are back to their old tricks.
They probably screwed a lot of folk holding at or near the money options this morning at liquidation.
Figures!
Best ramp above resistance in VIX since the 3/19 to 3/25 ramp from 13 to almost 18.. we’ll see
Verne, EIA Petroleum report in 10 minutes too…
Yep!!
Reading PDF now…
Yeh DWT up a little bit, QQQs trying to rebound, looking like spike with no teeth…
Dead man walking..!
RIOT flying a very nice bull pennant. Projected move to at least 8 next few weeks. I hope I get to buy back my 5 strike calls ÷q before it takes off….yikes!
Go Bitcoin! 😇
if anyone is trying to learn charting and Elliot wave I have found the 2 hour chart.a great chart for trading triangles..more swing trades..
Verne
Your correct, one never knows for sure what the market will do
But probabilities favor from time to time one direction over the other .
Looking at Riot which I’m just following at this point
Jan 22 to Feb 19 kind of fit . That was my only point .
Looking at BA and not for trading in that stock but just following
it because it moves the Dow .
From the low at 292.47 to the high at 446.01 BA moved
Up 153.54 points . A .886 retrace of 153.46 point move
Would be a 136.03 point drop from the high . A .786 retrace
Being a 120.68 point drop . Not a forecast just point to possible
Support .
446.01-136.03 = 309.98 and high minus 120.68= 325.33
Check my math please .
The first leg down was from 446.01 to 361.53 , an 84.48 pt drop
Which was also an 18.94% drop over 3 weekly bars .
The bounce was from 361.53 to 398.66 , a 43.95 % point retrace
Yet it was a 10.27 % bounce or a 54.22 retrace in % terms .
10.27% bounce / by the 18.94 % drop .
2 equal point drops would imply another 84.48 points lower
From the 398.66 swing high which would target 314.18 level .
2 equal % drops would imply another 18.94% drop from the 398.66 swing high
398.66* .1894 = 75.50 pts from the 398.66 swing high and target 323.16
As noted above , the .786 retrace =325.33 which is very close to the 2 = % drops .
The .886 retrace targeting 309.98 not that far away from the 2 equal point drops at 314.18 .
Averaging all 4 targets 314.18 + 325.33+323.16+309.98 = 1272.65/4=318.16
Somewhere down there I’d say at a minimum we would see a bounce .
3 weekly bars down in first leg then 2 weekly bars up in the bounce . 2/3=.66 time retrace
And a .54.22% retrace . All in 5 weeks . From the swing high at 398.66 ba has been down for a total
Of 2 weeks . If it drops next week it will have 2 3 week drops separated by 1 2 week rally.
The grand total being an 8 week decline . It’s all Fibonacci .
To really make this fit BA should be into its lower target area range of 325 to 309 next week .
That’s just me playing with the numbers . Do not trade BA on my thinking .
I do not have any wave count on this stock and no opinion on it long term
I do not own it and have no intention to buy it or trade it .
My only reason for follow it is because it is the highest weighted stock
in the Dow Jones industrial average .
Following next week’s movements in the cash Dow my pattern I’m following
Calls for a rally into the end of April then a down month of May .
Next week is basically another sideways or inside week .
After next week a rally phase is Technically due and will probably
Take the cash Dow to new all time highs . I’m not trading it and I’m
Not forecasting it . I’m just saying if all this plays out as the correlation
Calls for then after next week ( and why I’m watching BA ) BA would only
Bounce in a further bearish set up and the cash Dow would appear to signal
All is well. Then we get the bigger drop in Boeing and another decline phase in
The cash Dow into the May 22 June 3 time frame .
I’m more interested in taking some bearish positions in the last week of April
And then covering those hedges sometime into that cycle low period .
Plan your trade and trade your plan .
For better or worse that is my plan .
Enjoy the weekend everyone
I have nothing further to add for really the next entire month .
🙂
Just read through the data sheet for BA’s PMIC (Power Management Integrated Circuit) for the MX7 and I think they are going to be in a world of hurt.
Owners of the aircraft are now asking BA to compensate them for loss revenues over the plane’s grounding. It seems to me that is only fair. BA is going to be out tens of millions if they are forced to pay up. If they fight it in the courts they are going to be out tens of millions, and they may still have to pay up. Ouch!
Joe I think your donwside targets are quite generous!! 🙂
Energy chart update
https://ibb.co/gwWmJhm
Thanks!
Morning Peter..I didn’t get the chart show in my email last night.can you kindly resend thank you!! Marie
Thank you for the energy chart..i like the way you broke it into hours..
Sir Charles, interesting the puts we are eyeing are down along with market price this morning. Still trading at around 3.50. Waiting for the spike… 🙂
Thanks to the RIOT short sellers I was able to buy back my short 5.00 strike calls for a nice 35% profit! Hehe!
These short sellers are getting eaten alive but they keep coming for yet one more spanking….Hyuk!
No cigar on bankster attempt to penetrate VIX gap at 12.82.
The desperation is starting to escalate….Hyuk!
Vol supression that fails to boost equity prices a very bad omen for the bulls…are they asleep?! 😉
Awwww…! C’mon bulls!
We want cheaper puts!!
What the hell are you doing?? Buy! Buy! Buy! 😀
Not looking like I am going to get those cheap DRIP shares at 7 buck apiece.
RATS!!! 🙂 🙂 🙂
If that was an ED in NDX 100 it needs to take out 7496.33 and do it post haste…!
Energy Chart update
https://ibb.co/jrNmxwR
Thanks again Tom.
https://northmantrader.com/2019/04/10/combustion/
Interesting article for you bankster loving folks… and the beat goes on, click, click…
That lines up with Charles’ suggestion that the current top on this wave up won’t be until October. I’m sure glad I cashed in my short positions and added S&P ETFs a few weeks ago. I see another one of Charles’ targets (2900) was hit today. He also identified 2940 and 2950. The S&P is so close to all time highs that it seems almost certain that it’s once again heading to new highs.
Peter, time to throw in the towel on the C wave idea (for now)?
Maybe in the Fall your predicted wave down will finally unfold? I’m not saying this to criticize but rather to point out the obvious, which is that there is too much upward momentum for this to just keel over.
That’s called herding. There’s a good article on that somewhere.
Thank you Peter. If you find the article could you please forward the link to us?
this might be the most [http://tinyurl.com/y5eedmol] post in the history of the WCI public blog!
Whooosh. What a pump today. If earnings come in really really poor we might just rocket to new ATHs! This is a critical moment for the bears as the bulls have unwavering optimism that central banks policies have created a permanent recession free environment. I expected this final surge but also expect a rapid reversal next week otherwise for me it back to the drawing board although Peter’s weekend update should inspire.
That’s what I’m talkin’ ’bout!!
Go Bulls! 🙂
Verne, are you still long? I saw Charles thinks this run is going to 3,000. Do you as well think that’s likely? I just don’t see this market turning over anytime soon. What could possibly stop all the money flowing into yeh markets?
While I am not currently long the market, I think the close above 2900 brings 3000.00 into play. As I have mentioned a few times I place a tremendous amount of weight on how market price behaves around these round numbers. I was expecting a move higher due to the obvious sideways consolidation of the last few weeks. That has been the very predictable outcome for a quite some time. To be frank, while I expected the 2900 level to be challenged, I also felt that the immediate bearish case required that it prove strong resistance and that any move above it would be short lived. Obviously that did not happen, so on that score I was wrong. In my opinion we do not yet have a top. I find it easier to follow Elliot wave counts that include wave degrees as that makes it easier to determine the price level at which the count is incorrect. Quite a few capable analysts are now counting a fifth wave up albeit at quite a wide range of degrees, with some projecting declines at minor, intermediate,, and even primary degree. It is really incredible that analysts using the supposed same methodology can produce such varying counts. As to how I am trading the move, I am using the move up to scale into short trades as that is the approach most option traders take. We try to get positioned just slightly ahead of the actual reversal as option premiums move sharply higher with volatility making risk/reward less attractive. I exited at my target of 2875.00 and clearly I was too early. If 2900 continues to provide support I think the market will continue higher, with 3000.00 being certainly not out of the question/ Just my two cents! 🙂
Thank you Verne. Didn’t you quote EW trader recently? I’ve seen they are also calling for a possible “alternate count” that heads up to as high as 3040. I have also seen many analysts saying this is a 5th wave too, but I believe Peter has explained that isn’t possible. I’m glad I followed Charles into some long positions. If this does indeed go up to 3,000 then I can make up for many of the losses I had shorting the market.
Why don’t you folks who criticize my Elliott Wave counts (based on nothing but opinion) do your own counts or provide even the thinnest of technical data to back up what comes out of your mouth, or off your keyboard?
The correlation to the market based on the cash Dow called for this
Past week and this next week to both be inside weekly bars .
This past week if I am to be very strict made a slight lower low than last
weeks low yet did fail to make a new high . Not far off the mark but I’ll admit
I was wrong even if generally correct .
Now comes next week . If we get another basically sideways week ( cash Dow only as I’m
Not touching any other index’s here ) if this continues and next week is more of the same
Then the Dow again stays inside this past weeks range . Then following this up coming weeks
Inside weekly bar the Dow would head higher into the last week of April before turning down
Giving us a down month of May .
I’m unable to call this an impulsive move .
I’m with you Peter T , we are in a B wave .
Counting from the December lows on the Dow I can’t call this impulsive so
I must call it a B wave ( at a minimum its a 3 wave movement )
cycle wise though I still feel we are in a bullish cycle into Aug 13- Sept 6 at a minimum
And another bear cycle begins Nov 24 2019 .
A ton of reasons to be bearish in the year 2020 into January ish 2021 at a minimum .
The drop in May is where ( based on my cycles work ) the rubber meets the road .
And the rally phase from that may 22- June 3 time frame ( if it’s going to be correct )
would technically be a blow off type rally .
Welcome to the world of complete lunacy and herd mentality to an extreme .
Raymond merriman warned about this possibility and given the 3 wave moves
When this market turns down its going to be a quick steep drop.
All is not well Jamie diamond
Enjoy the weekend everyone .
Dow theory anyone ?
I’m no expert yet take a look at the Dow transports .
Not even above the Nov 2018 highs and clearly not
An impulsive rally .
NYA ?
More of the same .
This market is decievimg .
Everyone watches the spx ndx or Dow yet
I don’t think many dig .
So many non confirmations going on .
Rally phase yes, but this is not a move based on
Anything fundemental .
Look around the world and see what’s going on politically .
Armtrong was right, we are witnessing the collapse in government .
Raymond merriman seems correct as well .
Peter T, I’m seeing many counter trend bounces .
Back to work so I’ll be out of touch .
Thank you for everything . 🙂
I know Peter has been calling for a “turn” for many a moons, he will eventually be right based on the count. How much higher and for how much longer are the remaining questions with this “B” wave. I am personally appalled by how many on here criticize the hard work and time put in by the host. You may disagree, but please be respectful.
This is a “free blog”, you are not entitled to everything Peter knows or offers and certainly can’t hold him liable if you made trading decisions based on his free analysis. I’ve seen a lot of people mad that they’ve been short based on Peter’s call for a turn at “any moment”. Trading is a science that involves forecasting both time and price. Unfortunately I haven’t been able to use EW for timing, but instead use it for big picture analysis while using my own trading tools and procedures for trade entries and exists. Please take responsibility for your own actions and don’t disparage the host for his analysis wherever he is right or wrong.
Yep. The move down to the December lows was clearly in three waves. I remember quite a few analysts calling for a fourth and fifth wave that never came. We saw, in my opinion, yet another example of the power of CBs to arrest impulsive looking declines, which frankly, they have been doing for years. I try my best to come up with a reasonable EW count that breaks no rules and explains the price action we are seeing. I early on decided that if we had only a three down for that ferocious decline, we were likely looking at bankster intervention to arrest it and would likely see at the very least a flat correction and possibly an expanded flat. I set my upside targets based on the EW rule that the B wave of a flat must retrace at least 90% of the A wave. I know it seems simple but my EW skills are very limited inddeed so I have to keep things simple. The interesting thing to me personally is that a new index high is not necessarily bullish. Every experienced trader is keenly aware that the most potent weapon in the banksters’ arsenal when it comes to making fools of even seasoned traders is the expanded flat.
Have a great week-end everyone. See ya in a few weeks!
“If” this is a B wave, it most likely is an expanded flat. The S&P has retraced 564 of the 594 points already (95% retrace). It only needs 30-odd points now making it very high odds it’s going to a new high. If the S&P does in fact hit a new all time high, that would make it an expanded flat.
“Wave B also is a 3 wave structure and advances beyond the origin of wave A to an extension most commonly 123.6% of wave A. The invalidation level for the completion of wave B is above 161.8% of wave A.”
https://elliottwave-forecast.com/elliottwave/elliott-wave-expand-flat-correction/
Wave A was almost 600 points at 594. That means 123% (common expanded flat level) is 730 points. The expanded flat would be ruled out at 161.8% or 961 points.
Likely top of B wave could hit 2,346 + 730 = 3,076. That’s right in line with Charles’ call for a top around 3,000 or higher. Great job Charles! You called it months ago.
The expanded flat would be ruled out at 2,346 + 961 = 3,307.
I’m so glad I added S&P ETFs a few weeks ago on Charles’ awesome targets and will add more on Monday. It seems like there’s plenty of additional upside potential now! So happy for this free blog. Thank you Charles and Verne.
Peter T
Another social mood trend observation .
The opening paragraph or 2 is what I’m pointing out .
Just saying your not alone on the bickering on the
Chat forum .
https://caldaro.wordpress.com
Max
Just a question to think about .
Let’s say spx went to 4300 yet it does so in a 3 wave movement ( just a made up price level )
Would the rally be something other than a B wave ?
Joe,
I don’t know what the pattern would be but according to the EW rules, the expanded flat would be ruled out if it went that high. I think based on how high the retrace has gone so far that this probably is an expanded flat. It’s going to take some really big event or news to change the sentiment (something big to blame the mood change on).
There are no sellers any more and every dip is short lived. And according to most of the stats I’m seeing, there is a ton of cash on the sidelines so my best guess is all that money floods into the market once we get a new all time high. Then there is a blowoff top taking this rally above 3,000. Timewise most of the analysis I’m seeing calls for an extended rally through the summer. Don’t modt crashes happen in the fall and winter?
There is something truly irrational about folk who insist on trying to short a market that is in a clear up-trend. I just don’t get it.
Even if you believe, as does Glen Neely that the entire move up off the 2009 lows is some kind of “corrective” wave, using that designation as a reason to short a ten year run higher is nonsensical in the extreme. Clearly any discussion of trend, or corrective versus motive has to take place within a time-constrained context when it involves trying to profitably trade the market. For traders, this is not a matter of mere theory when money is at stake. In my humble opinion, a failure to make this critical distinction is the most problematic issue I see with some folk trying to use EW analysis to inform their trading decisions. I came to the conclusion a long that if the guys who wrote the book have demonstrated such miserable failure in correctly calling the market, my own chances of accomplishing that were minimal. Few of us have spent the time as Peter has in painstakingly learning the nuances of the methodology, and as some wise man once said, a man has to to know his limitations!
Most welcome Max.
Full disclosure, I still consider the move off the December lows, as vigorous as it has been, an intermediate term counter-trend move and some kind of flat. As I previously indicated, while I was clearly too conservative, my upside target was 2875 for a regular flat correction and I exited my long positions once we reached that price target, according to my plan. I agree with the likelihood of the market traversing the remaining relatively short distance to new all time highs, but to be quite frank, I also think the risk/reward of trading the market’s long prospects is high considering the size of possible decline I think is ahead. I will not alter my outlook even if we do notch a new ATH. Some EW gurus with far more skills and experience than I are counting an impulse up and are expecting only a relatively shallow fourth wave intermediate correction after we notch a new ATH. I respectfully disagree. I am using the move higher in price to get positioned for a very large C wave to the downside to at least 2100.00
That is very interesting Verne. Thank you for the food for thought. I’ve used some put options a few times in the past in order to try to catch these down moves. Once I did okay, the other two times my puts expired worthless because the move didn’t happen within the allotted time of the contract. How do you know where to go? I mean this rally seems unstoppable. What if it keeps going up for a few more months? Puts for the months of May or June wouldn’t help. Most are expecting a fall crash now with it being a favorable seasonal time of year and if earnings remain strong. What do you suspect would be something that could create a change in sentiment?
It is one of the greatest ironies that bear markets do not BEGIN with bearish sentiment, nor do significant market declines, so while the sentiment metric is useful for describing what drives market price for EW theory, it is absolutely useless, except perhaps to be contrarian, for deciding when to execute trades that are likely to be successful.
Just think about it. Are you more likely to be successful shorting the market when EVERYONE is bearish, or when they are bullish? Clearly the question is self-evident. When everyone is bullish, who is left to buy? The same reasoning would apply when everyone is bearish. There is another fatal flaw to the notion of market sentiment driving price in my opinion and this is a harsh reality that few EW analysts seem prepared to contend with. I no longer accept the notion that “sentiment” in today’s market is the primary drive of market price. I have stated an nauseam the reasons why I now hold that position, despite many who would argue doggedly to the contrary. I can virtually guarantee that if you trade the market based on your own sentiment you are probably going to loose money. If I am correct, trying to determine what the market will or will not do based on any attempt to assess what sentiment prevails is in my view a fool’s errand. One instrument I have traded for a long time is volatility, and I will tell anyone willing to listen that under no circumstances would I be persuaded to be long the market with VIX trading at the current levels. A VIX descent to a 12 plus handle is a huge red flag whatever metric one uses to analyse the market. Does that mean the market cannot continue higher from here? Of course it does not. That would be an equally foolish presumption. It does clearly however, demonstrate one truism though, and that is human nature never changes!
BTW, before anyone decides to argue with me go do your homework.
Check the data on funds flow, if you know where to find it. OUTFLOWS have continued apace even as market price marches higher. Check the value of year-to-date corporate re-purchase of company shares, check the recent trend in global CB balance sheets…but you get my drift…stop believing all the propaganda and look at the facts!
Verne, been gone a couple days. I appreciate your comments on sentiment. I have been watching the crosscurrents intently.
Joe is right. Even a new ATH will come with confirmed negative divergences in quite a few indicators. To be fair OBV and the A/D line have both notched new highs but I think the other negative divergences are more significant.
Fasinating!
https://www.zerohedge.com/news/2019-04-13/war-has-broken-out-vix-complex
Verne, my bet is definitely on the institutions. Retail investors tend to be wrong most times (a day late and a dollar short). This confirms the bullish price action. I think if retail investors start dumping the long volatility positions and piling into the market those “signs” would be where we have a top in place.
Thank you for this confirmation! It further cements my viewpoint that this current rally has a lot more upside and maybe in September or October will be where it finally reaches its “peak”! I have some S&P ETFs and maybe will add some Nasdaq 100s tomorrow. There could be another 5 to 6% upside from current levels S&P and Nasdaq levels.
Verne, if you have time and care to comment, I would appreciate your interpretation to this article on retail ETPs and CFTC institutional. I watch CFTC Non-Commercial Net Long Positioning (which is short 141,500 contracts, z-score of -1.54). This doesn’t count commercial hedges of inventory positions, etc… think this is similar to their 3rd chart. Shorts are similar to Sept 2018 top and not far off the pre-inverse VIX ETP implosion. Does this look at institution vs retail fall into your sentiment comments? Do you think one position holds more sway than the other? Thanxxx Verne.
This website is for educational purposes relating to Elliott Wave, natural cycles, and the Quantum Revolution (Great Awakening). I welcome questions or comments about any of these subjects. Due to a heavy schedule, I may not have the time to answer questions that relate to my area of expertise.
I reserve the right to remove any comment that is deemed negative, is unhelpful, or off-topic. Such comments may be removed.
Want to comment? You need to be logged in to comment. You can register here.