
Today, I’m going to drill down a bit “into the weeds” the get an idea of what might happen in the short term. Tonight just 4 charts with a little bit of commentary. The market could actually go either way, but what I think is shaping up starts the the NYSE index, which I find is usually the most reliable pattern to watch. The other three indexes to follow, and I’ll include the IWM (Russell 2000).
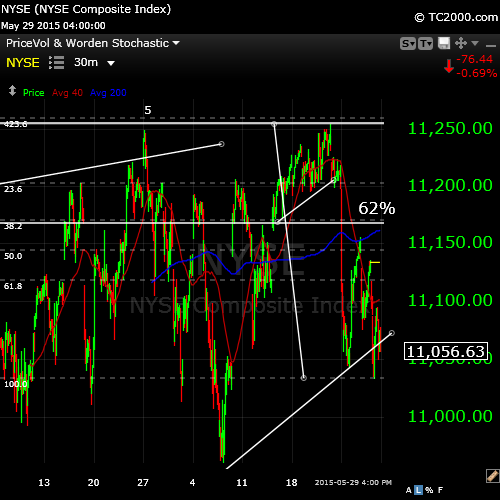
Above is the 30 minute chart for the NYSE. I’ve marked the top of the 5th wave and we’ve gone up and tested it to do a double top. This would suggest to me that this market has topped. We’ve done what looks like a first wave down and retraced, but we didn’t make it to 62% and I would expect us to meet that target for three reasons:
- It doesn’t often happen that these major indexes don’t retrace a second wave to 62% and
- Usually we’ll see a double-pronged second wave when leading into a much larger third wave down (which is what this will be if we head down after the 1st and 2nd wave combination.
- The wave down from my 62% marker is in three overlapping waves (which in Elliott wave, means it has to retrace
So, this chart suggests we retrace now to the 62% mark and then turn over and head down.

The 10 minute chart of the Nasdaq (above)_ looks somewhat similar. I’ve marked the previous top of the Nasdaq. From the most recent top we’ve made at 5,111 (approx), we’ve come down in three waves. That suggests a retrace to a double top. But I’m going to suggest that we don’t test the ultimate top. That’s because the other indexes are all at the tops of second waves and tendency is for them to remain in sync with each other. If the Nasdaq went to a new high, they’d all be out-of-sync and I’d then expect them all to head to a new high. I don’t think that’s going to happen due to the look of the NYSE. I’m leaning towards a double top here and a rollover.
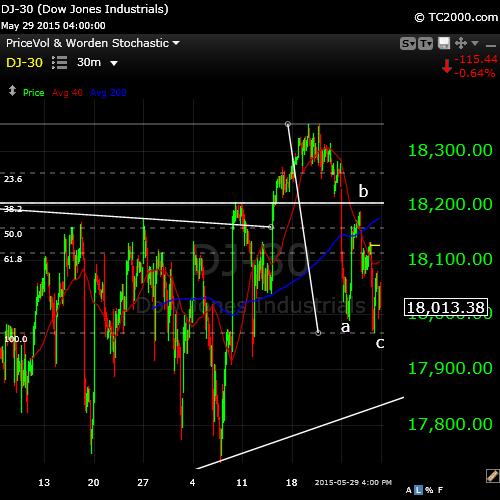
The 30 minute chart of the DOW looks similar. Three waves down. Also note that it did not quite reach a 62% retrace and so similar to the NYSE, I’d expect it to reach this target, at the least.
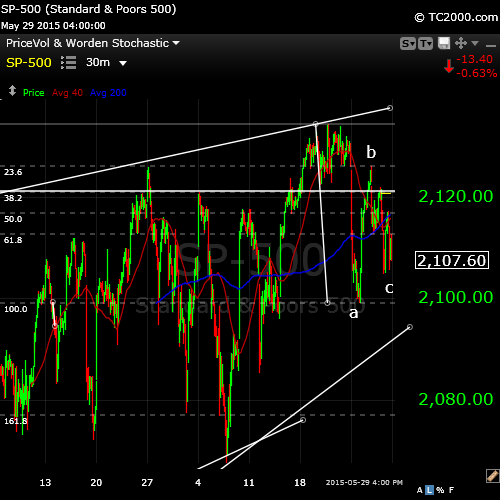
The SP500 above sports a similar look to the others. This index, in order to remain as a “2” should not retrace all the way to the top. If it does, that changes the count overall and it’s somewhat of a new ballgame. However, even if it hits the top, it should only be a double top and a quick turnover.
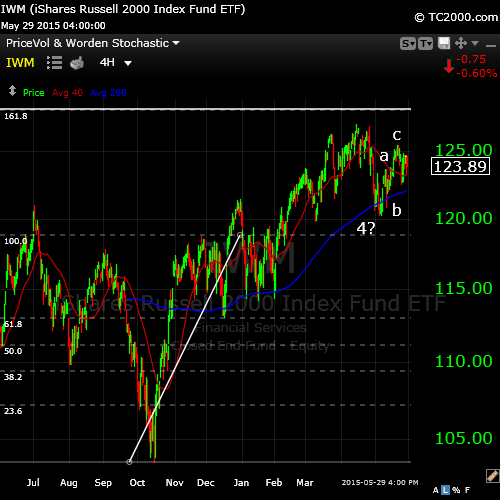
Finally, here’s the Russell 2000 – a 4 hour chart. It’s hanging in there in a second wave. It could to two things, a double top at the high of the second wave, or a rise to the slightly higher top. It’s done three waves up, which isn’t to say that it couldn’t complete a 5th, but the bigger picture is of an index that’s struggling and in sync with its older brothers and sisters.
Oh … and it’s a FULL MOON!
In summary, I’m expecting us to go up on Monday likely for the last time.
I see quite a number of shorts showing up in the general market. My favorites are: BAC, GE, AAL, URI, MCD, PEP TWX, and TRIP.
We’ll see what happens. I’m expecting a pivotal week.


Thank you Peter… Very clear, to the point. I am watching …Nick
Thank you Peter, very clear to the point. I am watching ….Nick