
We’re at market top. It’s about time to give this market last rites. It’s time for this market to get its affairs in order. This bull is terminal!
However, in this market (as in just about all markets), major tops are “a process.” As I’ve been saying for over two years now, the financial world as we know it is moving as one entity (as we work our way to international deleveraging). When a turn comes, everything will turn down more or less together. But, as with a large ocean liner, it takes time to turn around something this large.
On Thursday, the ending diagonal in the SPX failed. That’s the sign of an extremely weak market. The Investors Intelligence Advisors Survey of this past week reports that bulls jumped to 64.4%, which surpasses every extreme for the past 30 years. This strongly suggests that we’re at a major market top. The wave count confirms it.
We have a two step process left now. We’ll have a turn down this weekend to finish the fourth wave in the US market (and currency pairs will bottom—US Dollar, USDCAD, and USDJPY—which move in the opposite direction from EUR, AUD, and GBP—the latter three will top, of course). This week, everything should turn up into the final wave to a slight new high.
And then it’s down for a long time to come.
I’ve been unwavering in my conviction that a top is in progress because the Elliott Wave Principle is the best predictor I’ve found (through my extensive research) of the way the market moves (it applies to any market that is not government controlled).
Although this rally has been the most difficult market ever to predict, we’ve been exceptionally accurate across over ten assets (in the Trader’s Gold Subscription Service).
Wait until we top! The accuracy in the impulsive waves to follow will ramp up considerably, because it’s impulsive waves that are restricted by EW rules. Corrective waves (which we’ve been seeing since 2009) are much more difficult to predict because there are so few rules as to their movement—the key tool for corrective waves is fibonacci relationships, but their proper application comes primarily from experience.
This week, you got a taste for an impulsive wave, when we had the drop from the top of the ending diagonal. I was able to call the turns both down and up. However, the wave proved to be a corrective one (I’ve found that near tops and bottoms, waves start to become more impulsive-looking).
A Higher Tide Floats All Boats
 Whenever we get close to a major top in ES (emini futures), the comments start to flow predicting a top (or not). Usually these comments seem to come from those fixated one one index—the SP500. But, the market actually consists of more than one index, and the driver of the entire thing is the US dollar (the reserve currency).
I’ve written about this before. But, people have short memories, I guess, or see only what they want to see (now, there’s a well-known fact!).
I have always maintained that once one index tops, they all have to (so that they stay in sync). This is a market rule.
But it’s more than this that keeps the SP500 from not topping until the others top. The next wave down will have to start with five waves—across all US indices. So to get to the point where that can happen, the indices all need a “fresh start”—in other words, a new high.
The key, as I preach over and over again, is to watch the entire market, certainly indices that are related to each other. Both the SPX and DOW are subsets of the NYSE. They move more or less together. The wave structures have to be correct in order for the next wave down to start.
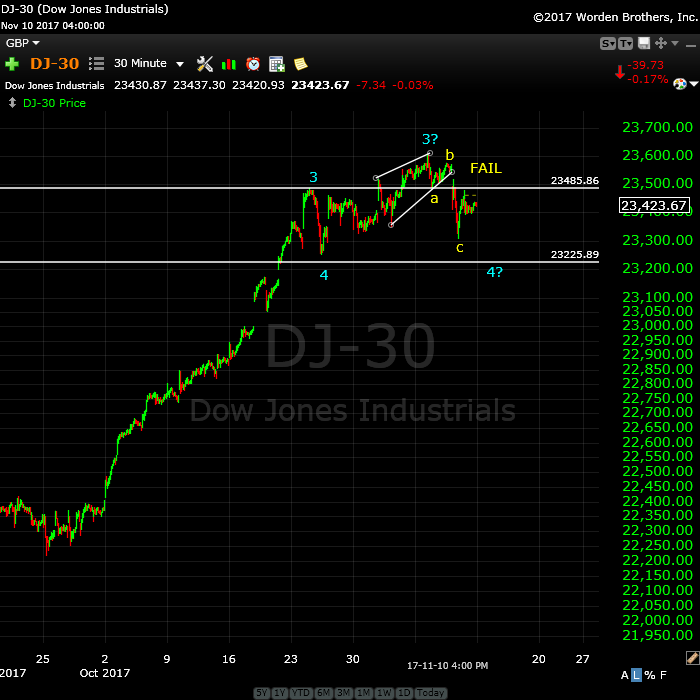
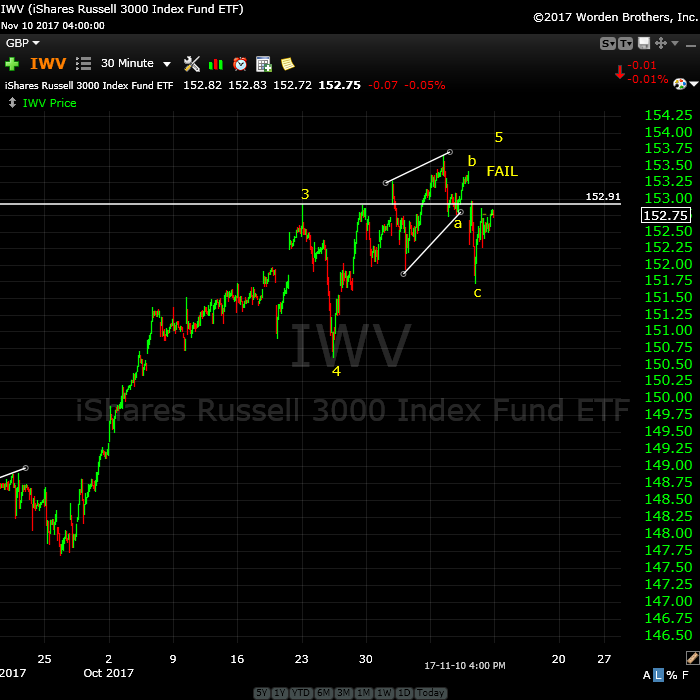
In all US indices (and USD currencies), we appear to have one more small wave up to go: a major turn of just about everything associated with the US dollar.
| Other US Major Indices (click charts below to expand) | |||
|---|---|---|---|
 |
 |
 |
 |
| NYSE | DOW | Russell 2000 | Russell 3000 |
All the Same Market
I’ve been mentioning for months now that the entire market is moving as one entity, the “all the same market” scenario, a phrase that Robert Prechter coined many years ago, when he projected the upcoming crash (although he and his group don’t seem to be paying much attention to it now …).
We’re starting to deleverage the enormous debt around the world. Central banks are losing the control they had and we’re slowly sinking into deflation world-wide, with Europe in the lead.
The US dollar is fully in charge of both the equities and currencies markets. They’re all moving in tandem, as I’ve been saying since September of 2015. You can look across many international markets and see the same phenomenon—most major exchanges are at or near tops.
_______________________________
Get an upper hand … JC 2
Get an upper hand in trading …Seeing all the different currency pairs and the wave structures and hearing you explain why this has to do that on a nightly bases gives one a upper hand when trading. Elliott Wave applies to all stock and indices and can be applied to any candlestick chart. If someone ask what you want for Christmas – Tell them a membership to Peter’s “Traders Gold!”—JC |
Have not had a losing week RW 2
Have not had a losing week …I have been with Peter almost a year. The only thing that matters is have I made money with his service. I think I have finally turned the corner using Peter’s EW. I have not had a losing week in the last 5 months. Thanks Peter, for your amazing amount of hard work. —RW |
Couldn’t be happier … KK 2
Couldn’t be happier …The analysis and insight you provide is simply amazing! I’ve been trading the futures and equity markets for well over thirty years and usually average around 5% monthly. Since joining your Traders Gold Service two months ago, that number has better than doubled. I couldn’t be happier.—KK |
A true expert in Elliott Wave FL 2
A true expert in Elliott Wave …You are a true expert in EW analysis. What you provide is not available anywhere and is priceless. Subscription on your services is the best thing I have ever done. Many thanks for your effort to make me a better investor. I now have more trust in my investment decisions. I hope you will continue the excellent work! —FL |
Rise above the rest … SM 2
Rise above the rest …I have only ever met a few people who, in their chosen fields (astrology, medicine, music, martial arts, technical analysis), rise above all the rest and you are one of them…you have ‘the gift’…and that’s why I’m a Trader’s Gold member. —SM |
the real deal SM 2
The real deal …‘Educational, insightful and thorough market analysis for all levels of traders. It’s Elliott Wave at its best….Peter Temple is the real deal’ —SM |
Tops in your field DZ 2
Tops in your field …You are tops in your field. Tried to follow Elliot Wave international for years. They were always behind the market. After discovering you, I perceive that you are an expert in reading the waves, which puts you way ahead of the rest of your peers. And you can read the Waves like you are reading tomorrow’s financial section. I pray you stay healthy. —DZ |
The best of them JL 2
The best of them …Last couple of years, I subscribed to several ‘market traders’. You are by far the best of them and the personal contact is awesome. Daily and daily updates are very well written! Besides your expertise in EW, I also like your cycles analysis. Best investment I ever made! —JL |
The Market This Week
Here's the latest daily chart of ES (emini futures)
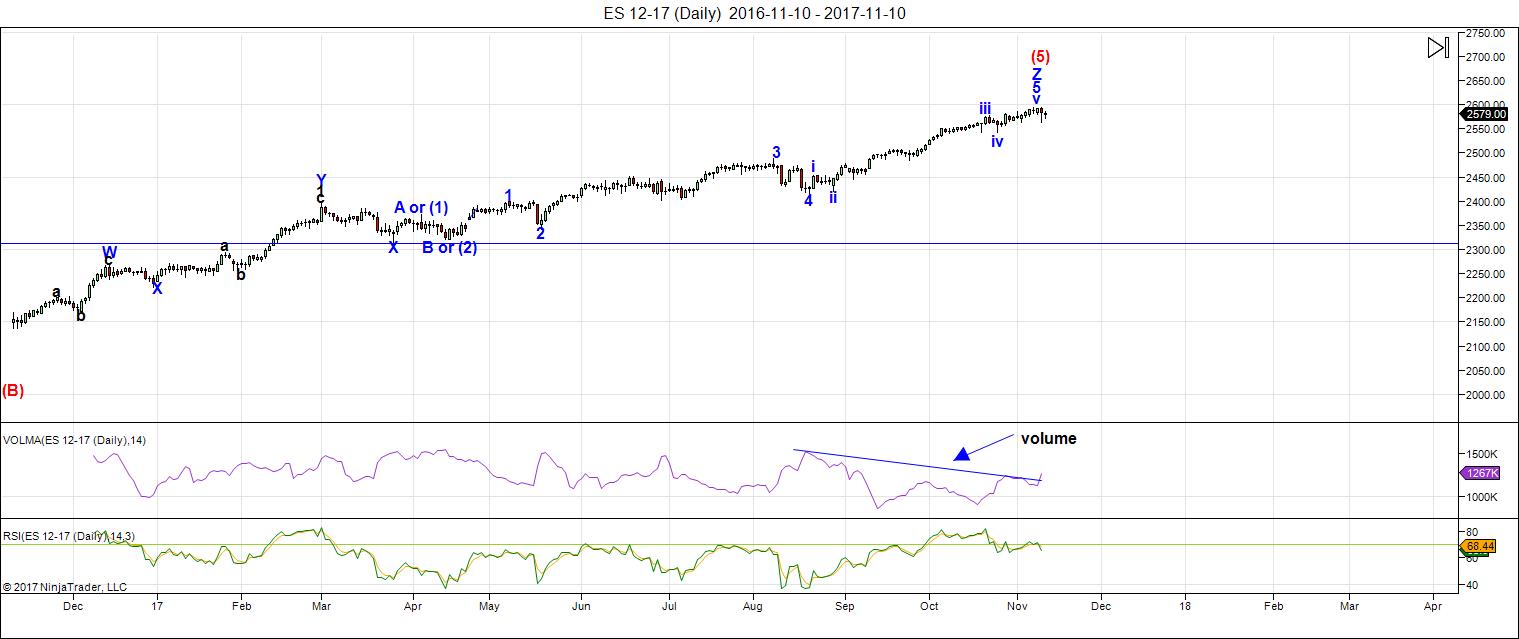
Above is the daily chart of ES (click to enlarge, as with any of my charts).
There isn't really a lot to be gleaned from this chart other than
- the fact that we're at the top ready for a turn down,
- that this wave up continues to be a corrective one (which implies this is the final high and that it will descend with force once it turns to the downside), and
- we've been moving mostly sideways for weeks now.
The more important charts are the hourly chart of ES and NQ (futures) and the major US cash indices—they will all need to clean top in order to start down in the long-awaited bear market.
Volume: Note that for some time now, volume has been expanding with selling, and drops considerably when the market heads back up. This is yet another signal of the larger, impending top. The turn up for the final leg is now showing signs of turning back down.
Summary: The count is full for NQ and ES, except for small subwaves that form the balance of a small fourth wave and the final wave to the top. Down and then up ... and we're done.
_______________________
Here's the latest 60 MIN chart of ES (emini futures):
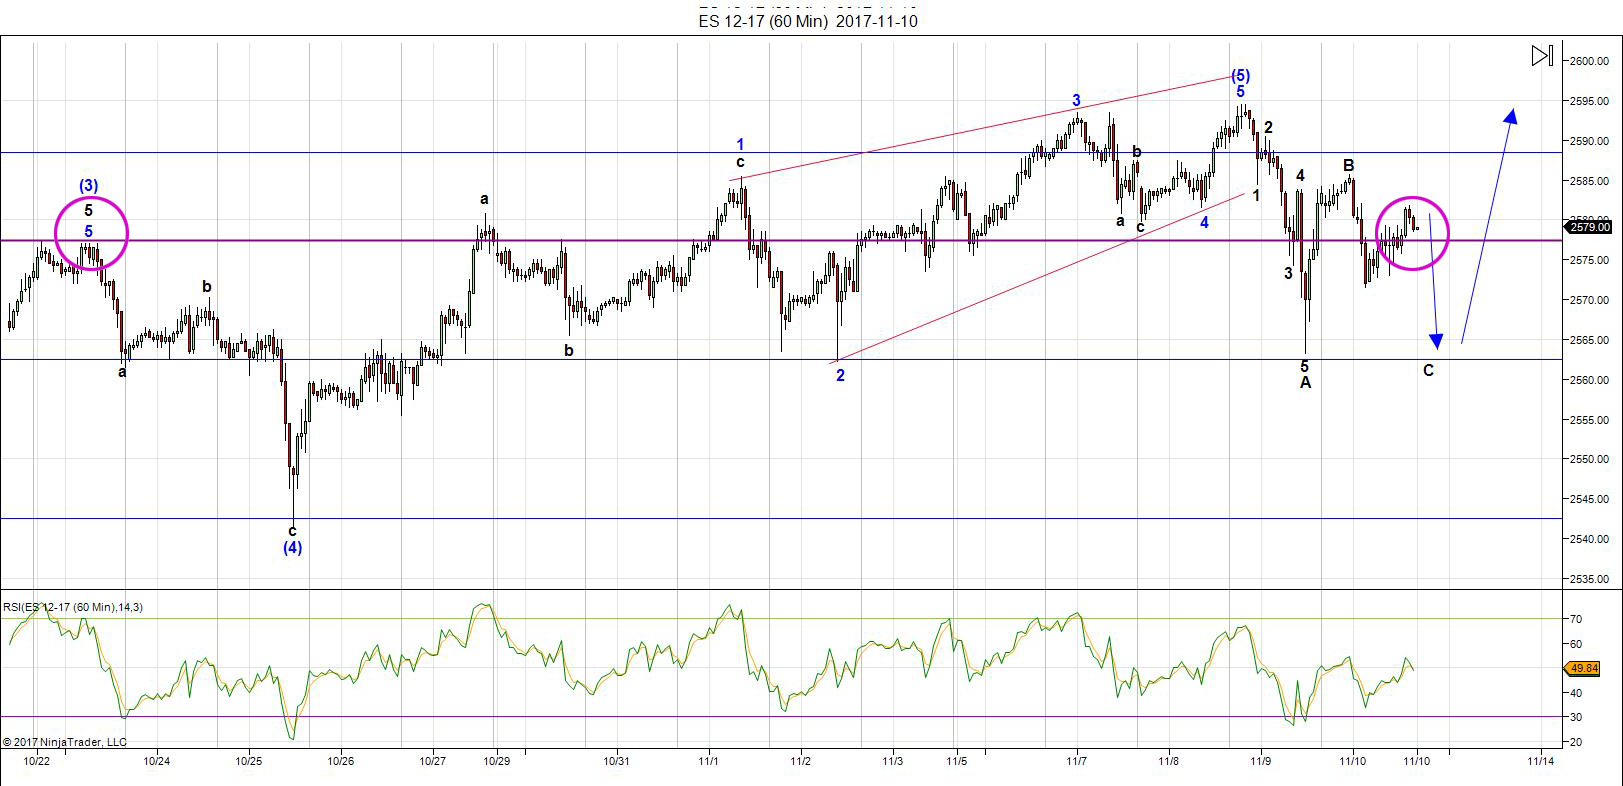
This chart is a example of the hourly chart and guidance that's a regular nightly feature of the Trader's Gold Service. (I'm providing this one-time preview of my service - I cover other assets (oil, gold, and currency pairs with similar charts and a nightly video). The weekend charts are also accompanied by a video, which provides more detail.
Above is the 60 minute chart of ES (click to enlarge).
Three weeks ago, I posted a "free" blog post entitled, "The Top is at Hand." I didn't say we'd topped or that it was imminent in the next couple of days (I tend to choose my words rather carefully, because your trading depends up it). I had also stated that topping is a "process." Note in the chart above (by the purple line and circles) that we're in exactly the same place we were three weeks ago. Monday we'll be below it, but we're not quite done with this bull market.
Thursday of this week, we had a wave down in ES in 5 waves (not impulsive). SPX was in an ending diagonal (as was ES) which actually failed—it did not complete the final wave up. This left an unfinished set of waves, for a failed top. None of the other US indices matched the structure of ES.
We are heading down on Sunday to complete a smaller fourth or second wave (not sure which yet), which should bottom at 2563. This will create a very obvious wave down in three waves in ES. Look for all the currency pairs to bottom with this move. We should see gold head up to the top of it's B wave. In short, the entire market is going to move in tandem.
This will set us up for a final wave to a new high ... right across the market spectrum. A final parade!
Short term: We should head down on Sunday to a double bottom at 2563, which sets us up for a final wave to the top.
___________________________
Trader's Gold Subscribers get a comprehensive view of the market, including hourly (and even smaller timeframes, when appropriate) on a daily basis. They also receive updates through the comments area. I provide only the daily timeframe for the free blog, as a "snapshot" of where the market currently trades and the next move on a weekly basis.
______________________________________
Sign up for: The Chart Show
Wednesday, November 15 at 1:00 pm EST (US market time)

The Chart Show is a one hour webinar in which Peter Temple provides the Elliott Wave analysis in real time for the US market, gold, silver, oil, major USD currency pairs, and more. You won't find a more accurate or comprehensive market prediction anywhere for this price.
Get caught up on the market from an Elliott Wave perspective. You’ll also get Andy Pancholi cycle turn dates for the SP500 for the balance of the current month. There’ll be a Q&A session during and at the end of the webinar and the possibility (depending on time) of taking requests.
All registrants will receive the video playback of the webinar, so even if you miss it, you’ll be sent the full video replay within about an hour of its conclusion. For more information and to sign up, click here.


Thank you for the update. Looking forward to the correction.
You’re welcome, of course.
oh ma gawd dave,
i can HEAR your eyes rolling in their “sockets” from here!!!! can i be so honest as to say, that is the most “forced” ….”looking forward to the correction”….. i have EVER read!!!!
i KNOW you dave…………………………. i can feel the ……..”you see – i told you so”………… caught at the back of your throat……………………………!!!!
well dave…….huh…………………. hmmmm…………….. i am waiting!!!
LOL,,,,, I am looking for a correction, NOT a full blown market crash. Plenty of cash to put back in the market. 18 – 22 % into sugar,soy,wheat, corn ect
Peter,
Think you are right. 11/13 is an extreme in momentum. 7 days later we have 11/20. That would be 30 months from the 2015 high. 11/19 the new moon. 11/18-19 is an inversion window. One more week?
I would not be at all surprised to see an amazing final thrust higher in the ultimate blow-off move. If I had the time, I would pen a thesis on Central Banks and the mood of crowds. Dave is right about what has happened to bearish traders the last few years- most of them were anhialated by the bankstets who were so embarrassed by the last crisis, they embarked upon a mission to deliberately punish any trader daring to short any hint of market weakness. The strategy has been remarkably effective. How do I know this? Well, one result was that quite a few hedge funds closed their doors in disgust and frustration as the regular ebb and flow of the market disappeared with extended market runs higher as each and every single market attempt to normally correct was aggressively arrested and bid higher. It became clear to me two years ago that to survive this market you had no choice but to become a scalper. Clearly BTFD was the right strategy considering what the bankstets were doing, but I could never convince myself that being comfortably long the market was wise, in view of WHY the market kept heading higher. Of course the ultimate proof of the run-away success of the bankster intimidation of bearish traders is not only that they have all disappeared, herd mentality has now also reached the other extreme. We are now witnessing the most grotesquely skewed short volatility trade we have ever witnessed in all of market history, and no wonder. Over 12 months without so much as a 5%, much less a normal correction is also unprecedented. Just about 8 months ago, I concluded, based on all the above that what comes next is not a correction, but a COLLAPSE. But not yet. Bankster hubris demands that they go out with a bang. While I frankly do not expect it, a new 52 week low in VIX, pushing that already crowded trade to an even greater extreme would be the signal of the century, probably pointing to some poor schmuck employing new levels of leverage to join what the entire world is convinced is a one-way bet. Remarkable!
https://worldcyclesinstitute.com/tick-tock/comment-page-2/#comment-23831
andré November 11, 2017, 10:09 pm
Jody,
I think this weekend marks a significant change in trend. And I think we are down into july 2018. So the 8/21 low will be taken out.
André
____________________________________________________________________________________
looking for clarification…five hours after posting the above, you posed the question: “One more week?”…do you expect the current time frame (November 13, 2017) to mark ‘the’ change-in-trend or one week from now (November 20, 2017)?
Jody,
There is a difference between the real cycles and what the market does, Garret says : price is a liar. My 11/13 is a peak in momentum. this is seen in a w3. w4 and w5 are allways against the real trend. So 11/13 signals a fundamental change in trend and 11/20 the market will follw.
So even if the market is up into 11/20, don’t be fooled; the real trend is down.
Hope this helps.
Thank you Peter ….Nick Timpa
Peter,
Thank you for taking the time to explain EW and relating to todays market. It is fascinating to watch it all unfold. Question though, in your initial commentary you are specific to say “(it applies to any market that is not government controlled)”. Does that mean you think this market might be government controlled and if that’s the case, how does EW apply to a market that is government controlled?
Jeff T,
That was more in reference to situations where a government “pegs” an asset or market at a certain price (eg – gold from the ’30s to early ’70s).
Curious, what happens to the bond market when we start the downturn. I’ve defensively allocated my 401K to heavyweight cash, high grade corporate debt (if there is such a thing) and short term treasuries (perhaps another illusion of safety). My equity allocations are lower than average. My plan is to go bargin hunting over the next 3 to 5 years, but concerned that these “safe asset” classes will also get “scrubbed”, and I won’t have any “dry powder” to buy at the bottom. Appreciate thoughts and feedback.
I think there is a lot of hidden danger in the bond market, and not just the usual risk of rising rates. A decline in market price and the price of oil, both of which is likely, is going to be hard on bonds issued to support equities and fund oil exploration. Bond defaults are going to put tremendous upward pressure on rates. The market has been remarkably calm considering what has happened in Puerto Rico and about to happen in Venezuela, but based on the recent price action in JNK and HYG, that could be about to change. The biggest danger is in money market funds. The corrupt politicians have relaxed the rules about what they may own,and I think some of them are holding very risky assets which could end up causing them to “break-the-buck”. If the is happens, it could cause a panic in the industry, hurting even the ones that are not particularly at risk. Short term treasuries is probably the second safest place today. The safest place is CASH.
The real problem in stress situations is definition of “cash”. Are 1-month tbills cash ? Is a checking account cash ?
A checking account is most definitely not!!!
Jody,
There is a difference between the real cycles and what the market does, Garret says : price is a liar. My 11/13 is a peak in momentum. this is seen in a w3. w4 and w5 are allways against the real trend. So 11/13 signals a fundamental change in trend and 11/20 the market will follw.
So even if the market is up into 11/20, don’t be fooled; the real trend is down.
Hope this helps.
Thanks Andrè, But I think rotrot asked the last question..
Thanks for the pointers. The market reminds of the line from the movie “Taxi Driver”-“Someday a real rain (correction) will come and wash all this scum (cooked values) off the streets.” The correction is going to be painful, but it is necessary so we can get back to true price discovery and a semblance of normalcy, that’s till the bankster cook up some other Ponzi scheme. Maybe it will be different this time. ?
ooooooh peeeet’ah’……………………. peeeeeeeeeeeeeet’ah’ [notice the typed british accent peter?? huh…..good yeah?]
are you sitting pete’ah??? because as the boss, you know what i am going to do next – don’t you!!! you KNOW i have to say it…………. i HAVE to say.!!!………………here it comes……………. its coming……….. [this is sorta like giving “birth”]
“T-R-U-N-C-A-T-I-O-N”???? [in with a “BANG” – out with a “whimper” – that is, the energizer bunny is now a full fledged “welsh rabbit souffle”…………………… should we expect that this last wave “truncates”??
there i said it!!! is the market soooooooo exhausted, as we have already witnessed one truncation, that we witness a 2nd one???
what say you boss man???
:-))
boss……the above question is “PURELY” high octane speculation………… !! anyone who tries to use it as a “Record” of a “prediction”…….will get the hard end of my boot!!
I have this copied and pasted for later. Thanks Luri LOL
its ok dave…………… at least “GOD” still loves you………………… LOL
Are they spiked??! 🙂 🙂 🙂
Thank you Peter!
Last year, Potus called the stock market as a big, fat, ugly bubble. He did a quick turnaround and now embraces its constant climb and takes credit for it. So I think unless something happens to potus, dow, spx will just keep climbing. FWIW, I’d rather keep putting money in the indices rather than bitcoin which is constantly being pushed to regular investors by CNBC.
I appreciate if going forward the 2 Daves can put a last initial since I’m confused whether the Dave posting is the one that talked about the yin fire. Please…
liz…..we have 2 daves?? really??? YIKES……… 2 of them?? omg…… i think i might have made a boo boo to the above dave!!! 2 of them………..when the heck did THAT happen?
I read a post saying “not the Dave from Vancouver.” So I am confused.
fair enough liz……. it is confusing…………….. ok – dave from Vancouver…..nod your head ONCE………………and dave NOT from vancouver…you nod your head TWICE!!! that should make it easier on the rest of us!!!
Luri, I just nodded three times. Is that clear now ?
Hi LizH, that was my comment. I can certainly see how one could be confused. I am Dave from Vancouver, regular contributor to the blog. My comments are usually bullish . Yes, I am the Dave who posted the ying yang analogy.
Liz, I will use the name Dave M for future postings, once Peter puts me into the system. Sorry for the confusion.
All the Dave comments on the new posting are from Dave in Vancouver.
So……how the HEck did that happen??
i was looking back at the lows of 2009; 3/6/09….. the ES intraday low was 666.79. The SPX intraday low was 666.79…………………………..
now how the heck did that happen?? the day before the intraday lows/ and highs were different [as they usually are]………………….the day after the intraday lows and highs were different……………………..but the SINGLE day of the low – BANG – they are IDENTICAL!!! now what should a questioning mind make of that????
verne…..jody…………..huh……….liz?? anyone.
Luri,
Square root of 666.79 = 25.82 multiply by 100 = 2582
Friday close px of spx 2582, /ES open px 2582. What does it mean?
Original Dave, thank you! For all other Dave posting here, please include a last initial or other unique identifier.
Doesnt it also work that (25.82 + 25) squared = 2582 and change. (The 25 is just adding whole numbers for those who dont know this concept.) But more to your point, I wonder how often parity between the cash and futures prices corresponds with trend changes.
Curioser and curioser…! 😉
Any thoughts on the perverse Deep State’s assault on Duterte and the Philippines with their proxy killers ISIS, over the breaking of their drug money piggy bank? 🙂
The sleepiness of the American public, glued like idiots to their I-Phones is stunning!
…………….go on reconnaissance VERNE……………go into zombieville and report to us “firsthand”……what you find………. i hear it is the fastest growing community in the WORLD!!!
Sometimes just for fun, I go on a three day strike when I refuse to answer my android (except the call is from family members who all have signature ring tones, of course!) Am I the only one without a F-book account? Remember it was Zuckerburg who referred to his clients as dumb “F” -ers….
Very rarely do I use my fb account. It is of course a fake name.
verne,
for the public record, i hath: NO facebook, NO cell phone, NO twitter, NO google anything, NO snap chat, NO instagram, NO cable tv, …… although, i do have an old fashioned land line, and i use kodi, i still read “books” – the old fashioned ones with pages to turn…………..and i still wear “naughty jockeys” [jockeys with writing on them]…..my favorite is “in case of emergency – pull down”!…………………………………….
A real live person! A rapidly diminishing species… 🙂
At Friday’s close, SP500 was down 0.46% from an all-time high. That was enough to drive the VIX up to a 2-month high, and CBOE Put/Call Ratio to highest daily reading since March 2017. Fear lives, which is good news for the uptrend.
From Tom Mclellan
I am expecting a correction myself, but not for a little while yet.
I respect the man but when it comes to volatility he doesn’t know what he is talking about. Considering where the market is trading, that move up in VIX does not even come close to anything resembling a short term capitulation. We did not have the tell-tale strong move above the upper B band which generally signals an interim bottom, especially when accompanied by a long upper wick. Even more telling is the fact that Bollinger bands are expanding to contain price movement and that is often signal of a move higher over at least several days.
I am NOT saying the market cannot go higher. A move higher simply makes the volatility situation more extreme than it presently is, and the inevitable correction even more violent. It will particularly ominous if VIX continues to move higher along with market price.
Verne, the vix can not stay up for much longer. I promised you that you can buy it back under 10 again. LOL I am a man of my word. lol
Why thank you Dave. This last Friday was the first in the last seven that they did not drive it back below 10.00. I was a bit disappointed as I traded every one of those sub-ten moves for a tidy profit. I will hold you to your word my man! 🙂
Peter
excellent post , I think you covered the basics very well
I would however point to the Transports which I think many have
overlooked.
Luri
I’m not offended by your posts your the least bit and you are correct humor is a good thing. that said , lol I read your post on a day where I was mis quoted several times by a friend of mine and she drove me crazy. Its all good .
Verne
I put together several charts to show the buy side bias in downtrends and to post it all would be way to many examples. I have decided to wait until the present
day patterns line up before posting the comparisons and when I do i’ll keep the examples to maybe just 3. 2 being historical and 1 being present day .
Ill finish by saying that my main issue with “banksters” the “fed” or the “PPT”
is that I have heard those excuses by many over the decades as to why the market rises and as I have researched the market more in depth over the years
I have found that those arguments just do not hold water .
You asked last week something to the effect . when did QE not work ???
I’m being general . ill ask this . When did QE begin ?
remember the 3 amigo’s ? it was 1997 or 1998 with Robert Rubin Allen Greenspan
and I forget the 3rd . they saved the world lol . 3 years later the market was lower, 5 years later the market was lower , 11 years later the market was lower .
that effect they had was short term and the trend proved to be down.
we can also look at late 2008 with the real-estate market and the first time home buyer program , it began as a loan for a down payment that you had to pay back then it became a gift that you did not have to pay back . that program ended in 2010 I believe and yet home prices bottomed in 2011 . that program may have helped stabilize the market ( if you choose to believe it ) yet it did not stop the trend which was down.
For me to go down that road of blaming bankers or the fed or the PPT rather than looking at the market and the technical indicators along with the Elliot wave count . I might as well just buy blindly and have full faith in what these people do.
I cannot do that because I cannot see any solid correlation that proves these people ( fed, bankers ppt etc…) have ever been able to stop a decline in the markets. I have never had a F book account .
wrap up
As for higher interest rates , many people , the average people use credit cards with 15-26 % rates and the fed pays 2 – 3 % ??? some point to real-estate and say
higher rates will kill the real-estate market ? 4 % interest rates are on par with mortgage rates in 1960 which was almost 60 years ago.
to clarify what I wrote the other day , I said the INITIAL rise in rates tends to be bullish as people jump in trying to buy sooner rather than later because they do not want to buy with a higher cost later . Eventually the rates rise to a point where people stop borrowing . On average what I look for is when the 30 year bond makes a new 4 year high in rates . that wont take much given this present interest rate environment.
Oh and distribution and hedge funds :
the hedge fund managers are just people like the rest of us , maybe they get it right once in a while yet if they all do the same things they all will end up with the same results . so the hedge funds closing down are because the managers failed to understand the market plain and simple . to add to that paying someone a % based on assets under management implies a paycheck for the manager despite performance .
distribution : Just because someone is selling stocks as the market rises does not mean they are bearish. I have also been unwinding stocks over this past year and based on that I guess I have been distributing shares as well ( I’m a very small trader ) . Money management demands you sell at some point in order to manage risk . People look at insider sales as well , I guess you should have sold Microsoft as bill gates slowly sold off his shares from a 50 % ownership to what is now I think 5 % .
At the end of the day everyone is attempting to find some way to use data to make a decision yet many of these attempts fail badly .
It would be very simple to just say we are all going to suddenly become younger
because we have been aging for so long.
People see what they want to see that is plain and simple . most do not give credit where it is do yet blame others for their own mistakes .
Sit a 3 year old on your lap in front of your stock charts and ask them what they think the stock market is going to do next. do you think they will say the fed
is driving stocks higher ? lol .
you must quantify the market and throw out the news, the gossip, the fed etc….
Trump being elected will crash the stock market ? How long did that last ?
JFK got killed and that was a blip. Oh no the fed raised interest rates is no different .
What moves the market is confidence or lack of .
People buy stocks because they are going up
people sell stocks because they are going down .
a 3 year old can see it because they do not look at anything else other than the chart .
anyways , to much to do today to wrap up a few things .
next year should be a down market, the topping process has begun as I see it .
the degree of the decline is up for debate .
its a one step at a time based on data analysis that I look at in regards to the market.
presently I have a mixed view . dow 10,400 is a possibility but it is only 1 possibility of many . 18000-19000 is where my focus sits and 21,400 looks to be realistic .
I agree with Andre with his may low even though I have April for the low .
April may 2018 is when I start considering the bearish targets .
Presently its Thursdays low that is key and I cannot rule out a new all time high
in the index’s at this juncture even though I do feel the top may be in.
it is going to become more difficult for buy and hold type buyers .
non related patterns , I see either a head and shoulders top or a triangle forming .
the head and shoulders top has the left shoulder and peak in place and it would be the right shoulder forming now .
the triangle is somewhere near wave C with waves D and E to complete it .
the issue with triangles near market tops is they tend to fail . a failed triangle
I will view as extremely bearish .
The end result is we have more sideways action and less volatility coming as I see it . less volatility does not guarantee a new low in the vix yet it does allow for it .
that’s it for me for a while .
back to work Tuesday and I’m letting the ” Toping Process” run its course.
Dec 1 dec 13th 14-th and jan 2 matter to me as turn dates .
the risk is this and I hope this turns out wrong .
the august 21 date was to be a high and it turned out to be a low .
the dec 1 and dec 13-14th and jan 2 dates should be part of the topping process
and not form an oversold reading to begin to look like a bottoming type affair.
if it becomes the latter then the bear market next year will be mostly sideways and range bound and the April may low would probably become the low .
its very premature to claim how this bearish move will trace out because we have not yet gotten through these peak cycles.
Just an overview of my own personal thoughts at this juncture .
Don’t bet the farm is all I’m saying regardless of your personal view on direction.
Good luck trading 🙂
As always Joe, I appreciate your insights on the markets.
Futures looking good. We should see a another nested second wave complete during the session tomorrow with a beautiful entry for the trade down to complete a C wave I think, over the next few days. I will be looking for VIX to bounce again at the 10.50 pivot. I am going out on a limb and predicting the world’s biggest bearish engulfing candle at the end of the next wave up. Yum! 🙂
verne,
i am doing it!! i am sticking to my ending diagonal ES chart until such time as it has to be tossed……………so far so good…………
https://invst.ly/5tmep
ooopsie…..i forgot to add – BE WARNED!
I have been VARNED, fraulein…!
A very good video on the cooling trend. This is why I will be investing in the wheat, corn soy ect for the next many years. You can never go to wrong, by diversifying ones portfolio. As mentioned earlier, our ski hills have opened up this weekend. The earliest time in 40 years.
https://www.youtube.com/watch?time_continue=1765&v=6v66SPTYqF0
PD-1 (SPX accelerations…terminations…changes-in-trend…think POWER)
PD-2 (SPX highs and lows…the following trading day likely closes with a change in polarity)
PD-3 (SPX minor highs and lows…the following trading day likely closes with a change in polarity)
11/14/2017 PD-3…there is only one other remaining pivot date during November and it is also a PD-3…it is highly unusual for an entire month to be devoid of any PD-1 or PD-2 pivot dates…
“…it is highly unusual for an entire month to be devoid of any PD-1 or PD-2 pivot dates…”
the PD-3 pivot dates (SPX minor highs and lows) are obviously meaningless in this environment…
One way you establish the validity of any hypothesis is to demonstrate that it has predictive value. I have suggested that the hubris of the banksters is now such that they have embarked on a mission to keep the market perpetually aloft. I also suggested that I would expect the initial signs of their failing to accomplish this task would come in the futures market. Why? Simple. There are no sellers left! A steady decline in the markets mean they are falling under their own bloated torpidity, and we have reached the the point where artificial liquidity is akin to pushing on a string as it were. While I am not at this point arguing that a top is in, I am prepared to argue that when it is, the decline, rather than being summarily arrested by the swift intervention we have been seeing all these past months, will instead will accelerate to the downside, and NOTHING will stop it. This is why for months I have not been expecting any kind of “correction”, but instead an outright market COLLAPSE! Think about it, that is a process that will quickly develop without the herd having a clue, but eventually they will all rush to the sell side. Oh there will be early sellers allright, but it initially WILL NOT be the herd, By the time they figure out what is going on, we will be well on on our way. What say ye??!! 🙂
verne,
you are describing my inverted “v” top thesis……………. hey, do you think we are seeing a “classic” head/shoulder top?
https://invst.ly/5tozr
The thought did indeed occur to me, but with all the foaming bullish giddiness, wondered if it was a “pigment” of my imagination ;D
Banksters are busy…are we surprised?! 🙂
Based on today’s price action, I have to conclude we DO NOT yet have a top…Banksters still in charge…for now…back tomorrow
for another look-see…
the oex has been higher then its opening price 7 days in a row
the spx has been higher than its opening price 7 of the last 8 trading days
The daily NYSE has not been able to drop even 2 = point ranges.
Nasdaq 100 has been higher then its opening price 7 days in a row.
2540 important support on the ES . not sure we get that far down and this point
yet ill give it this week to see what happens.
So has VIX…! The last six days anyway…that is significant in my opinion… 🙂
a recent study has concluded that it has been the bankers
who have been trying to make the earth cooler .
if it snows this winter its probably just a manipulation.
haha.
Short term control over price yes, any time control over nature, quite doubtful…very very funny! 🙂
LOLOLOLOL Good one Joe !!
BTW Joe, although that comment WAS indeed quite funny, what you did is what some folk refer a logical fallacy, specifically “false equivalence!’
But hey, it WAS very funny, that I admit! 🙂
As it did last Wednesday, market printing a bullish engulfing candle today in the face of other bearish signals; very schizoid behaviour….as you recall, we had quite a gap down opening last Thursday. Very strange indeed….!
Nice call Andre! I was wondering at this morning”s lows… 🙂
OPEX Week, I would be cautious for shorting this week. Unless you are looking for a possibility of swing trades. Very modest down swings.
Traditional swing trades are not possible in a market that does not pull back even as little as 3% for months on end. What you are talking about is scalping, and they are very different…:)
Very modest down swings.
Bezos unloaded a ton of AMZN stock today. I increased my considerably short position by way of 2018 leaps. Seemed fitting at a new ATH…
hey peter,, thanks the update. For your USD comment, “In all US indices (and USD currencies), we appear to have one more small wave up to go: a major turn of just about everything associated with the US dollar”, are you referring to one more small wave of USD weakness? thanks, Chris
Chris,
Yes … to a double bottom or slight new low.
Thanks.. so a drop in the DXY toward 91.0 or a bit lower. Will be interesting.
Watch out for ROAD KILL this week, very dangerous driving out their. Many bears are going to be scattered along the road side.LOL ES going is going up to the 2600
level. Verne get ready for your vix play.
VIX recaptured its 200 Day SMA prior to the close bud.
What do you mean “Get Ready???!!” He! He! 😀
Just a bear Trap.
O.K. I guess I will just have to ditch that truckload of 10.00 strike calls I am sitting on huh? 🙂
Both ES and SPX have now close below the bottom trend line of the a large rising wedge and have now come back up to check the underside of that line.
Weekly RSI is signaling the next move and VIX is being accumulated. So your long why?
When the bulls get slammed on their heads remember.. YOU WERE WARNED!!! hahaha!
He is pulling our leg jody…I enjoy a good laugh as well as the next bloke! 🙂
We shall see, if I am full of B.S
Dave,
Please enlighten us. What is your reason for this Bullish call. What in the charts is causing you to feel this way?
I only bluff in the game of cards. LOL
Tell me about bullish trades you have made, then I might believe you are NOT full of B.S…! lol! 🙂
Do not believe a word I say. Time will tell.
Two trades last week, check out the prior post from last week.
I will let you know how the VIX calls turn out tomorrow!
Took nice profits on the pop this morning and reloaded…. 🙂
The last time some one called my bluff due to my rewarding trades, was approx 2 years ago. I immediately sent approx 3 weeks of my trades directly to PETER to verify. Most long term traders know I have been a strong bull. On my small trading account I do lots of swing trades. ( long and short) my ĺarge account is strictly long. No Shorting. Usually it is the BEAR traders who call me out. I do not know what else to say Verne. I have stated many trades with the es levels.
https://worldcyclesinstitute.com/tick-tock/comment-page-2/#comment-23745
NYAD was -353 today…this is the fourth week of negative divergence…as previously suggested, today was an interesting day for the stock market…
https://worldcyclesinstitute.com/elliott-waves-and-probability/comment-page-1/#comment-17325
Peter G…you are correct…NYAD does indeed matter, in spite of what some chose to believe!
NYAD was -556 today…SVXY has signaled a change-in-trend…’minimum downside targets’ for the current move: the area of 2539.89 for SPX and the area of 97.99 for SVXY…
NYAD was -853 today…SVXY hit 97.51…SPX has more downside ahead…
The market has damn near gone up 50% in the last 2 years. Since I can’t do it, I look for someone who can call the mkt. Looking for a top. Is that actually an unconscious bullish call by a bear? The main guru I am following has been bullish since 2009 and is not a perma bull. Have you guys seen Hampson of Solar cycles is calling for 200,000 plus by 2035. Gann calls for a correction in the 7th year. This market is so strong the correction has melted up for the last 5-6 weeks. Frequently there will be a short and sharp but scary sell off to give the bears some hope. Right now, they are all hiding in caves.
Hampson of Solar cycles. If I remember correctly, he was always bearish. The whole blog was full of bears except for the odd person. Their were some very nasty people on that site. I thought that site was shut down, due to Johns health concerns.
Hi Kent – where have you seen John Hampson write this? I haven’t seen an update to his site for years.
Hi Dave M – John Hampson was bullish for a long time, his bearish call in 2014 proved to be spectacularly wrong and unfortunately he was wedded to it (unusually based on his previous calls where he was more flexible). He was the best market technician that I have come across.
The blog became a magnet for bears and any bulls were told where to go. Guess who was right.
I remain bullish but I am only looking for Dow 100,000 by 2035 🙂
ATB,
Kerry
Great to see you Kerry, come around more often. Their are not many bulls here beside Joe Valley and I and some other lurking Bulls.
They ran me right out of Town.
The most reliable guru is market price, and right now Mr. Market sure is looking tired…! 🙂
I would love to comment on your statement Verne, with the market looking tired.
But I do not want to poke the bear, he may wake up. LOL
I agree with Dave and Peter. 2600 Seems logic. Than I would like to see a correction of about 5% at least. I am open for a crash or for a continuing crazy up market, I unlearned the ‘bias’. Turndates coming up:
20-22 nov
4 dec
12-14 dec
Biggy one!!! 27-31 dec
Cheers guys,
W
12-14 Dec a bottom I would say, rest would be guess work right now. ??
Kent, it looks like Hampson is simply looking out 18 years and programming in a healthy 12.7% annualized return for the DJIA. If this were a bear market bottom, you might say he was optimistic but not necessarily crazy. But, of course, we are not at a bear market bottom but arguably at the complete opposite of that. That, in fact, makes his 200,000 call certifiably crazy!
Some tremors in the bond market. Venezuela missed a payment, and it will not be their last. We know about Puerto Rico. GE just announced a 50% dividend cut. I understand the whipsaws in this market has forced some of us to be scalpers and swing traders. However, considering what we all would agree is limited upside, I think we have to start looking at the big picture, and employ a risk/reward calculus in making trading decisions. I am just about done trading the short term market gyrations, and as an options trader, will never enjoy lower premiums than we are now seeing to position my mid and long term trading accounts.
We witnessed yet another H.O. on Monday. We have now had fifteen, completely without precedent! If that alone does not scream danger ahead, I don’t know what will. Best of success to everyone!
Futures confirming the break of the bottom trend line of the rising wedge.
Want to see a close towards the bottom of today’s range and not a long wick.
If we close towards the bottom of today’s range that should bring more selling tomorrow.
A fumble on tax reform later this week will be the reason to pick up momo to the downside and bring panic to the bulls as Andrè mentioned.
Below 2562 in ES will break the neck line of the H&S we have been watching and the measured move will be down to somewhere in the 2532 area.
https://invst.ly/5u8cz
h/shoulders – if it breaks neckline in ES – top is in…….otherwise….bull flag – takes us up to finish the 5th…
SPX 2583 would close the gap from this morning and touch the underside of the triangle on the S&P. ES has signaled reversal now S&P has to confirm. S&P has to get above 2588 for me to to buy in to the fact we are going higher.
jod-y,
5th could “fail” at any time……. think about it……. a fifth wave failure due to price exhaustion…….
I think the market is cooked.
It is never a good idea to take the opposite side of boss because he is so accurate, but the rising wedge break tells me S&P 2417 or just below is next not new high’s. Now with that said if S&P does not touch the underside of the wedge today like ES already has – after a few days of downside we could travel back up to do so and because the angle is so steep we would make a new high when we touch is a possibility. I think if tax reform goes that is the case however if it fails – lights out!
according to max pain
these would be the closing levels for Fridays expiry in a perfect world.
http://maximum-pain.com/options/max-pain/
aapl: 172.50
SPY : 255 = 2550 spx + –
New moon nov 18 ? – 24th should be a low of sorts .
Oct 25 vix high was 1320 dow 23251.11 low spx 2544 low .
today vix high 1261 dow 23271.57 low spx 2566.56 .
spx is showing relative strength based on numbers above.
that said :
spx oct 27th low 2565.94 nov 2 2566.17 low nov 9 2566.33 low today nov 14 2566.56 low
averaging these out :2566.25 <——`-breaking below will consider this level
resistance as we move forward .
oct 25 close on spx was 2557.15
the high to low 2597.02 on nov 7 to last thursday low nov 9 2566.33
was 30.69 points down . the bounce back to 2587.66 minus 30.69 points
would target 2556.97 and would fill the gap .
spx weekly chart .
beginning on : aug 21 2017, this being a very simple wave count
aug 21 low , wave 1 aug 28 from 2417.35 to 2480.20 ( 62.85 points up )
wave 2 from 2480.20 to 2446.55 ( 33.65 pts down , a .5354 retrace )
wave 3 up from the 2446.55 low pushed beyond the 1.618 extension
at 2548.53 and poked just beyond the 2.382 extension at 2596.68
and tapped 2597.02 before turning down is what appears to be wave 4.
a .236 retrace of waves 1-3 would be a shallow retrace yet considers
2554.61-2548.53 support. going further using a .382 retrace of waves 1-3
as well as a .50 retrace of just wave 3 i get 2528.38-2521.78 which to me
would be the ideal wave 4 yet i do not trust that price targeting at this juncture .
since wave 2 was simple then we should expect a complex wave 4 and under a complex
wave scenario we should expect time to be wasted more so than price ( we could get both )
the closing high on the weekly chart for this wave 3 was the week of oct 30th yet the print high
was the week of nov 6th . a .382 time retrace from the closing high labels next week as a
Fibonacci week and a possible turn higher in wave 5 would begin then .
this leaves the market the rest of the week to finish up what ever drop is coming .
next week is all i can allow for at this juncture.
To make this a bit more complicated we have another scenario that would extend
this wave count but not by much .
2548.53-2550.33 would be the KEY SUPPORT under both scenarios .
the wave count being labeled .
1 2 i ii and wave iii being the nov 7 high and we are in a wave iv of wave 3
vs just being in wave 4.
this count
is similar to the above with wave 1 2 being the same .
wave i of this 3rd wave being the sept 18th week of high and the sept 25 week of
low being a very shallow wave ii of 3 .
if this holds true we are in a minor wave iv and not wave 4 and the support range
becomes 2542.52-2539.54.
averaging out all the main key levels :2548.53-2550.33 and 2542.52-2539.54.
2545.18 <——– is where the rubber meets the road .
Wave 2 lasted 4 – 5 trading days wave ii lasted 4 trading days
Today is the 5th trading day and depending on how you wish to look at it
the market has basically gone nowhere for the past 3 weeks.
under both scenarios we have either a wave v3 then 4 5 to go or just a wave 5
up . following that we would need to see waves A or 1 down and then wave 2 of B up before any huge downdraft .
labels as of today 1 2 i ii iii and now iv which would be closer to its end in terms of time . or its 1 2 3 and now 4 which is also closer to its end in terms of time.
options expiry's i tend to avoid and i have a dec 1 dec 13-14th and jan 2
as my key dates .
bottom line : This market is most likely not going to break down and if so
it wont last very long .
here comes Santa clause lol .
I would not Make any trading decisions based on a vote for or against the tax
reform/ tax cut / bologna yet it may move the market .
Those damn bankers brought the sun out today 🙂
Joe two quick comments about what you wrote. First that VIX high on October 25 was ahead of a double bottom that VIX subsequently put in on Nov 3 and VIX may well have now started an uptrend. I am not sure one can conclude that the lower high today in VIX necessarily is indicative of SPX “relative strength”. I would also point out that VIX has now done something it has not done in quite some time and that is to close two days above its 200 day simple moving average without spiking considerably above its upper B band. The other thing is that while it is true the first wave down could either be a wave one or a wave a, your assumption that it will not be violent I think is very much open to question for as you said, we wont know since abc is the same as one two three. I am of the opinion that the first wave down of an impulse after a top is in will indeed be terrifyingly violent, and that few will be able to avoid getting the sense that something drastic has changed. I for one do not think most folk are going to conclude that it is the a wave of a corrective structure because of its ferocity. I say this because of the incredible cascade of Hindenburg Omens we have seen that has exposed the thin breadth and weakness in the markets-fifteen to date, with the earliest due in November, and the latest next March. What I do think will happen is after the first draft down the central banks will step in with a vengeance and we will see a dramatic and very deep second wave up to set the table for the ultimate slaughter. Just my take.
SPX so weak it can’t even close the gap..
I would really like to see SPX hit 2583 today then turn..
id stick to the immediate bearish count over the next week
yet im still considering this a wave iv or wave 4 scenario .
the nyse is a bit weaker then the other index’s.
my above post stands for now until proven wrong and i am giving
this market a bit of leeway .
i don’t have my charts open yet look back at nov 2015 . we had a few
different cycles in play then yet some were the same we are heading into now
as we enter December.
sticking to my wave count yet the surprises would be to the downside.
you can also look at late 1999 for another similarity .
oh and Verne .
i looked up a few things regarding Debt the other day . i forget the link or id
post it . there is a lot of leveraged debt out there ( corporate debt ) that runs into
the years 2020- 2021 .
im with you on much of what you say , i just don’t give credit to the bankers
when the market rises .
shutting down computer . i have an hour to get finished packing and need to be on the road in 2 hours.
Peter T
the Dalton minimum overlay i have been following is still on track despite the spike in sunspots back in Sept , the sunspots should continue to collapse .
im looking for that trend if it continues to last through all next year .
the zero spot days should become more and more continuous for what may seem by some as forever !
spotless days in my opinion are a negative for the stock market and historically
a negative for GDP in the USA. Tax cuts wont change that .
I am Bearish despite the wave count yet i will continue to wait for the wave A and wave B or wave 1 and 2 set up before getting aggressive with any bearish trades .
That’s it for me .
You could be right and there are other market players with deep pockets beside the banksters. HOWEVER, anybody, and I mean ANYBODY!!, who has traded this market the last few years and seen the money dumps at one critical market juncture after another, and still thinks it was all co-incidence are living, in my humble opinon, in wonderland. I am speaking as a trader who has executed thousands of trades….
I bought this morning, es 2568 in between my on line course I am taking. A friend sent me the following.
Buying on the 10th trading day of the month and exiting for the next five days has been a winning trade since June 13th 2014. That is 41 successful trades. Theoretically, we should find out by next Tuesday. Please note, I have not verified this my self due to my on line course. Either way, I am bullish for the time being. Good luck to all.
So you bought ES once it took out the prior days low? huh.. ok..
10th trading day of the month: 8/14/17
close px
Mon, 08/14/17= 246.54
Tue, 08/15/17= 246.51 TD1
Wed, 08/16/17= 246.94 TD2
Thu, 08/17/17= 243.09 TD3
Fri, 08/18/17= 242.71 TD4
Mon, 08/21/17= 242.90TD5
Hmmnnnn….! 🙂
I took profits on my long vol trades this morning just to play it safe. I had a very tight trailing stop on my 10.00 strike calls of 0.50 VIX points and was stopped out at 12.11. I am keeping powder dry for a bit more near term clarity….
Current price action looks like double combination for wave four. If correct, we need a sharp move up to complete the C portion of the X wave then another abc down to finish Y. Just the kind of moves to maintain befuddlement for bull and bear alike… 🙂
Sold my bull position es at 2576 Back to my on line course.
es, right underneath my trend line 2578 will it break thru ?
Peter,
Since this last wave in ES is an A, B, C correction, I suppose we have so see a double bottom, or a new low, before we go back up again to a new high? Or is the nearly hit of the double bottom we saw a few hours ago good enough to count as a valid C?
Johan,
That kind of information I provide in the Chart Show or for my subscribers.
Going back through everything looking more like a W(4) and we are currently in the C wave. Looking for 2540ish before I cover.
Yep. Even though we have fallen out of the wedge, SPX if famous for falling out of channels and clambering back in. ED reversals tend to be brutal and unmistakable and this messing around makes me think we have another move up in the wings. As I alluded to before, we did see the same kind of meandering at the end of the bond ED last year before the bottom fell out so anything is possible. VIX hinting that the move down may not be done. I changed the numbering of my possible combination to see us yet to complete the b up of y, followed by c down to new lows around 2540 before the last hurrah. Have a great evening everyone!
Verne
The relative strength I spoke of was the relationship of the spx vs the Dow .
And I used the vix as part of that comparison . A lower high in the vix with a lower low in the spx
I would view as a bullish sign . We have not seen that . The nyse though did make a lower
Low . You follow the vix much closer than I do and for good measure . Your trading it
And I am not .
An A B C is not the same as a 1 2 3 , however a C wave does act similar to a 3RD wave .
The difference is a 1. 2 3 would assume a 4 and 5 to complete an impulsive wave
Where as an A B C or as you call it. 1 2 3 would not be an impulse .
You can though get an A B C wave ( A ) then another A B C ( B ) followed by 1 2 3 4 5
In wave ( C ) . Yes a bit of detail yet though’s details matter
Look at the drop into last Thursday’s low . It was a 3 wave move , hence A B and wave C
Was VIOLENT relative to wave A . Look at the various index’s and compare the ratio of
Wave C to wave A . That move was a tremor and it matches what I call a mini crash on a small
Scale .
It’s the 3rd wave or C wave that is the violent wave not the 1St wave .
At best we have an A B C ( A ) in place now and are in wave ( B ) yet if you look at the weekly
Chart if it’s better as a wave 4 or wave iv .
Given that I have my own cycles work to fit into this I will allow for the wave IV or wave 4
Scenario . This to me fits both an Elliott wave count on a weekly chart which I feel is valid
And it fits my own timing model .
As for the vix ? I’m not going to concern myself with the vix at this juncture .
I think though the vix has its own issues such as record short positions and
While it would make sense that a spike in the vix would or could correlate with a drop
In the spx , that is not always the case .
Remember that huge vix trade which expired in October ? Someone lost a huge some
On that trade most likely .( maybe not but most likely did )
The Dow and spx used to trade about 12 to 1 then it became more like 10 to 1
That being 10 Dow points to 1 spx . Look at what happens today . We may see spx drop
20 points and Dow down 80 instead of 200. My belief is there is a hell of a lot of cross trades
Going on . Same thing can develop in the vix ,
If I assume your thinking of 1 2 3 4 5 ( 1 ) traveling a long ways down then yes I’ll agree with you .
But wave 1 or A followed by wave 2 or B ? Not so much .
Look at the Dow or spx back in late 2007 , you could have sold the Oct high or you could have waited
Till late Dec and got in late . You could have even waited till May June 2008 and made a
Killing being short . Had you sold the spx short ( not the ndx ) at the March 2000 top
You again could have sold short 5 months after the top on Sept 1 2000 and done extremely
Well .
That is why I call it a topping process and I agree with Peter that being patient
Will pay off .
Your short term trading and nothing wrong with that . I do not have the luxury
Of having a real time screen in front of me 6 months out of the year .
I must be patient and when I load up on a position I have a defined trade objective
Based on time first ( I have to do that because sometimes I have little intraday info
Available ) I have traded from the Bering sea , off the coast of Russia to being in the middle
Of the Pacific ocean with nothing more than a side band radio ( am radio with long range )
At best I’ll get under though’s scenarios is Dow us down x points or Dow is at x level
And it’s a blurb . I have had to use my own paper charts . Anyways I’ve learned for my own
Piece of mind , trade based on time , set up my entries using both wave counts and time.
And wait for the set up . Get in and hold . When I’m home I can nibble and take a piece out
Of the market from time to time . But when I want a piece of the larger move and
I make a larger trade ? I wait for the set up .
That set up does not exist right now in my opinion .
I’m not going to pull out the graph paper and start charting a move I don’t see
Until December . Different style of trading is all .
I do have more info available today than in the past yet even a 7 day ride from Oregon
To los Angeles leave me with little to no phone reception for a few days .
I could use a Sat phone if need be but that’s not gonna happen on a day to day basis .
The market is topping but I don’t think it’s going to drop hard at this time .
The drop so far has been a 3 wave decline and it has stalled .
Bearish yes , huge drop doubtful right now .
Come Dec I’ll change my tune , come January ill be short .
Waves 1 and 2 or A and B are noise . Once you have the 1 2 or A B set up
Wave C or 3 can be calculated .
So as a repeat . Take a look at wave C relative to wave A on this recent decline
Into last Thursday’s low. If you do further research you might discover something .
If not then you won’t . It’s right in front of everyone to see but will they look ?
Thursday’s lows matter but for reasons I don’t think many notice .
That’s it .
Long day today and off to sleep .
Joe
Thanks Joe. When I said an abc is the same as a 1,2,3, I simply meant that with only three waves it is impossible to know if a move was corrective or impulsive. I know Peter has a rule about second waves but over the years in trying to determine whether I was seeing an impulse or not, for the purposed of my own trading I have not found that to be always the case, I have counted many five wave moves where the second wave did not retrace 61.8% and that could be due the move being part of a larger corrective b wave. Not certain about all that. I just want to get direction correct as a trader.
https://invst.ly/5uka4
we will see….
you were duly warned that a break beneath the upper trend line of the megaphone topping pattern was “risk off”……….. next support is the teal line….
BE WARNED………………https://invst.ly/5ukcn
Yet ANOTHER Hindenburg Observation! The seventh since Nov 2. I have never seen anything quite like this folk. It is possible we have a top??!!!!
bite YER tongue verne!!!
we will NEVER-EVER-NEVER have a top – think of it more like a “rest stop” on the interstate highway………….
we have a “REST STOP”! :-))
Andre did say DOWN into mid 2018…Holy Smokes!!!!
ok……only verne can read this…….. it is private… :-))
so verne, years ago i used to follow a researcher/investigator name reinhardt. He called to the day, when “the crash” was going to happen in 2008. [His call is part of the public record].
How did he do this?? He was no chartist whatsoever……….. he followed the money, followed the criminality, followed the “cost” of labor…………………
the US gov’t is run as a criminal organization. Corporations [think enron] are used to “embezzle” money from gov’t agencies, launder the funds, and then “redirect” the funds to black projects around the globe……. then the gov’t implodes these corporations to “hide” the evidence……………………
he also followed a group called LEGATUS [god’s ambassador]…… it is a catholic group began by billionaire Monahan [founder of Domino’s pizza -formed in 1987 …yes 1987]]…. He started to see a connection between this group of powerful and wealthy men, and their pilgrimage to ROME, and movements in the stock markets…..
he uncovered that upon Legatus’s pilgrimages to Rome, huge sums of money were “donated”, and weeks after the checks cleared – the markets would start to “crash”…………………………
Legatus pilgrimages are very RARE. They had an inagural one at the end of Sept of 1987. They had one in Feb. of 2000. Another one at the end Sept. of 2008…………and well they JUST had another Pilgrimage from October 17th to October 27th of 2017.
So it is about 2 weeks for the checks to clear……….. and we are starting to see the markets slump over……………….hmmmmmm…….
correlation and causation are two different understandings……for the two understandings to be “the same” would require BOTH “correlation” and “causation” to take a pilgrimage to ROME together to see the pope!
all roads lead to rome……….. :-))
That was PRIVATE people…no peeking! 🙂
I knew it…!!!! 😀
huuuuuh verne!!!! that is why i always do the following – “BE WARNED”! the markets are now fully function as a criminal enterprise……. and all those who enter – BE WARNED!
Indubitably!
They had better pay up on my long term short trades or there will be hell to pay! 🙂
You just watch. My brokerage firms are probably going to fold, lol!
so verne………. when you “read” on your journey’s – oh this price drop is another “bear trap” set up ………..[as i just did with someone who is following the RVX [russell vix] which put in incremental new highs – no blast……..]………. i have found that to be a HALLMARK of post Legatus “PILGRIMAGES” for billionaires to see the pope………. which are usually “bull traps”………………. we shall see, and i will follow closely to see if “past” behaviors are surfacing again……………. and share…….. of course do your own homework…….. this is for “entertainment” purposes ONLY…… cough……………………….. “cough”…………
I hear ya. Maybe I am just too simple a dude. When I see VIX quietly and purposefully capture its 200 dsma, all the while giving the banksters’ cash dumps the proverbial middle finger with a series of relentless bull flags, and I hear people screaming: “Bear Trap!!”, I just smile and cash in my VIX calls. Is this LEGAL??!!! 😀
Peter,
You think we have just witnessed a 1-2-3 of a 5 wave of the first minute downside move or an a-b-c corrective move. What bothers me is the two upside gaps in the SPX.
IMHO true bear markets don’t leave upside gaps.
Your thoughts?
hey harvey – if i could be so bold –
peter is under a cone of silence as per his take on wave count. He has a subscription service which he shares his count directly with his subscribers.
It is unfair of us to ask him questions as per count in the forum here……..he is kind enough to give a weekly update, which is beyond amazing…………….
Yep. The man is trying to run a business so not cool to ask for specifics. Most new folk are not fully apprised so no harm no foul bud.. 🙂
FWIW, what we now actually have is a series of DOWNSIDE gaps which remain open…
Has to be an A-B-C because of the over lap. Imho.
Once we get to S&P 2530-2540 area we should start to see impulse waves up to wrap up the final wave.
That measurement comes from the first set of waves downs @ 1.618%
100% is also a viable target. I picked 1.618 because it brings us down to the area of the prior wave 4 which is usually the target area.
Could be. I have not ruled out a series of first and second waves to the downside, which also can have what appears to be overlapping waves. VIX is warning that this decline is probably not quite done and we certainly have nothing resembling a true capitulation spike today. Very dangerous right now to make assumptions either way imho…
https://invst.ly/5ur0g
1-2, i-ii…….BE WARNED!
Yes.. C has 5 waves. I think we are still in w3 of 5. 2530-2540 should be the target zone.
I would love for this to be it but the gaps have me concerned. In the 2008 crash we would gap up in the mornings then fall out by the afternoon. The sheep think “oh here we go UP again then Blam! Dropped on their heads, rinse and repeat.
its called Pavlovian programming……..are you a dog??? This is NOT your 2008 market……………..
2+trillion of leveraged positions of shorting the vix – 2008 or NOW?
one trade market – long equities/short vix/ – 2008 or NOW?
you have entrainment technology in your pocket. time to evolve.
one word. LEGATUS!………………….. :-))
The gaps down are absolutely fascinating. I have not counted four successive gaps down on open. The first two were filled with relentless session buying to close the gap. The last two also saw persistent buying with failure to close the gap. The gaps down are also becoming increasingly violent. I wish there was a way to load a chart as I just finished labeling the price action.
Has a nice ring to it no?
LE-GA-TUS!
Rhymes with GLUTEUS MAX-I-MUS
Which is where careless bulls are gong to be aching unless they wake up and cover their U-RANUS…. 🙂 🙂 🙂
Another issue I am having now that we are further into this move is the structure of the waves. The waves look more corrective than motive. If this was it I would think the moves would be a lot cleaner looking and not so choppy.
I know some people would like to completely dismiss the role of central bank buying in this new era of stunning market intervention. I have long been of the opinion a decline in this market would come only in the face of their most strenuous objections, and unwavering determination to prevent it. If that theory is correct, choppy and overlapping is EXACTLY the kind of price action I would expect to see in a market that was rolling over on its own bloated torpidity as the clueless criminal bankster class kept futilely attempting to keep it propped up. What I would expect is for the downside intensity to gradually pick up and accelerate as they increasingly lost control, then to become a run-away train once the lemmings figure out that they had. Just my two pence. Just take a look at the recent gaps down. As I said first two days bought back to fill both gaps. Last two days no cigar, with the gaps down showing increasing intensity. If I am right, tomorrow will see and even more violent gap down, which will again be bought…rinse and repeat…
jody…….. juh’ odie………..jody!
stop having issues………… your need for “issues”……is leading me to “compulsive” eating!!!!! so ‘me’ being FAT is the last thing we want right now……..huh…… ok….. LAST thing we WANT!!!
be patient…..either the waves become motive in nature, and the Mrs. Wantanabe’s begins jumping from japanese balconies worldwide……or it corrective, and i EAT MYSELF TO DEATH!!!!!! ,,,,,,,,,,,,, cough……………… was that helpful?
lol.. not helpful but entertaining 😀
USD/JPY loosely tracks S&P and it looks like a big fat H&S is tracing out..
I am waiting for SPX 2540ish anyways to cover and go from there..
I have actually seen a reasonable looking count that has SPX declining in an expanding diagonal. While it could still be the C wave of a flat with one more high to go, there is an ominous feeling in the air methinks. I once read somewhere that diagonals exhibit the wave personality of a developing trend change that is being resisted….can anyone say….BANKSTERS??!!! 🙂
And what about poor old Mr. Wantanabe??!!! 🙂
one word VERNE – “GEISHAS”!
ROTFL!!! 🙂
Luri you said, “implodes these corporations to “hide” the evidence……………………”
Curious if you think Lehman and Bear Stearns are examples of these implosions? Do you have a guess who the Enrons are in these bull cycle?
liz,
yes. you are correct. Leahman/Bears/Merrill were “imploded”. It had something to do with the mortgage fraud, and embezzlement of vast funds from HUD…..they laundered $$ into the black budget…………
before i lost track of “reinhardt” – he was talking about looking at “private equity”. He said look at the likes of Carlyle Group, Apollo, Blackstone…….he also said track FaceBook……………………… that FaceBook was a company of “enron’esque” interest because of its CIA roots……….. He said to overlay the old stock charts of Enron over the current charts of FaceBook to know as to the “when”………….? That was back in 2011’ish……………… i lost contact with his writings after that……………..
although recently, you had the heads/ starting member of Carlyle Group all “leave” at the same time……………… hmmmmm……………….
He was also following Large health insurers………apparently the were committing HUGE medicare fraud – for fake billings to medicare. They would be handed the info for billings directly from medicare itself which led to the fraudulent billings……………………the $$’s again were then funneled to the black budget projects. He was quiet as to which insurance companies were the ones of interest…..
liz,
they were using Enron under clinton to embezzle funds – with regulators turning the other way to their rigging of the natural gas markets, off books derivatives, etc, in turn to direct those funds to put up huge power facilities in India……. In order to “outsource” America, in a major part to India, you needed to set up the energy infrastructure. this is exactly what enron was tasked so to do……..
the manufacturing outsourcing was directed to china, the services outsourcing was direct to india [for their grasp of the perfect english no doubt….]
oh yeah, and liz,,,,, i forgot to tell you…..by way of background, .the HUD embezzlement above – the defense contractors like “ratheyon” are contracted to hold the “information systems/accounting systems” for the department of Housing and Urban Development. If it was a stand alone company, it would be by far, the largest mortgage finance company in the world. ………………
Thanks Luri for your “private” info to Verne and allowing me to eavesdrop.
Looks like yesterday was swing low.
well well……..well …………looksee what we have here – a “NON EXISTANT”, imaginary leading contracting diagonal……
you know what that sets up – yes/no……………………… a “deep” retrace for wave 2 – which will “conveniently” look like a wave 5 “failure” for those that are following the wave 5 count……………………………..
ok – its “wager” time………………… put your “wagers” down…………
https://invst.ly/5uytt
Speaking of fraud, we now have an unprecedented eight Hindenburg Omen on the clock. When you think about what happens when one of these signals is triggered, namely the percentage of stocks hitting new 52 week highs and lows at the same time, it becomes abundantly clear that this focused buying is designed to hide market weakness and can only be described as one thing — MANIPULATION! This why markets ultimately often crash after these observations.
What is amazing to me is that someone figured out a fairly reliable formula to expose when it was taking place that was even more accurate than looking at market breadth alone. Apart from that technical evidence of market weakness, luri is quite right that there is massive fraud and malfeasance lurking below the surface in this bloated market that yet has to be exposed. There is nothing new under the sun. The corruption during the Obama years was probably worse than during the Clinton era, if that is even possible. Social mood is changing for the darker. It will eventually all be exposed. Some companies are going to loose half their value overnight. Few are connecting the dots with what just happened in Saudi Arabia. Prince Salman, affectionately know as MBS, just took out a number of CIA puppets, including “Bandar Bush”. These guys were a piggy bank for corrupt and seedy branches of that intelligence service and they just sustained a major hit. This Saudi detritus got protection for their lives of debauchery and corruption in exchange for funding this lawless agency. MBS royally cleaned house. Why do you think that other puppet Bezos just sold a billion worth of AMZN stock? He knows the house of cards is starting to crumble and is getting out while the getting is good. Follow the money people!
Remember the days when futures would be up triple digits? Been awhile hasn’t it?
Indeed time to place your wagers…time is running out….
https://invst.ly/5v0iq
ok….can i get some odds here, on this chart playing out as indicated……
https://invst.ly/5v0lv
As of yesterday’s close I think a few patterns were still in play and one was an ED for a wave C of a fourth wave. That got eliminated this morning. It still could be an expanding diagonal for a first wave down that completed yesterday with a deep second wave underway, OR, we could be getting the b wave of a larger abc for the fifth wave zig zag of the expanding diagonal. If VIX breaks its 200 dsma at around 11.15 we are probably in a fifth wave up.
yes verne – i was WRONG – we are in the 5th
Qs did break out upwards from a falling wedge so it does look like we are in the final thrust to a top…shiver me timbers matey! 🙂
SPX 2589 – 2590 area is what I am watching. As I mentioned earlier in the week SPX never touched the bottom of the rising wedge as ES did.. Want to see if it touches there and reverses.
Yep. I think a real impulse up should take out 2587.66 today at the very least. If it stalls in that area it could be the fourth wave is quite yet done.
Dropping down to a 4hr chart SPX 2588 could be in play as well. We are there now so curious if we start back down. If that was it for W(4) it was really shallow. I agree this could be the W(B) of 4.
any comments as to the speed [short cover] of this “final” move?? i was expecting more of a meander up to a peak……. hmmmm……
It has the smell of a “bear market” rally. These ferocious manic moves up are often a head fake and especially so when occurring on meagre volume…could be short covering but I am not sure what the catalyst would have been…
If this move up is nothing more than phoney baloney we will know by the close as most of it will likely not stick and we will see a push back into the green by VIX. I think it is still a little early to call….
opex tomorrow……………..which explains speed of the move…… gotta get paid!
Looks like final wave up is indeed underway. Lots of technical reasons why this seemed unlikely but price is what it is. Question now is how high?
This website is for educational purposes relating to Elliott Wave, natural cycles, and the Quantum Revolution (Great Awakening). I welcome questions or comments about any of these subjects. Due to a heavy schedule, I may not have the time to answer questions that relate to my area of expertise.
I reserve the right to remove any comment that is deemed negative, is unhelpful, or off-topic. Such comments may be removed.
Want to comment? You need to be logged in to comment. You can register here.